Participants
The present sample comprised subsamples of the research consortium ADOPT (Affective Dysregulation—Optimizing Prevention and Treatment), which analyzes the effects of stepped care interventions in children with AD [14].
Pre-pandemic recruitment
Before the pandemic, three samples with AD (AD group, n = 487) were recruited based on high scores on a caregiver-rated screening for AD in the ADOPT project (DADYS-Screen; ≥ 90th percentile; [25]: one screened community sample and one clinical sample (with adoptive or biological caregivers) and one out-of-home care sample. Additionally, three samples without AD (No AD group, n = 821) were recruited: one screened community sample with typical or subclinical scores (> 10th and < 90th percentile; No AD11-89) and one screened community sample with very low scores (≤ 10th percentile, No AD0-10)—both with either adoptive or biological caregivers—and one out-of-home care sample with typical, subclinical, or very low scores (< 90th percentile; No AD0-89). The screened community samples were recruited through residents’ registration offices in four German cities. The clinical sample was recruited in six child psychiatric outpatient units in Germany and the out-of-home care samples were recruited through out-of-home care institutions and foster families. For inclusion in the ADOPT trials following the screening, patients had to fulfill the following criteria: age between eight and 12 years, intelligence quotient above 80, no mental disorder that could explain the symptoms of AD (e.g. autism spectrum disorder), and no current behavioral therapy for the treatment of AD. Families in the AD sample who participated in the subsequent trials were randomized to a treatment or a treatment as usual (TAU) condition.
Pre-pandemic data collection
Data on potential risk and protective factors including sociodemographic characteristics, child characteristics, and caregiver characteristics were taken from the first in-depth assessment following the screening questionnaire, in which clinical, caregiver, and child report were used. In the No AD11-89 group, only caregiver report was assessed. Predictors were assessed between 2 November 2018 and 22 December 2020, although 96.2% of these data were collected by 28 February 2020, before the implementation of the COVID-19 measures. All data were collected either online via the REDcap electronic data capture tool hosted at the Clinical Trials Centre Cologne or offline in pen-and-paper format.
COVID-19 data collection
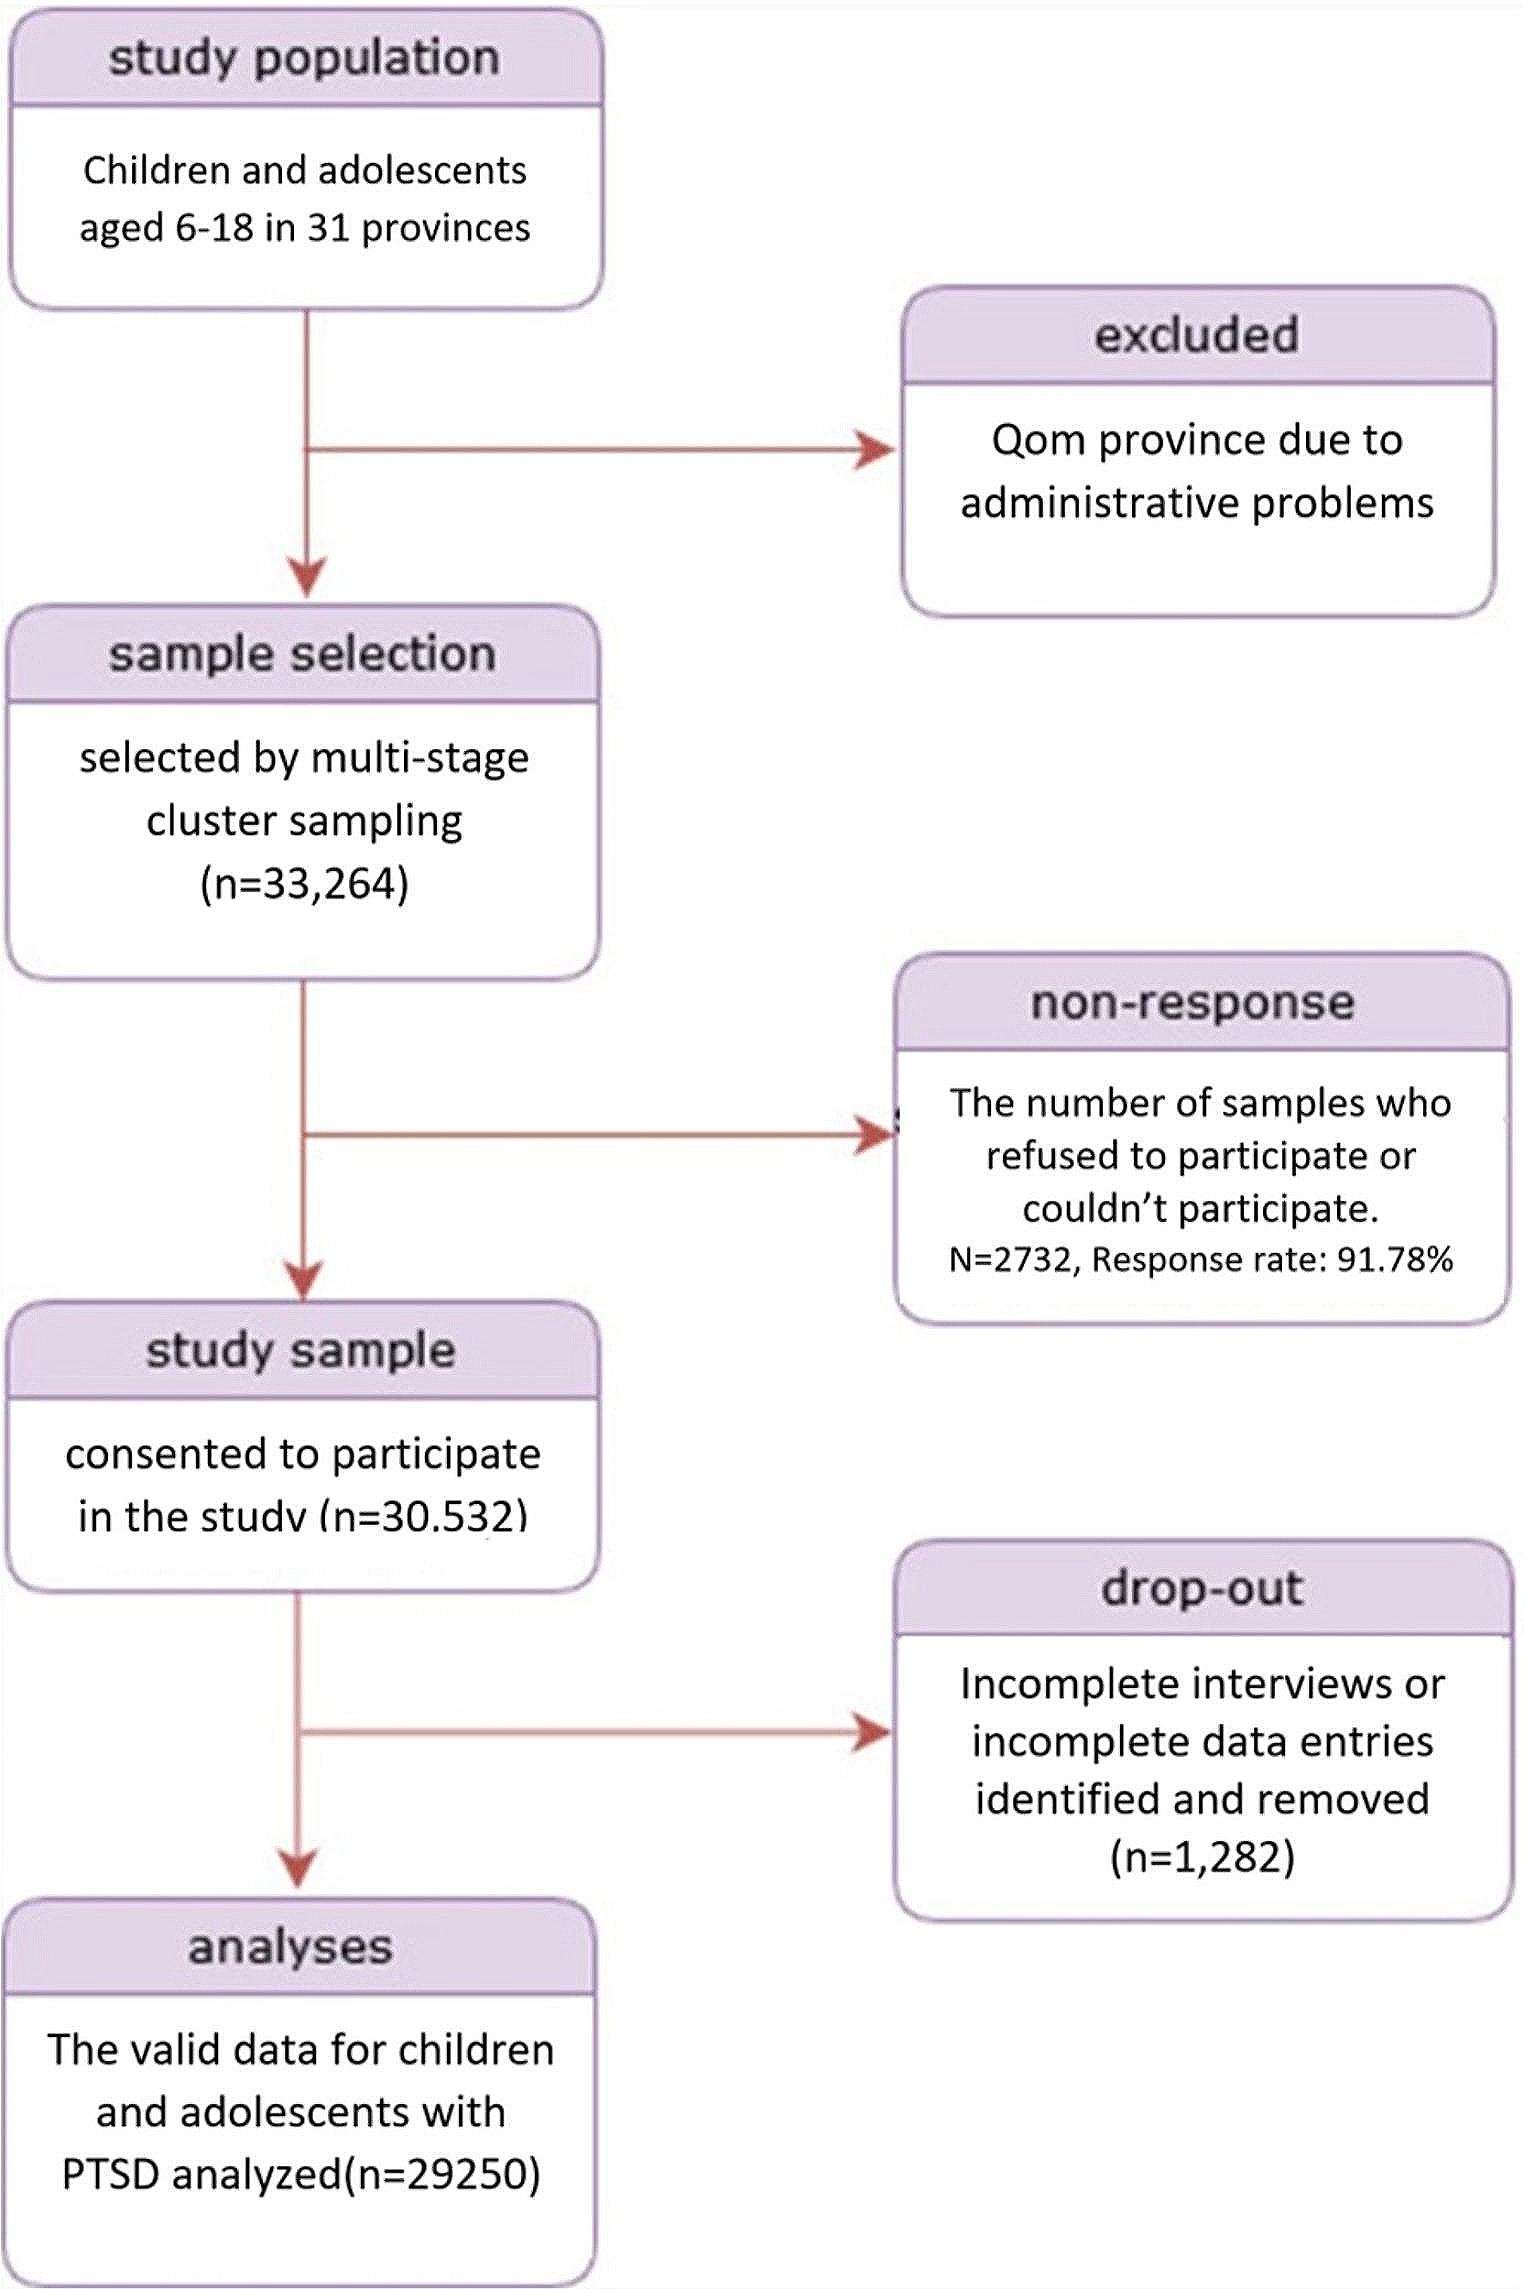
All families who participated in the intensive assessment following the screening questionnaire were asked to participate in the present study on COVID-19-related stress (n = 1308). The response rate for the assessment of COVID-19-related stress was 59.7% (n = 781). The patient flow and the composition of the present sample are depicted in the flowchart in figure S1. The COVID-19-related data were collected between 28 May 2020 and 22 December 2020, although 97% of the data were collected by 31 July 2020. The interval between the assessment of the predictors and the assessment of COVID-19-related stress ranged from 0 to 28 months, with a mean of 14 months (SD = 3.99).
MeasuresCOVID-19-related stress
The Corona Child Stress Scale (CCSS; [26], see table S1) captures pandemic-related changes in relationships with family and friends, changes in child internalizing and externalizing symptoms, changes in school, working or family conditions, and changes in treatment according to caregiver report (CCSS-P: 14 items) and child report (CCSS-C: nine items). Some of the items were based on the CRISIS questionnaire [27], translated and adapted for our research purposes and sample. The items were rated on a 5-point Likert scale ranging from -2 (= much less stress) to 2 (much more stress). We developed two main scales: a total stress scale for all families (CCSS-P-Stress: 11 items, CCSS-C-Stress: seven items) and a treatment-related caregiver rating scale in the subgroup receiving therapy (CCSS-P-Treat: three items). In addition, we calculated the CCSS-P-Stress-internal (seven items) subscale, consisting of those items of the caregiver-rated total stress scale focusing on internal factors—that is, the perceived stress following changes in external conditions. Mean item scores were calculated for each subscale. In the current sample, internal consistency of the subscales was sufficient to good, ranging from α = 0.74 to α = 0.82.
Predictors of COVID-19-related stressSociodemographic characteristics
We considered gender of child, age and country of birth of child and caregivers, native language (German, other than German) and migration background of child (native, first generation, second generation) in line with PISA [28], school type (primary, secondary), school grade, special educational needs (yes, no), number of biological parents, single parent status of primary caregiver (yes, no), educational and occupational status of caregivers based on Lampert et al. [29], and family adversity based on the Family Adversity Index (cf. [30]).
Child characteristics
AD symptoms were assessed using the Diagnostic Tool for Affective Dysregulation in Children (DADYS; [31]). The DADYS captures emotional lability, emotion regulation, negative emotional reactions, and negative mood in clinical interviews for caregivers (13 items) and children (10 items) and in questionnaires for caregivers (36 items) and children (26 items). As a second measure of AD, we assessed the subscales anxious/depressed (13 items), attention problems (10 items), and aggressive behavior (18 items) of the Dysregulation Profile [32] from the German version of the caregiver-rated Child Behavior Checklist (CBCL/6-18R); [33]. Mental disorders were assessed using the Diagnostic System for Mental Disorders in Children and Adolescents according to ICD-10 and DSM-5 (DISYPS-III); [34]. From the DISYPS-III, we deployed the therapist-rated diagnostic screening checklists for internalizing symptoms (19 items) and externalizing symptoms (9 items) based on caregiver interview, the caregiver- and child-rated symptom checklists for attention-deficit/hyperactivity disorder (20 items) and disruptive behavior disorders (28 items), and the caregiver-rated symptom checklists for attachment disorders (ten items) and posttraumatic stress disorder (19 items). Emotion regulation strategies were examined using the Questionnaire for the Regulation of Frustration in children (FRUST); [35]. The FRUST captures caregiver-rated and child-rated adaptive emotion regulation strategies (10 and 33 items, respectively) and maladaptive emotion regulation strategies (4 and 7 items, respectively). We assessed quality of life using the child-rated KIDSCREEN-10-Index (10 items) and the caregiver-rated KIDSCREEN-27 (27 items); [36].
Caregiver characteristics
Caregiver AD symptoms were assessed using the Aggression and Hostility subscale (five items) from the German version of the Brief Symptom Checklist (BSCL); [37]. Moreover, a broad spectrum of psychopathology was examined using a short nine-item version of the German version of the Symptom Checklist (SCL-K-9;[38]). The Positive and Negative Parenting Questionnaire (FPNE; [39]) was administered to capture positive parenting behavior (13 items) and negative-inept parenting behavior (10 items). As potential protective factors, we measured family climate (nine items) using the Family Climate Scale (FCS); [40], social support (eight items) using an adapted short version of the Social Support Scale (SSS),[41], and personal resources (five items) using the Personal Resources Questionnaire (PRQ), [42].
COVID-19-related changes in external conditions
We analyzed the four items of the caregiver-rated total stress scale (CCSS-P-Stress) focusing on external conditions (childcare, working conditions, family conditions, leisure options) as potential risk factors for COVID-19-related stress.
In the current sample, all scales on risk and protective factors demonstrated sufficient to excellent internal consistencies (α = 0.73 to α = 0.97). For more details, see table S2.
Data analysis
All statistical analyses were performed using SPSS 28 [43]. Missing data were imputed using the expectation maximization (EM) method on the item level for each scale separately if at least 90% of the items were available. Items of the respective scale were used for the imputation prediction.
Differences in sample characteristics between the participating and non-participating families and between the AD and No AD group were calculated using χ2 tests for categorical variables and t-tests for continuous variables. As a measure of effect size, we calculated Cohen`s d [44] for continuous variables and Phi for dichotomous variables. In line with Cohen [44], we used the following interpretations for d: 0.20 ≤ d ≤ 0.39 as small, 0.40 ≤ d ≤ 0.79 as moderate, d ≤ 0.80 as large, and the following interpretations for Phi: 0.10 ≤ ϕ ≤ 0.29 as small, 0.30 ≤ ϕ ≤ 0.49 as moderate, ϕ ≤ 0.50 as large.
In line with our first aim, we compared the caregiver- and child-rated COVID-19-related stress levels of the AD group with those of the No AD group, and the caregiver- and child-rated COVID-19-related stress levels of the subsamples with adoptive or biological caregivers with those of the subsamples from out-of-home care, based on child and caregiver report. The primary outcome was caregiver- and child-rated COVID-19-related stress on the scale level and the secondary outcome was caregiver- and child-rated COVID-19-related stress on the item level. Differences in COVID-19-related stress between two groups were calculated using Mann–Whitney U tests for the item level and t-tests for independent samples for the scale level. Differences in COVID-19-related stress between three groups were calculated using Kruskal–Wallis tests for the item level and one-way ANOVAs for independent samples for the scale level. One-way ANOVA contrasts were subsequently performed for significant differences between three subgroups. For pairwise comparisons, we used Cohen`s d as a measure of effect size using the interpretation mentioned above. For comparisons of three groups, we used partial eta squared, with the following interpretation [44]: 0.01 ≤ ƞ2p ≤ 0.05 as small, 0.06 ≤ ƞ2p ≤ 0.13 as moderate, ƞ2p ≤ 0.14 as large.
In line with our second aim, we calculated the proportion of families describing improvements (− 2 or − 1 on the item level; − 2.00 to − 0.50 on the scale level) and deteriorations (0.50 or 2 on the item level; 0.05–2 on the scale level) on treatment-related items and subscales according to caregiver report.
In line with our third aim, the analysis of risk and protective factors of COVID-19-related stress, we used the child-rated total stress scale and the internal subscale of the caregiver-rated total stress scale as criterion in children with and without AD. Sociodemographic variables, child and caregiver characteristics, and perceived changes in external conditions were used as predictors. We developed the models for the AD group and the No AD group separately to be able to depict risk and protective factors in a more detailed way for each group. First, we calculated Pearson correlation coefficients for continuous variables and point-biserial correlation for dichotomous variables. Risk and protective factors were only included if the correlations with the respective criterion were significant (p < 0.05) and at least small (r ≥ 0.10); [44]. To avoid multicollinearity, the variable with the strongest correlation with the criterion was included in the case of very high correlations between predictors (r ≥ 0.80). To construct the final model, we used backward elimination, i.e., items were excluded stepwise from the initial model if they did not reach a significance level of at least p = 0.100. To evaluate the strength of predictors and the total model, we used Cohen`s f2 for the regression analyses with the following interpretation [44]: 0.02 ≤ f22 ≤ 0.14 as small, 0.15 ≤ f2 ≤ 0.34 as moderate, f2 ≤ 0.35 as large.


留言 (0)