
記住我


We conducted our original searches in July and August 2015, identifying 5,931 records, of which 5,495 were screened, after removing duplicates (n = 436). Title and abstract screening identified 42 full-text articles of which ten were eligible for inclusion. We updated the same searches in March 2023 and February 2024 and identified 25,414 records, of which 17,024 were screened, after removing duplicates (n = 8,390). Reverse citation searching identified one additional eligible paper [38] that had not been identified in the original review.
Title and abstract screening identified 62 articles for full-text review, of which 14 were eligible and 48 were excluded for the following reasons: the sample was predominantly over 18 year olds, (more 90% aged ≤ 18 years) (n = 27), the sample included participants without depression at baseline (n = 11), the intervention was mixed and not standalone BA (n = 5), the BA was not developed for depression (n = 1), depression was not included as an outcome (n = 1), the inclusion criteria were not specified (n = 1), pre/post data was not included/was missing (n = 1), the reporting paper was inaccessible (n = 1). (Reasons for exclusion can be seen in Supplementary Information S2). Where necessary, authors were contacted to request additional information during data extraction.
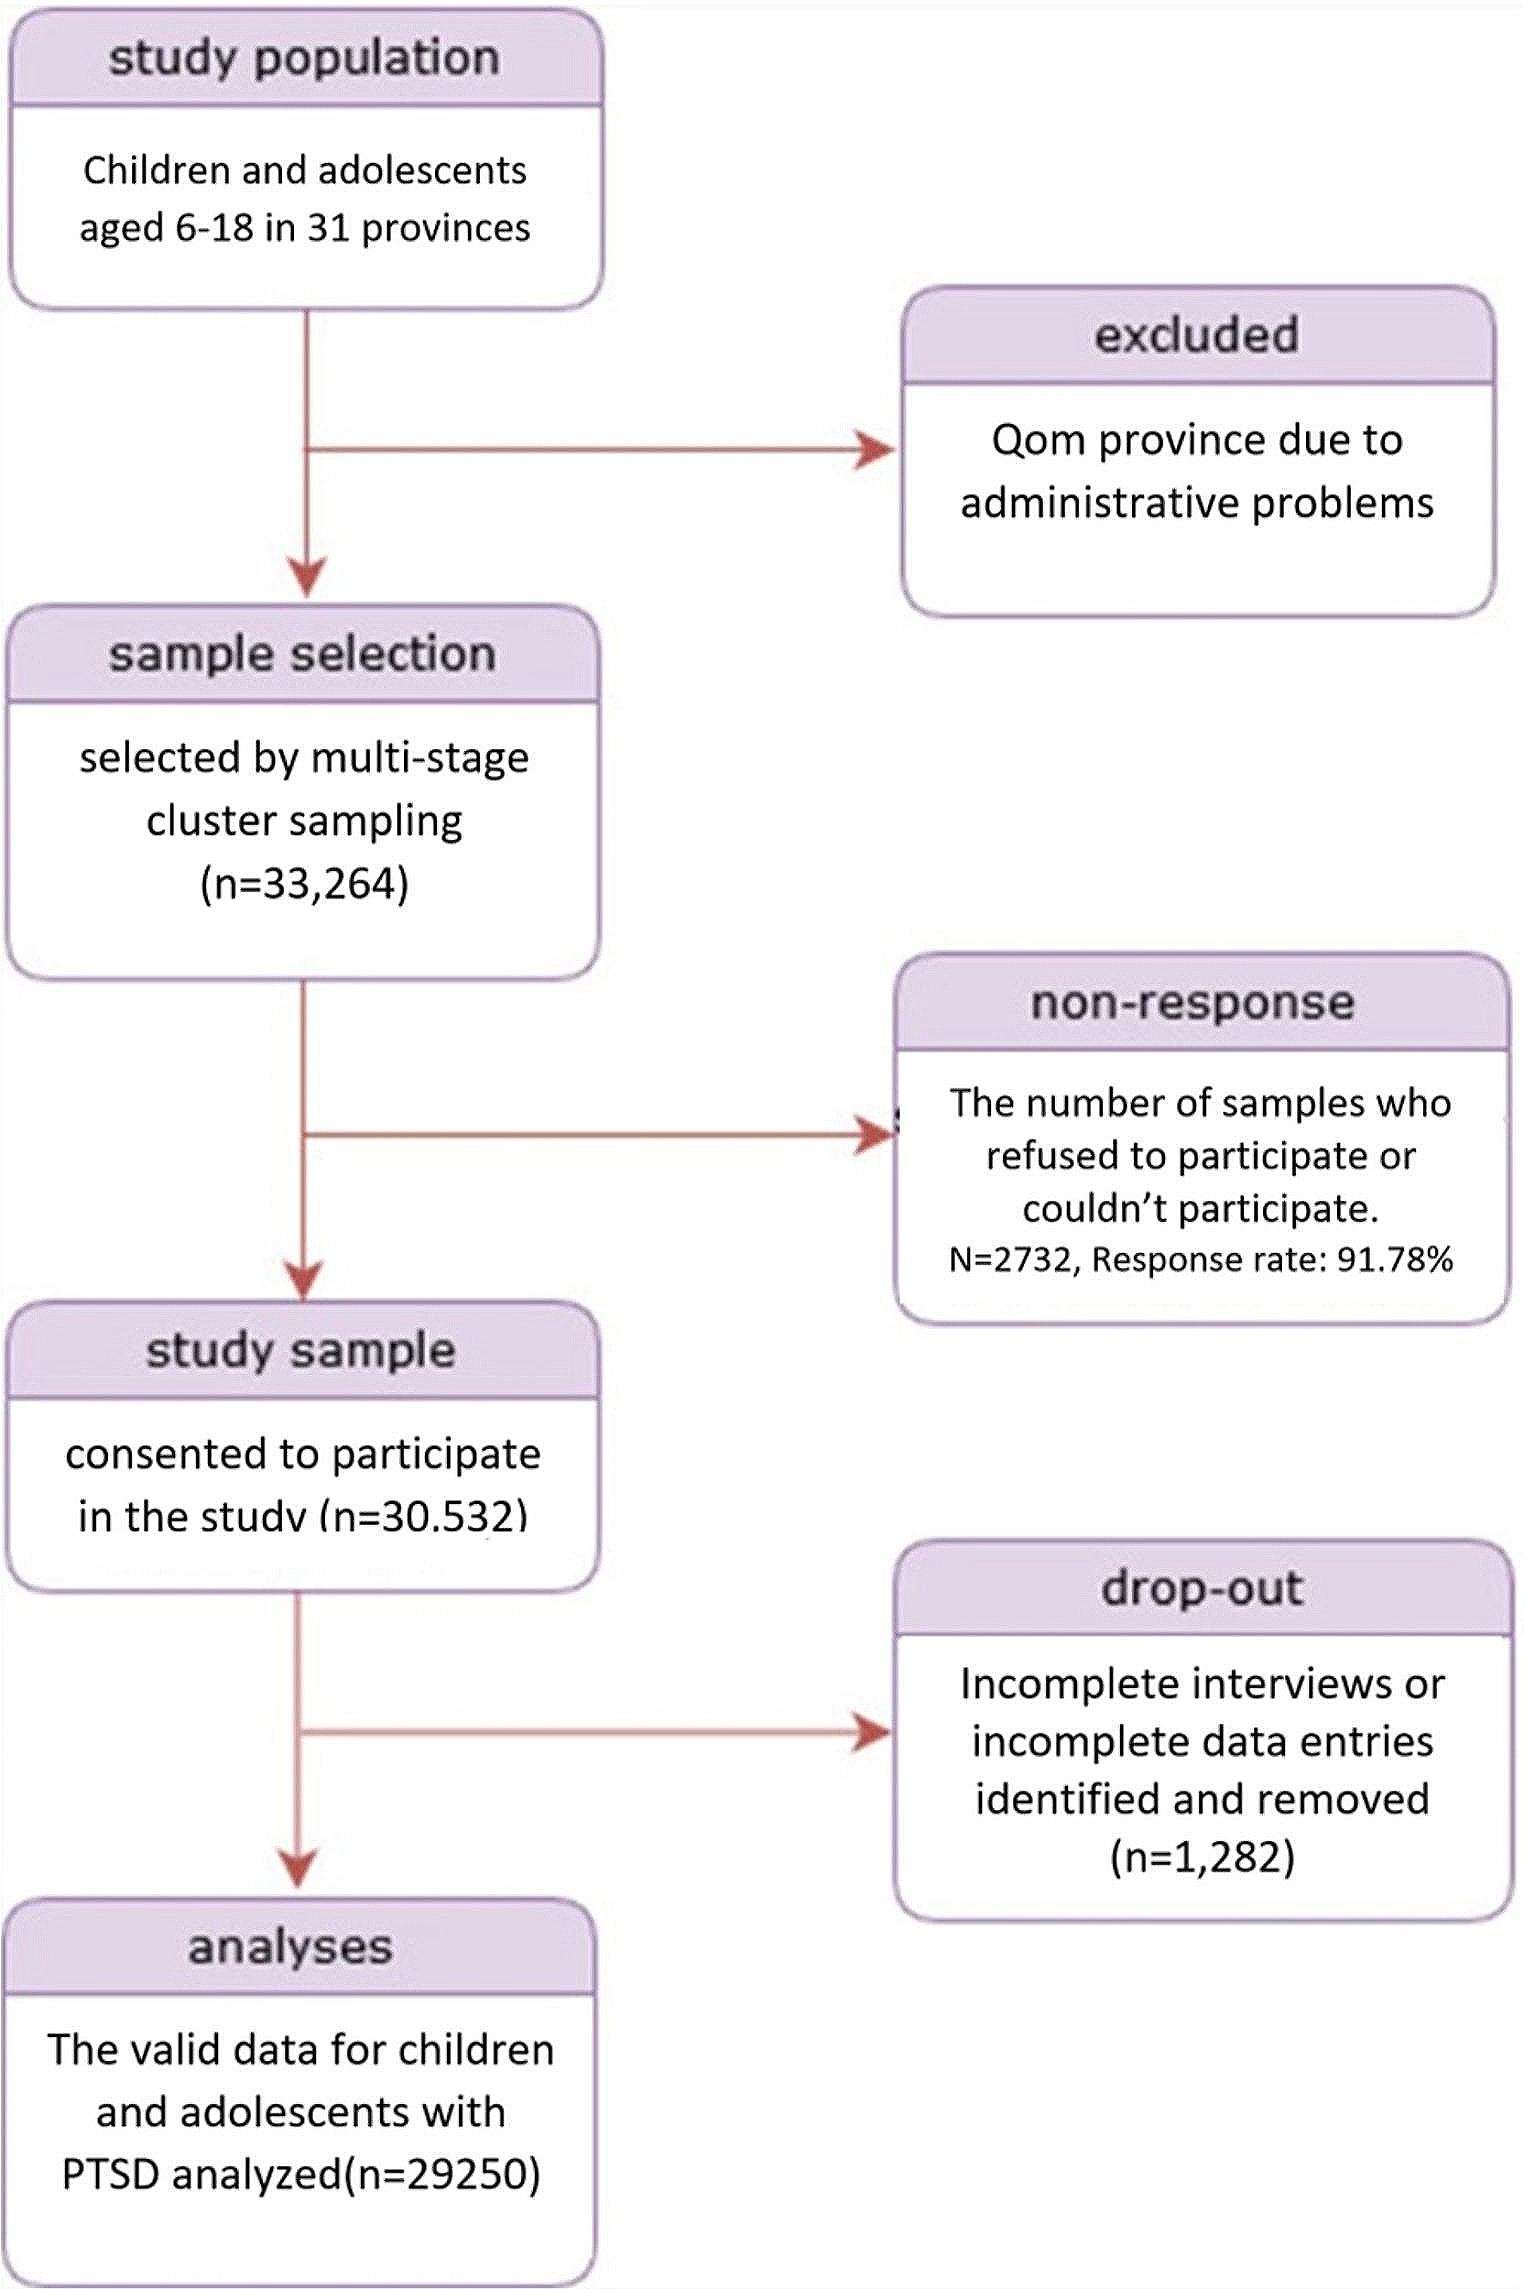
The PRISMA diagram of the updated searches is presented in Fig. 1, the PRISMA of the earlier review can be found in Tindall et al. [14].
Fig. 1
PRISMA Diagram. From: Moher D, Liberati A, Tetzlaff J, Altman DG, The PRISMA Group (2009). Preferred Reporting Items for Systematic Reviews and Meta-Analyses: The PRISMA Statement. PLoS Med 6(7): e1000097. doi:0.1371/journal.pmed100009.
Characteristics of included studiesStudy designA total of 24 studies, published between 1985 and 2024, met our inclusion criteria. Six (6) were RCTs [16, 23, 32,33,34,35] and 18 were pre-post evaluations [17, 18, 38,39,40,41,42,43,44,45,46,47,48,49,50,51,52,53] in which outcomes were measured at baseline and at a minimum one follow-up point. The pre-post-evaluations included single case studies, one-group within-participant designs and multiple non-randomised groups.
SampleParticipants were between 8 and 18 years old. The largest study by Schleider et al. [23] included 2,452 participants, whereas the total sample size across the remaining 23 studies was 306 participants, ranging from single case studies to 60 participants [35]. Most studies (n = 15) included a higher proportion (> 50%) of girls/young women (n = 8) or a female-only sample (n = 7), and only 5 studies had a gender balance or included more boys/young men.
Study settingsMore than half of the studies (n = 14) took place in the USA [23, 32, 33, 35, 38, 40, 42, 43, 45,46,47,48,49, 52], and the rest we carried out in the UK (n = 7) [16,17,18, 39, 42, 44, 53], Australia [51], Sweden [34] and the United Arab Emirates [50]. BA was delivered in clinics/treatment centres (n = 15), schools (n = 8) and the community (n = 1).
Interventions and comparatorsIn 20 of 24 studies BA was delivered in-person by professionals including clinical psychologists, students (graduate, doctoral and post-doctoral), mental health clinic staff, social workers, school counsellors, psychological wellbeing practitioners and study therapists. BA was delivered online in two studies [23, 34] and via videocall in two studies [41, 53], one of these due to the COVID-19 pandemic.
The number of BA sessions ranged from 1 to 22, with a typical frequency and duration of weekly sessions lasting 20–30 min or 1 h. Most studies delivered BA in one-to-one sessions, although two studies [33, 45] were group BA. Twenty (20) studies followed a standardised treatment manual for professionals, and three of those [17, 41, 51] also used a workbook for young people.
Comparators in RCTs included a waiting list, usual care (e.g., CBT, medication, Psychodynamic Therapy, IPT) and/or alternative psychological and supportive therapies (e.g., Self-Control Therapy, Supportive-Control Therapy, Growth Mindset Single Session Intervention [GM-SSI]) or a psychological placebo.
Outcome measuresCDRS-R [30] and the Kiddie Schedule for Affective Disorders and Schizophrenia (K-SADS) [54] were the most frequently used depression outcome measures. Eight (8) studies also assessed anxiety. Only two studies [34, 42] reported QoL data using the Family Quality of Life Scale (FQOLS)and KIDSCREEN-10 index, respectively. The outcome measures are detailed in Table 1.
Table 1 Characteristics of included studies by study designQuality assessmentsQuality of RCTsUsing RoB-2, only Chu et al. [33] was found to have low risk of bias across all 5 assessed domains. There were ‘some concerns’ of bias in Grudin et al. [34], whereas the remaining four RCTs [16, 23, 32, 35] had a high risk of bias overall (Fig. 2). The domains with lowest scores for risk were ‘randomisation process’ and ‘bias in outcome measurements;’ the domain with the highest scores was ‘bias due to missing outcome data.’
Fig. 2
RoB-2 included RCTs (n = 6
The Moncrieff Scale scores for the RCTs (Table 2) ranged from 26 [16] to 38 [23]. All studies received two points for method of allocation, use of diagnostic criteria, recording exclusion criteria, describing outcome measures clearly, presenting results with inclusion of data for re-analysis of main outcomes and providing justified conclusions. All but one study [35] attained two points for providing objectives, specifications and main outcomes a priori and employing a representative sample. The domains with the highest risk of bias were for ‘conducting assessments of treatment compliance’ and ‘providing information on comparability and adjustment for difference in analysis.
Table 2 Moncrieff Scale – included RCTs (n = 6)Quality of pre-post evaluationsMoncrieff Scale scores for the pre-post evaluations ranged from 8 to 28 (Table 3). Only one domain—‘outcome measures described clearly’—attained two points across all studies. Most studies (15/18) attained two points for providing clear descriptions about treatments and sample demographics. None conducted power calculations, blinded assessors, or provided information about side-effects. Furthermore, the Moncrieff Scale guidelines stipulate that samples of < 50 participants receive a score of zero [27]. As the maximum sample size employed in the pre-post evaluations was 36 all received zero on this domain. Across the remaining domains, most studies attained a score of one or two suggesting measures had been taken to minimise bias.
Table 3 Moncrieff Scale – included pre-post evaluations (n = 18)Depression outcomesSupplementary information S3 and S4 give details of individual study results. Below we summarise results across studies for each outcome measure.
Depression outcomes from RCTsCDRS-R: Reductions in CDRS-R scores were demonstrated in four RCTs [32,33,34,35]. In Grudin et al. [34] scores reduced from pre-to-post-treatment, and then again at 3-months follow-up, in both the guided and self-guided BA groups. In the usual care group, although CDRS-R scores reduced from pre-to-post-treatment, little further reduction was seen at 3-months follow-up. Across time points these reductions were significant for the guided BA group (B = − 11.3, p < 0.001, 95%CI − 14.9 to − 7.7) and the self-guided BA group (B = − 10.38, p < 0.001, 95%CI − 13.93 to − 6.82), but not usual care (B = − 4.40, p = 0.077, 95%CI − 9.33 to 0.52, p > 0.05).
In McCauley et al. [35] 76% of those randomised to BA scored ≤ 40 at post-treatment, indicating a depression diagnosis to be either ‘unlikely’ or ‘possible’, compared to 42% of the usual care group. Chu et al. [33] reported CDRS-R scores reduced from pre-to-post-treatment in the BA group, and increased in the wait-list group but statistical analyses were not performed. Finally, in Stark [32], CDRS-R scores reduced across time-points in all groups (BA, Self-Control Therapy, wait-list). Reductions were the greatest in the Self-Control Therapy group, followed by the BA group. The difference between groups at post-treatment was not significant (p < 0.30).
MFQ/SMFQ: Kitchen et al. [16] administered the Mood and Feelings Questionnaire (MFQ) which generates scores between 0–66 with higher scores representing worse mood. Larger mean reductions were reported from baseline to 6-months follow-up in the BA group (-18.11: n = 11, M = 33.91, SD: 11.80 to n = 5, M = 15.8, SD:6.22) compared to usual care (-8.8: n = 11, M = 35.55, SD:11.09 to n = 6, M = 26.67, SD: 12.6) on this measure. Grudin et al. [34] reported significant reductions on the Short Mood and Feelings Questionnaire (SMFQ) scores across all groups (guided-BA: B = − 4.4, p < 0.001, 95%CI − 6.2 to − 2.6; self-guided BA: B = − 3.39, p < 0.05, 95%CI − 6.48 to − 0.30; usual care: B = − 4.04, p = 0.001, 95%CI − 6.22 to − 1.86). In McCauley et al. [35] SMFQ scores reduced for both BA and usual care from pre-to-post-treatment, but with no statistical significance (p = 0.53).
CDI: In Stark [32] CDI scores reduced across all groups from pre-to-post-treatment and then to follow-up, with greater reductions seen in the BA and Self-Control group (ANCOVA test p < 0.01). Similar results were found by Schleider [23] who administered the short-form CDI (CDI-SF) and reported reductions across all groups from baseline to 3-months follow-up. Compared to the control group, those in the BA group and the active comparator group (Growth Mindset: GM) demonstrated significant decreases in depression from baseline to follow-up (BA: t(1,673) = − 3.62; Padj < 0.001; d = 0.18; 95% CI 0.08 to 028, GM: (t(1,629) = − 3.53; Padj < 0.001; d = 0.18; 95% CI, 0.08 to 0.27). No significant differences from baseline to follow-up were found between the two active treatment conditions.
CDS: Stark [32] also reported reductions in CDS scores across all groups from pre-to-post-treatment and then to follow-up, with no statistical significance found between groups (p < 0.07). Chu et al. [33] reported larger reductions in CES-D scores for the BA group than the wait-list group but statistical tests were not performed. Figure 3 provides a graphical display of all depression outcome measures across RCTs.
Fig. 3
Forest plot of outcome measures for depression, by study
Except for Chu et al. [
留言 (0)