Data sources
In this section we introduce the data sets that are being used in this study. Dutch policy makers are interested in small area estimation of many different surveys. It is important to verify that machine learning is able to adapt to each of these surveys, which can have quite different characteristics. The method could then be used in the future to automatically produce the desired estimates. We consider three surveys:
1
“Health Monitor Adults and Elderly” (HeMo)
2
“Housing Research of the Netherlands” (WoON)
3
“Experienced noise disturbance from traffic” (Noise) subsurvey of HeMo.
For the survey data sets we construct a corresponding population data set with features based on administrative data provided by Statistics Netherlands. The population data set includes the entire Dutch population, aged 18 years or older for the year of the survey, with the exception of institutionalized people who are not included in either survey. A secured identification number that links each survey to the administrative data was assigned to each respondent. Authorization for this linkage was provided by CBS. Disclosure and tracing of individuals is not possible. The data sets are summarized in Table 1. The outcomes and features will be described in further detail in the next sections.
Table 1 Data sets used in this studyHealth monitor—HeMo
The Adult and Elderly Health Monitor (HeMo) is an extensive national survey about self-reported health and well-being. The survey is administered every four years by the MHS regions in collaboration of the National Institute for Public Health and the Environment (RIVM) and Statistics Netherlands (CBS). At the time of writing, data has been collected for years 2012, 2016, and 2020. In this paper we consider the results of the 2020 survey. Data were collected in September 2020 on 539,895 respondents (3.9% of the Dutch adult population) by an online questionnaire [1]. We consider 34 binary health indicators chosen from the survey. These include indicators like alcohol use, smoking behaviour, body weight, physical and mental health, disabilities, financial difficulties, exercise, loneliness, self perceived health and informal care giving. Table 9 in the Appendix describes all of the indicators.
Housing research of the Netherlands—WoON
The Dutch housing survey (WoON) is also a national survey, administered every three years by Statistics Netherlands (CBS) in collaboration with the Ministry of Internal Affairs (BZK). The survey gathers information about the current and desired housing situation of non-institutionalized Dutch residents aged 18 years or older. At the time of writing, data has been collected for years 2006–2018. Here we consider the results of the 2018 survey. Data were collected between August 2017 and April 2018 on 67,523 respondents (0.54% of the Dutch adult population, non-institutional) by an online questionnaire [2]. We consider eight continuous ratings of housing satisfaction from the survey. The first seven ratings are 1–5 scores (1: strongly disagree, 2: disagree,..., 5: strongly agree) and the last rating is a composite score between 1 and 10. Table 10 in the Appendix gives a full description.
Experienced noise disturbance from traffic—noise
Noise disturbance from traffic is an important subset of questions in the 2016 HeMo survey. The source of noise is identified as road, train or air traffic noise. The road noise is further divided into any noise, noise from traffic less than 50 km/h, or noise from traffic more than 50 km/h. The noise nuisance is then classified as (1) serious (2) moderate or serious, resulting in 10 indicators in Table 11 in the Appendix. The administrative data is expected to provide only limited information about how much the Dutch population experiences noise disturbance from traffic. Instead, the measured noise level at the individual’s spatial location can be expected to provide most information. RIVM has developed a noise dispersion model that predicts the noise level at each address based on actual measurements, knowledge of road and rail infrastructure, flight paths, etc. [12]. For this task, we only use the 18–64 year old population and add this as an additional feature to the administrative data. Table 12 in the Appendix describes the noise level predictions.
Administrative data for the population
The features of the Dutch population are obtained from CBS administrative data. Based on previous research and expert opinion of MHS and RIVM, we used 14 features for modelling the responses for HeMo, WoON, and Noise. At individual level we use age, sex, ethnicity, marital status, and highest completed level of education. At household level we have household type, size, income source, home ownership, income and assets and X- and Y-coordinates of the home address. At neighborhood level we have the address density. For WoON, we also add eight additional neighbourhood features to test how well the models developed for HeMo generalize. First, the percentage of uninhabited houses, single-family homes, non-rental houses, social housing, and houses built before 2000. Second, the distance from an individual’s house to the nearest forest, backwater and public green. For Noise, we include the additional noise level predictions from the RIVM noise dispersion model.
Table 2 Summary of features used for prediction in HeMo and WoONTable 3 Additional features used for prediction in WoONTables 2 and 3 summarize these features. For categorical features, the categories are given. For continuous features, the median and range are given. The percentage of missing features in the population data is provided as well. The most significant problem is the missing highest completed level of education. However, educational level is a very important predictor for health because it can be used to distinguish students that differ from other young individuals with low income. Therefore this feature is considered too important to be excluded. The handling of missing feature data will discussed in the next sections. To obtain demographic and spatial features of every individual as close to survey date as possible, we use a reference date of September 1, 2020 for HeMo. For WoON we have access to the dates on which people filled in the survey and therefore use these dates to obtain demographic and spatial information about the household on this exact date. However, several data sources are only updated yearly, so for those we use the reference date of January 1, 2018.
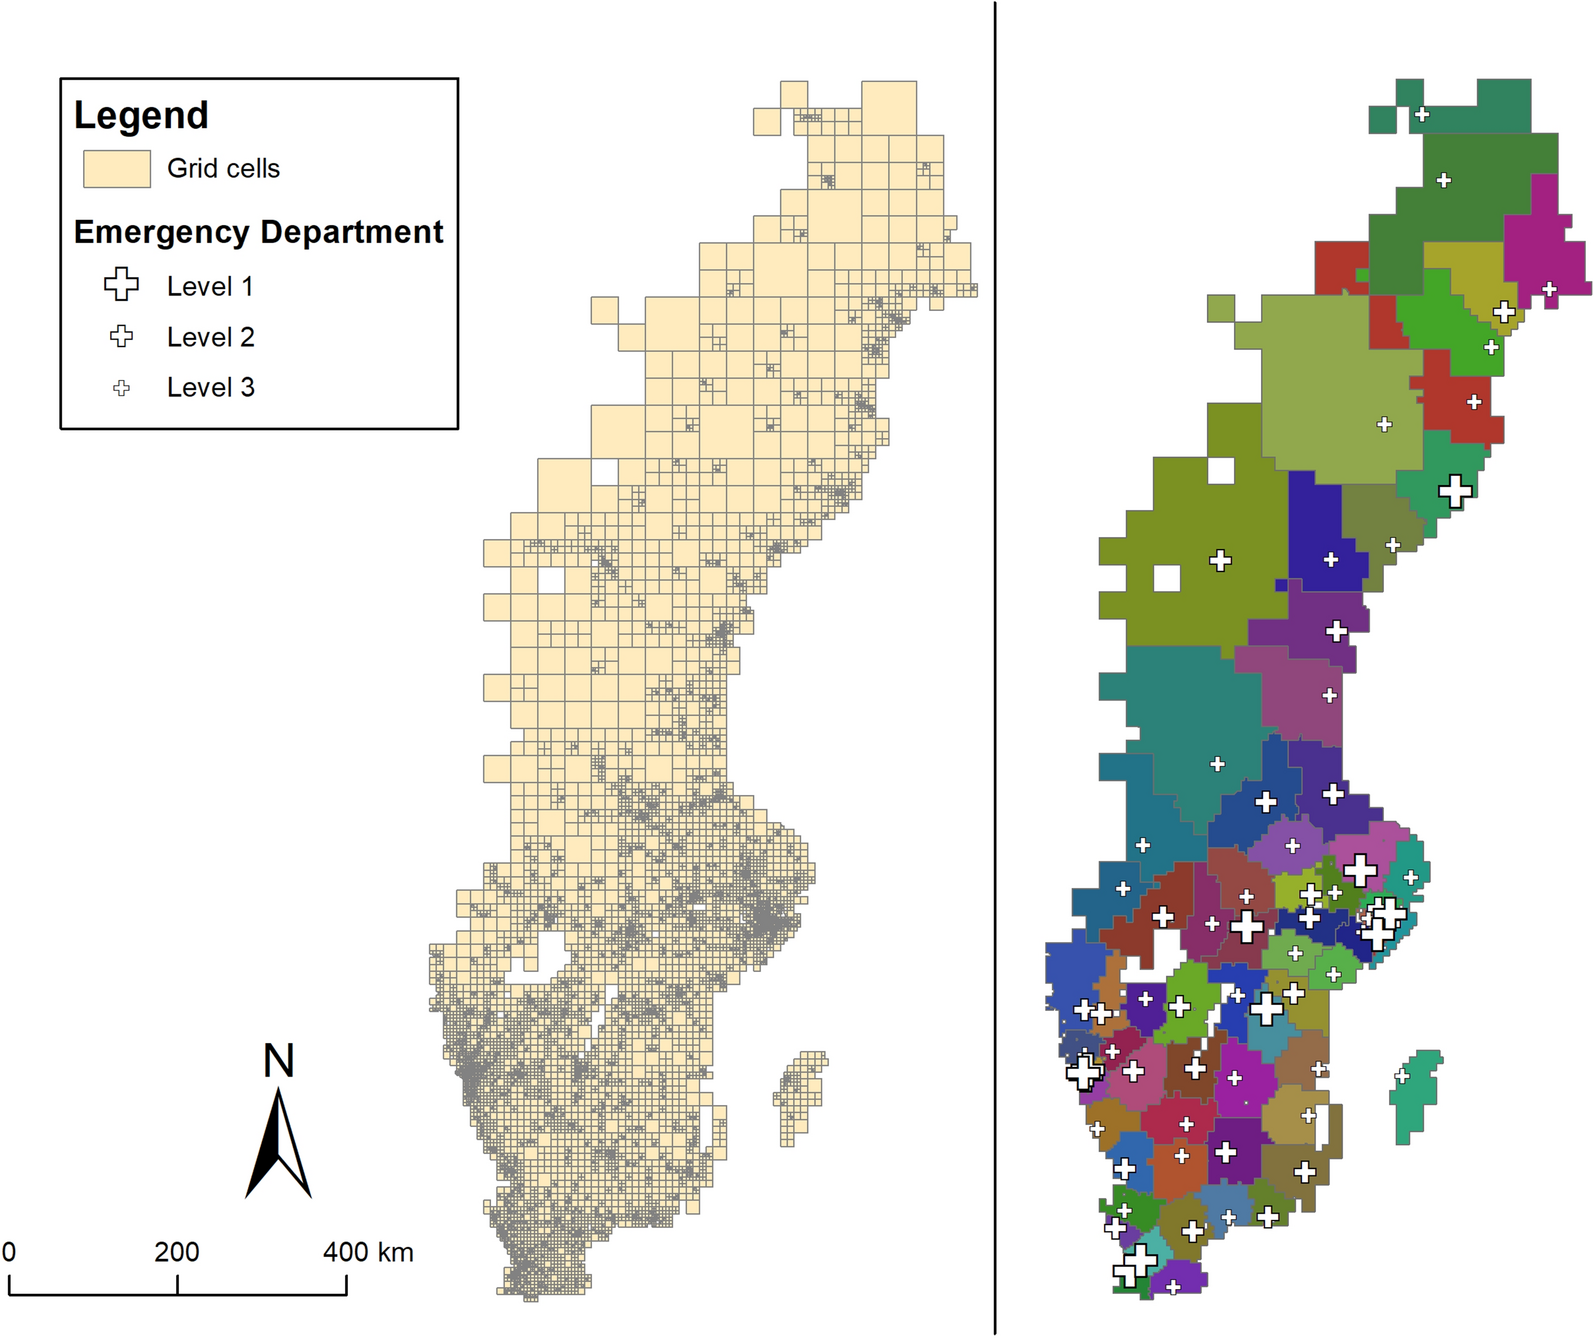
Municipalities, districts and neighborhoods
In 2020, the CBS administrative data had individuals registered in 25 municipal health regions, 355 municipalities, 3163 districts and 13,478 neighborhoods. Municipal health services work through a common system for several municipalities in a given region, called an MHS region, to carry out a number of tasks in the field of public health. Municipalities are administrative divisions that have corporate status and powers of self-government or jurisdiction. Their duties are delegated to them by the central government. Districts are nested within municipalities and neighborhoods within districts. Districts and neighborhoods are coherent regions that typically share similar population characteristics such as age, social structure, economic area, geographical features, etc. They have no formal status; they are defined for administrative purposes and data collection by CBS.
ModelsFormalization of the prediction problem
We train a model based on the observed health indicators, living quality ratings, or noise disturbance indicators using the sub-population of respondents in the survey. We then use this model to predict the missing survey responses of the remaining population and generate predictions for every adult individual in the Netherlands. From a machine learning perspective, this is a supervised learning task.
Suppose we have a set of N individuals denoted by \([N]=\\). The survey is a subset \(}\subset [N]\) of n individuals from this population. From the administrative data set we get a vector of d features \(x_i\in }^d\) for each individual i. From the survey data set we get responses \(y_i\in \\) (classification) or \(y_i\in }\) (regression) if the individual was in the survey (\(i\in }\)) and \(y_i=\text \) otherwise (\(i\notin }\)).
The goal of supervised learning is to learn an unknown function \(f:}^d \rightarrow \\) or \(f:}^d \rightarrow }\) from a set of training examples \(}=\_}}\) each consisting of an input vector \(x_i\in }^d\) and an associated output which may be binary \(y_i\in \\) or real-valued \(y_i\in }\). This function should approximate the unknown true function \(y_i\approx f(x_i)\) on the training data \(i\in }\) with the aim of generalizing to new data \(i\notin }\) which is not seen in the training phase. When predicting the prevalence or average rating for policy makers, we would use the observed responses when available in the survey and the model predictions for every individual not in the survey. We therefore define the predicted response \(y^*_i\) as:
$$\begin y^*_i := y_i & i\in } \\ f(x_i) & i\notin } \end\right. } \end$$
Given a partition of individuals into \(r=1,\ldots ,K\) mutually exclusive geographic regions \(}_r\), where \(}_1\cup \ldots \cup }_K = [N]\) and \(}_r\cap }_s=\emptyset \text r\ne s\), we calculate the predicted prevalence or average rating in each region as simply the average:
$$\begin p_r = \frac}_r\Vert }\sum _}_r} y^*_i \end$$
Model agnostic prediction intervals can be determined as follows. The goal is to calculate \(b=1,\ldots ,B\) bootstrapped statistics \(p^_r\) for the true mean in each region, and take their 95% percentile intervals as prediction intervals. To quantify model uncertainty, we bootstrap resample the training data as data sets \(\}^\}_^\) and denote a model trained in each as \(f^\). The outcome uncertainty in classification is a Bernoulli trial \(y_i \sim \text (p_i)\) from true probability \(p_i\) and we assume the outcome in regression follows a normal distribution \(y_i \sim }(\mu _i,\sigma _i^2)\) given true mean \(\mu _i\) and variance \(\sigma _i^2\). The outcomes are independent given their true means. We estimate the mean with the bootstrapped model prediction and a constant variance \(\sigma ^2 = \frac}|}\sum _}}(y_i - }(x_i))^2\) where \(}(x_i)=\frac\sum _^ f^(x_i)\). For every bootstrap sample \(b=1,\ldots ,B\), we train model \(f^\) and sample the outcomes. For unknown outcomes (\(i\notin }\)) we simulate \(y^_i \sim \text (f^(x_i))\) in classification and \(y^_i \sim }(f^(x_i),\sigma ^2)\) in regression. The known outcomes (\(i\in }\)) are taken as observed \(y^_i := y_i\), which corresponds to a finite sample correction. The bootstrapped mean is then calculated as \(p^_r= \frac}_r\Vert }\sum _}_r} y^_i\). Their 95% percentile intervals are the prediction intervals.
Null model
The first model is the null model. This model simply predicts the mean in the Netherlands: either prevalence or the average rating. Each individual and therefore each geographical region gets the same outcome:
$$\begin f(x_i) = \frac}\Vert }\sum _}} y_j \end$$
Structured additive regression model (STAR)
The second model under consideration is a statistical model specifically designed for small area estimation in the Netherlands. This model is a structured additive regression model (STAR) and provides an elaborate framework for modelling nonlinear effects using penalized B-splines and spatial information using Markov random fields. The generalized linear model and the generalized additive model can be considered as a special case of the STAR model [5].
In this paper we use an updated version of the STAR model that was presented by [4]. The current STAR model used by the RIVM has several improvements. First, the updated model includes educational level. Second, more two-way interactions are included: age by sex, age by ethnicity, age by marital status, age by educational level, sex by ethnicity, sex by marital status and sex by educational level. Third, all features enter the model using basis functions (B-splines for continuous features, dummies for categorical features) and penalization of the regression coefficients. This also enables automated feature selection, i.e., features that are not relevant will not be selected in the model, resulting in a more parsimonious model [13]. The original STAR model was used to make the HeMo 2012 predictions, but the updated model was used for the HeMo 2016 predictions. It will also be used as a reference for the HeMo 2020 predictions.
Estimation of (hyper)parameters is carried out with restricted maximum likelihood (REML) using the bam function in the mgcv R package [14, 15]. Because of the size of the data set and the complexity of the model, it is impossible to fit this model to the entire data sets. The data sets is therefore split by MHS regions and a separate model was fit to each split, as in the original paper [4]. To avoid boundary effects, the model for each MHS region also includes all data within a 10 km buffer around the considered MHS region. These models have identical specification but the estimated coefficients and smoothing penalty may differ between regions.
Missing feature values are not allowed in the STAR model. We therefore used the random forest algorithm to sequentially impute the missing values from the least missing feature to the most missing feature.
Gradient boosting (XGBoost)
The third model is a gradient boosting with decision trees. This is a general machine learning technique for classification, regression, etc. It has been shown across many data sets that sophisticated machine learning models (random forest, kernel methods, neural networks, boosting with decision trees) tend to have good classification accuracy in tabular data sets such as our problem [16]. We chose gradient boosting with decision trees because previous studies that have compared machine learning methods in SAE have found them to work slightly better [8, 9] and they are computationally much faster in our large data sets.
Boosting creates a strong prediction model iteratively as an ensemble of weak prediction models, where at each iteration a new weak prediction model is added to compensate the errors made by the existing weak prediction models. Gradient boosting generalizes other boosting methods by allowing the optimization of arbitrary differentiable loss functions. Typically decision trees are used as the model, which is called gradient boosted trees. A decision tree model called Classification And Regression Trees (CART) can be used for both classification and regression. Given an arbitrary loss function \(L(y_i, f(x_i))\), the gradient boosted trees can be described in a general form as [13, 17]:
1
Start with a constant function: \(f_0(x) = \text _\sum _^L(y_i,\gamma _0)\)
2
For each iteration \(t = 1,\ldots ,T\) construct a new tree:
(a)
For example \(i = 1,\ldots ,n\), compute the negative gradient
$$\begin r_ = - \left[ \frac\right] _} \end$$
(b)
Fit a classification and regression tree to the targets \(r_\) giving terminal nodes \(j=1,\ldots ,J_t\) with corresponding terminal regions \(R_\), i.e. the set of examples in terminal node j at iteration t.
(c)
For \(j=1,\ldots ,J_t\) compute the terminal node estimates
$$\begin \gamma _ = \text _ \sum _} L(y_i, f_(x_i) + \gamma ) \end$$
(d)
Using learning rate \(\alpha \) update a new function \(f_(x)\) as
$$\begin f_(x) = f_(x) + \alpha \sum _^\gamma _}(x \in R_) \end$$
The gradient boosting algorithm above has two main hyperparameters: the number of iterations i.e., the number of trees constructed T, and the learning rate \(\alpha \). We use the R package XGBoost implementation of gradient boosting [18]. The extreme gradient boosting (XGBoost) model [11] has been successfully used in many competitions and we selected it as a state-of-the-art method. We denote the default hyperparameter values as “XGBoost0”, and the optimized model as “XGBoost”. We found that the default hyperparameter values \(\alpha =0.3, T=50\) work well. However, a lower learning rate \(\alpha \) always resulted in a more accurate model. The optimal number of iterations T depends on both the predicted outcome and the learning rate. In the optimized model, we therefore set a reasonably low value to the learning rate \(\alpha = 0.1\) and limited the number of iterations by early stopping based on five-fold cross-validation on training data. XGBoost is able to handle missing feature values directly by considering these as a tree splitting criterion, just like ordinary values, so there was no need to impute missing feature values first. We found that missing values gave slightly better predictions with XGBoost.
Attention should be paid to the spatial location feature here, because location may provide information that cannot be accounted for by the demographic, household or neighborhood features only. While in the STAR model location is implicitly included in the model as a spatially correlated random effect using a Markov random field term, for a tree-based model this information could be provided by simple x and y coordinates. However, this may result in orthogonal artifacts in the maps [19]. We therefore used oblique geographic coordinates (OGC) as an alternative. These are K additional features added to the data by a feature transformation of \(x_i\) and \(y_i\) coordinate features, calculated by:
$$\begin x^_i = \sqrt \, \text \left[ \theta _k - \text \left( \frac \right) \right] , \end$$
where the angle \(\theta _k\) takes the values \(\pi (k - 1)/K, k = 1, \dots , K\), in which K is a reasonably large number, chosen such that model accuracy does not improves any further. We found \(K = 24\) to be a good trade-off. We added an extension “_ogc” to denote a model with this location information and “_xy” as the model with ordinary x &y-coordinates.
Validation
To evaluate model performance, we use the data set \(}=\_}}\) of survey respondents with known binary health-related indicators or living quality ratings. We split this data set into five mutually exclusive training and test set pairs with five-fold cross-validation, i.e., \(}_}\cup }_}=}\) and \(}_}\cap }_}=\emptyset \). For each pair, a model f is fitted to the training set \(}_}\) with observed responses and the unknown responses are predicted in the test set \(}_}\). Taking together the predictions in the five mutually exclusive tests sets, we therefore have out-of-sample predictions for the original data set \(}\).
To validate the models, two aspects are particularly important: discrimination and calibration. Discrimination only applies to classification, while calibration applies to both classification and regression. Discrimination measures to what extent the model is able to discriminate a high risk individual from a low risk individual, without necessarily considering the absolute values of the predictions. Calibration on the other hand quantifies how close the predicted probabilities or ratings are to the observed probabilities or ratings. In our classification task we aim to predict the individual probabilities as accurately as possible, so we need models that are also well calibrated.
The Receiver Operating Characteristic (ROC) is a popular discrimination visualization. The area under the ROC curve (AUC) only measures discrimination because it is calculated from the number of correct rankings of positive examples over negative ones [20]. Accuracy also considers discrimination because it is the proportion of correctly classified individuals for a given threshold value. In the case of binary responses, a calibration curve compares the predicted probability quantiles and the true probability of 1 in each quantile.
Statistics that measure both discrimination and calibration are the mean squared error (MSE) and negative log-likelihood (NLL), which we normalized by dividing by the sample size. We verified that different metrics gave consistent results across the models. We primarily report the model accuracy as the MSE, which is also a valid metric in binary classification known as the Brier score [21]:
$$\begin \text (}_}) = \frac}_}|} \sum _}_}}(y_i - f(x_i))^2 \end$$


留言 (0)