Figure S1. 1H NMR spectra (CDCl3, 400.1 MHz, 22 °C) of compound 1.
Figure S2. 13C NMR spectra (CDCl3, 100.6 MHz, 22 °C) of compound 1.
Figure S3. 1H NMR spectra (CDCl3, 400.1 MHz, 20 °C) of compound 2.
Figure S4. 13C NMR spectra (CDCl3, 100.6 MHz, 20 °C) of compound 2.
Figure S5. 1H NMR spectra (CDCl3, 600.1 MHz, 20 °C) of compound 2a.
Figure S6. 13C NMR spectra (CDCl3, 150.9 MHz, 20 °C) of compound 2a.
Figure S7. 1H NMR spectra (CDCl3, 600.1 MHz, 23 °C) of compound 3.
Figure S8. 13C NMR spectra (CDCl3, 150.9 MHz, 23 °C) of compound 3.
Figure S9. 1H NMR spectra (CDCl3, 400.1 MHz, 21 °C) of compound 4.
Figure S10. 13C NMR spectra (CDCl3, 100.6 MHz, 21 °C) of compound 4.
Figure S11. 1H NMR spectra (CDCl3, 400.1 MHz, 20 °C) of compound 5.
Figure S12. 13C NMR spectra (CDCl3, 100.6 MHz, 20 °C) of compound 5.
Figure S13. 1H NMR spectra (CDCl3, 400.1 MHz, 20 °C) of compound 6.
Figure S14. 13C NMR spectra (CDCl3, 100.6 MHz, 20 °C) of compound 6.
Figure S15. 1H NMR spectra (CDCl3, 400.1 MHz, 20 °C) of compound 7.
Figure S16. 13C NMR spectra (CDCl3, 100.6 MHz, 20 °C) of compound 7.
Figure S17. 1H NMR spectra (CDCl3, 400.1 MHz, 20 °C) of compound 8.
Figure S18. 13C NMR spectra (CDCl3, 100.6 MHz, 20 °C) of compound 8.
Figure S19. 119Sn NMR spectra (CDCl3, 149.2 MHz, 20 °C) of compounds 1–8.
Figure S20. Molecular structure of SC(7)-RC(16)-1 isomer (left) and RC(7)-SC(16)-1 isomer (right) in the crystal of 1 (only methyne hydrogens are shown).
Figure S21. Molecular structure of SC(7)-SC(17)-2 isomer (left) and RC(7)-RC(17)-2 isomer (right) in the crystal of 2.
Figure S22. Molecular structure of pSO(1)-RC(7)-2a isomer (left) and pRO(1)-SC(7)-2a isomer (right) in the crystal of 2a.
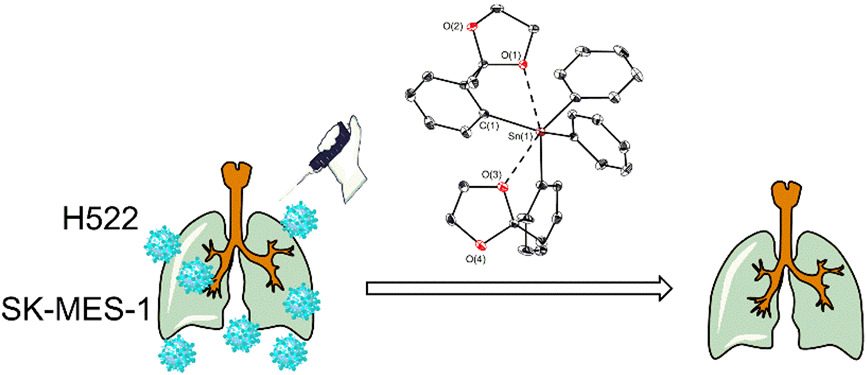
Figure S23. Cytotoxic effects of compound 3 on BEAS-2B, H522, and SK-MES-1 cell lines.
Figure S24. Cytotoxic effects of compound 4 on BEAS-2B, H522, and SK-MES-1 cell lines.
Figure S25. Cytotoxic effects of compound 5 on BEAS-2B, H522, and SK-MES-1 cell lines.
Figure S26. Cytotoxic effects of compound 6 on BEAS-2B, H522, and SK-MES-1 cell lines.
Figure S27. Cytotoxic effects of compound 7 on BEAS-2B, H522, and SK-MES-1 cell lines.
Figure S28. Cytotoxic effects of compound 8 on BEAS-2B, H522, and SK-MES-1 cell lines.
Figure S29. Image analysis of apoptotic cells from SK-MES-1 cell line with and without treatment. (A) Evaluation of alteration of the mitochondrial properties by TMRE staining along with Hoechst staining for nuclei using fluorescence microscopy (4X magnification). Alteration of mitochondrial activity on SK-MES-1 cells. (B) Semiquantitative evaluation of the % of viable cells on SK-MES-1 cells, characterized by positive staining for mitochondrial activity.
Figure S30. Image analysis of apoptotic cells from BEAS-2B cell line with and without treatment. (A) Evaluation of alteration of the mitochondrial properties by TMRE staining along with Hoechst staining for nuclei using fluorescence microscopy (4X magnification). Alteration of mitochondrial activity on BEAS-2B cells. (B) Semiquantitative evaluation of the % of viable cells onBEAS-2B cells, characterized by positive staining for mitochondrial activity.
Figure S31. Image analysis of autophagic cells from H522 cell line with and without treatment. (A) Evaluation of autophagy by monodansylcadaverine (MDC) and PI staining on H522 cells using fluorescence microscopy (4X magnification). (B) Semiquantitative evaluation of the autophagic H522 cells exposed to different compounds.
Figure S32. Image analysis of autophagic cells from BEAS-2B cell line with and without treatment. (A) Evaluation of autophagy by monodansylcadaverine (MDC) and PI staining on BEAS-2B cells using fluorescence microscopy (4X magnification). (B) Semiquantitative evaluation of the autophagic BEAS-2B cells exposed to different compounds.
Table S1. X-ray crystal data and structure refinement for compounds 1, 2, 2a and 3.
Table S2. X-ray crystal data and structure refinement for compounds 4–7.
Table S3. X-ray crystal data and structure refinement for compound 8.

留言 (0)