
記住我


Non-alcoholic fatty liver disease (NAFLD) is a prevalent chronic liver disease and is closely related to obesity and lifestyle-related diseases1. The frequency of NAFLD in adults who received health examinations has been reported to be 9–30% in Japan, and has been increasing in recent years2. NAFLD is a multisystem disease affecting extrahepatic organs and regulatory pathways in association with increased risks of insulin resistance, type 2 diabetes mellitus, hypertension, cardiovascular disease and chronic kidney disease, as well as the development of liver cirrhosis and liver cancer3. It is noteworthy that a new concept of metabolic dysfunction-associated fatty liver disease has been proposed regardless of alcohol consumption4.
MAFLD is defined as criteria based on evidence of hepatosteatosis in addition to one of the following three criteria: overweight/obesity, presence of type 2 diabetes mellitus and evidence of metabolic dysregulation4. In epidemiological studies, several non-invasive biochemical indicators other than abdominal ultrasonography and liver biopsy are used for the diagnosis of NAFLD/MAFLD. Among the biomarkers, fatty liver index (FLI)5, which is calculated by using waist circumference (WC), body mass index (BMI), and levels of triglycerides and γ-glutamyl transferase (GGT), has been recommended as a biomarker for detection of fatty liver in MAFLD4. FLI was originally reported in Italy as an index for the prediction of fatty liver detected by abdominal ultrasonography, and the cut-off value was reported to be FLI ≥605. The ability of FLI to predict fatty liver has been verified, and its usefulness has been reported in several countries5, 6. However, sex and racial differences in FLI level were not taken into consideration in most of the studies. We recently showed that simple and useful cut-off values for prediction of NAFLD in Japanese men and women were FLI ≥35 and FLI ≥16, respectively6.
It has been shown that several humoral factors, including adipokines and hepatokines, are associated with metabolic syndrome and its related pathological conditions7. Fatty acid-binding protein 4 (FABP4), also known as adipocyte FABP, is expressed in adipocytes, macrophages and capillary and injured endothelial cells, and is related to the development of insulin resistance and atherosclerosis8-10. FABP4 is secreted from adipocytes through a non-classical pathway in relation to lipolysis11, 12, although there are no typical secretory signal peptides in the sequence of FABP49, 10. Circulating FABP4 has been reported to act as an adipokine for the development of insulin resistance12, atherosclerosis13 and vascular remodeling14 in experimental models, although potential FABP4 receptors have still not been identified10. Furthermore, it has been reported that the use of FABP4 neutralizing antibodies and/or small molecule-specific FABP4 inhibitors can be novel therapeutic strategies for treatment of metabolic dysfunction and vascular injury12, 14-16.
Cross-sectional studies have shown that that an elevated circulating FABP4 level is associated with insulin resistance estimated by the hyperinsulinemic glucose clamp method17-19, as well as obesity, hypertension, type 2 diabetes mellitus, dyslipidemia, dysregulation of purine metabolism, atherosclerosis, and disturbance of the liver, heart and kidney20-25. It has also been shown that FABP4 level is a predictor for the development of metabolic syndrome26, type 2 diabetes mellitus27, atherosclerosis28 and cardiovascular events29.
However, the relationships of MAFLD with humoral factors including adipokines and hepatokines have not been fully addressed. We investigated associations of MAFLD determined by FLI for hepatosteatosis with metabolic markers, including FABP4; adiponectin, an adipokine; and fibroblast growth factor 21 (FGF21), a hepatokine, in a Japanese general population.
METHODS Study participantsIn a population-based cohort, the Tanno-Sobetsu Study, a total of 627 Japanese individuals (men/women 292/335) were recruited from residents of Sobetsu Town in 2016. This study was approved by the Ethical Committee of Sapporo Medical University and was carried out in accordance with the Declaration of Helsinki. Written informed consent was obtained from all of the study participants.
MeasurementsMedical checkups, including measurement of blood pressure, calculation of BMI and collection of blood samples after an overnight fast were carried out as previously described22. Concentrations of FABP4, adiponectin and FGF21 were measured using enzyme-linked immunosorbent assay kits for FABP4 (BioVendor, Brno, Czech Republic), adiponectin (R&D Systems, Minneapolis, MN, USA) and FGF21 (R&D Systems), respectively. Estimated glomerular filtration rate was calculated by an equation for Japanese individuals: estimated glomerular filtration rate (mL/min/1.73 m2) = 194 × creatinine (−1.094) × age (−0.287) × 0.739 (if female)30. Homeostasis model assessment of insulin resistance (HOMA-R) was calculated by the formula: insulin (μU/mL) × glucose (mg/dL) / 405. FLI was calculated by using WC, BMI, and levels of triglycerides and GGT5: FLI = [e(0.953 × ln (triglycerides) + 0.139 × BMI + 0.718 × ln (GGT) + 0.053 × WC – 15.745)] / [1 + e (0.953 × ln (triglycerides) + 0.139 × BMI + 0.718 × ln (GGT) + 0.053 × WC – 15.745)] × 100.
A self-administered questionnaire survey was carried out to obtain information on current smoking habit, alcohol drinking habit (≥3 times/week), and use of drugs for diabetes mellitus, hypertension and dyslipidemia. Hypertension was defined as self-reported use of drugs for hypertension, systolic blood pressure ≥140 mmHg or diastolic blood pressure ≥90 mmHg. Diabetes mellitus was defined as self-reported use of drugs for diabetes mellitus, hemoglobin A1c (NGSP scale) ≥6.5% or fasting plasma glucose ≥7.0 mmol/L. Dyslipidemia was defined as self-reported use of drugs for dyslipidemia, triglycerides ≥ 1.7 mmol/L, high-density lipoprotein (HDL) cholesterol <1.0 mmol/L or low-density lipoprotein cholesterol ≥3.6 mmol/L.
Definition of MAFLDMAFLD was defined by criteria based on evidence of hepatosteatosis with one of the following three criteria: type 2 diabetes mellitus, overweight/obesity (BMI ≥23 in Asian individuals) and evidence of metabolic dysregulation as previously reported4. Evidence of metabolic dysregulation was defined as the presence of at least two metabolic risk abnormalities, including waist circumference ≥90/80 cm in Asian men and women; blood pressure ≥130/85 mmHg or specific drug treatment; plasma triglycerides ≥1.7 mmol/L or specific drug treatment; plasma HDL cholesterol <1.0 mmol/L for men and <1.3 mmol/L for women or specific drug treatment; prediabetes (fasting glucose levels of 5.6–6.9 mmol/L, 2-h post-load glucose levels of 7.8–11.0 mmol/L or hemoglobin A1c of 5.7–6.4%); HOMA-R ≥ 2.5; and plasma high-sensitivity C-reactive protein level >2 mg/L (no measurement in the present study)4. Detection of hepatic steatosis has been recommended to be carried out either by blood biomarkers/scores, imaging techniques or liver histology4. In the present study, hepatic steatosis was determined by FLI as a recommended biomarker4, and FLI ≥35 for men (area under the curve 0.82; sensitivity 76.7%; specificity 71.3%) and FLI ≥16 for women (area under the curve 0.91; sensitivity 85.2%; specificity 81.4%) were used for detection of fatty liver as previously reported using 14,471 Japanese individuals (men/women 9,240/5,231; mean age 48 ± 9 years)6.
Statistical analysisAfter checking normality of parameters by the Shapiro-Wilk W-test, variables are expressed as the mean ± standard deviation for normal distributions, or medians (interquartile ranges) for skewed variables. Differences in percentages of variables were analyzed by the χ2-test. Comparisons between two groups were carried out by Student's t-test for parametric parameters, and the Mann–Whitney U-test for non-parametric parameters. For regression analyses, skewed variables were logarithmically transformed, and the correlation between two variables was carried out by Pearson's correlation analysis. Multivariable regression analyses were carried out to identify independent associations of FLI with FABP4, adiponectin and FGF21 after adjustment of age, sex, systolic blood pressure, and levels of HOMA-R, uric acid, HDL cholesterol, FABP4, adiponectin and FGF21 by several models, showing the standardized regression coefficient (β) and the percentage of variance for the selected independent predictors explained (R2). Multivariable logistic regression analyses were carried out in several models to identify independent determinants of the risk for MAFLD using age, sex and variables with a significant difference between subgroups divided by the absence and presence of MAFLD as independent predictors after consideration of multicollinearity, showing the odds ratio (OR), 95% confidence interval (CI) and Akaike's information criterion (AIC). Since hepatosteatosis in MAFLD was defined by FLI, which was calculated by using indicators of obesity, BMI and WC were not incorporated into multivariable logistic regression analyses. Parameters with a lower AIC score constitute a better-fit model. A P < 0.05 was considered statistically significant. Statistical analyses were carried out using JMP15.2.1 for Macintosh (SAS Institute, Cary, NC, USA).
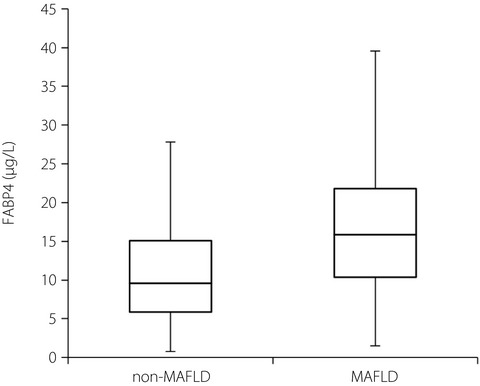
RESULTS Basal characteristics of the studied participantsBasal characteristics of the 627 recruited participants (men/women 292/335) are shown in Table 1. The mean age of the participants was 65 years (range 19–98 years, median 68 years interquartile range 56–76 years). The numbers of participants with habits of current smoking and alcohol drinking were 105 (16.7%) and 261 (41.6%), respectively. Hypertension, diabetes mellitus, dyslipidemia and MAFLD were found in 358, 69, 336 and 268 participants, respectively.
Table 1. Characteristics of the studied participants All Men Women P (n = 627) (n = 292) (n = 335) Age (years) 65 ± 15 64 ± 16 65 ± 15 0.460 Body mass index 23.5 ± 3.8 24.0 ± 3.6 23.0 ± 3.8 0.001 Waist circumference (cm) 85.6 ± 10.9 86.9 ± 10.5 84.5 ± 11.2 0.006 Systolic blood pressure (mmHg) 135 ± 22 136 ± 19 134 ± 23 0.316 Diastolic blood pressure (mmHg) 76 ± 11 77 ± 11 75 ± 12 0.044 Current smoking habit 105 (16.7) 70 (24.0) 35 (10.4) <0.001 Alcohol drinking habit 261 (41.6) 172 (58.9) 89 (26.6) <0.001 Comorbidity Hypertension 358 (57.1) 171 (58.6) 187 (55.8) 0.489 Diabetes mellitus 69 (11.0) 42 (14.4) 27 (8.1) 0.012 Dyslipidemia 336 (53.6) 149 (51.0) 187 (55.8) 0.230 MAFLD 268 (42.7) 116 (39.7) 152 (45.4) 0.154 Biochemical data AST (IU/L) 22 (20–27) 24 (20–29) 22 (19–26) <0.001 ALT (IU/L) 18 (14–24) 21 (16–28) 16 (13–21) <0.001 GGT (IU/L) 22 (16–33) 28 (20–41) 18 (14–25) <0.001 FLI 21.2 (8.8–41.5) 27.4 (12.1–49.1) 14.4 (7.2–33.2) <0.001 Blood urea nitrogen (mmol/L) 5.7 ± 1.7 6.0 ± 1.9 5.5 ± 1.5 <0.001 Creatinine (µmol/L) 72 ± 19 81 ± 20 63 ± 13 <0.001 eGFR (mL/min/1.73 m2) 67.1 ± 15.0 68.7 ± 15.9 65.7 ± 14.1 0.011 Uric acid (µmol/L) 320 ± 78 359 ± 73 286 ± 66 <0.001 Total cholesterol (mmol/L) 5.4 ± 0.9 5.2 ± 0.9 5.6 ± 0.9 <0.001 LDL cholesterol (mmol/L) 3.1 ± 0.8 3.0 ± 0.8 3.3 ± 0.8 <0.001 HDL cholesterol (mmol/L) 1.6 ± 0.4 1.5 ± 0.4 1.7 ± 0.4 <0.001 Triglycerides (mmol/L) 1.0 (0.7–1.5) 1.1 (0.8–1.6) 1.0 (0.7–1.3) 0.003 Fasting glucose (mmol/L) 5.2 (4.8–5.7) 5.3 (4.9–6.0) 5.1 (4.7–5.5) <0.001 Hemoglobin A1c (%) 5.5 (5.2–5.8) 5.5 (5.2–5.9) 5.5 (5.2–5.7) 0.138 Insulin (pmol/L) 59 (31–119) 65 (30–126) 58 (31–112) 0.320 HOMA-R 1.96 (0.93–4.03) 2.17 (0.96–4.39) 1.82 (0.92–3.61) 0.113 FABP4 (µg/L) 11.7 (7.3–17.9) 10.5 (6.1–16.4) 13.0 (8.3–19.4) <0.001 Adiponectin (mg/L) 7.3 (4.8–10.9) 5.6 (4.0–9.4) 8.9 (6.0–12.2) <0.001 FGF21 (ng/L) 105 (69–158) 118 (80–170) 97 (62–151) 0.001 Variables are expressed as number (%), mean ± standard deviations or median (interquartile range). AST, aspartate transaminase; ALT, alanine transaminase; eGFR, estimated glomerular filtration rate; FABP4, fatty acid-binding protein 4; FGF21, fibroblast growth factor 21; FLI, fatty liver index; GGT, γ-glutamyl transpeptidase; HDL, high-density lipoprotein; HOMA-R, homeostasis model assessment of insulin resistance; LDL, low-density lipoprotein; MAFLD, metabolic dysfunction-associated fatty liver disease. Correlation analyses for FLI, FABP4, adiponectin and FGF21As shown in Table 2, FLI was positively correlated with BMI, WC, systolic and diastolic blood pressures, aspartate transaminase, alanine transaminase, GGT, creatinine, uric acid, triglycerides, fasting glucose, hemoglobin A1c, insulin, HOMA-R and FABP4 (Figure 1a), and was negatively correlated with HDL cholesterol and adiponectin as an adipokine (Figure 1b). There was a positive correlation of FLI with a hepatokine, FGF21 (Figure 1c). When men and women were separately analyzed, similar correlations of FLI with FABP4 (Figure 1a), adiponectin (Figure 1b) and FGF21 (Figure 1c) were found. Correlations of FABP4, adiponectin and FGF21 with parameters are also shown in Table 2.
Table 2. Correlation analyses for FLI, FABP4, adiponectin and FGF21 Log FLI Log FABP4 Log Adiponectin Log FGF21 r P r P r P r P Age 0.078 0.051 0.227 <0.001 0.234 <0.001 0.175 <0.001 Body mass index 0.803 <0.001 0.384 <0.001 −0.232 <0.001 0.088 0.028 Waist circumference 0.827 <0.001 0.339 <0.001 −0.234 <0.001 0.117 0.004 Systolic blood pressure 0.255 <0.001 0.226 <0.001 0.101 0.011 0.156 <0.001 Diastolic blood pressure 0.271 <0.001 0.079 0.049 −0.053 0.187 0.116 0.004 Biochemical data Log AST 0.251 <0.001 0.161 <0.001 0.002 0.968 0.155 <0.001 Log ALT 0.448 <0.001 0.100 0.012 −0.203 <0.001 0.070 0.079 Log GGT 0.502 <0.001 0.003 0.944 −0.206 <0.001 0.328 <0.001 Log FLI – – 0.331 <0.001 −0.312 <0.001 0.268 <0.001 Blood urea nitrogen 0.043 0.288 0.180 <0.001 0.063 0.117 0.022 0.580 Creatinine 0.136 0.001 0.151 <0.001 −0.012 0.762 0.211 <0.001 eGFR −0.042 0.292 −0.289 <0.001 −0.208 <0.001 −0.144 <0.001 Uric acid 0.342 <0.001 0.137 0.001 −0.231 <0.001 0.228 <0.001 Total cholesterol 0.002 0.966 0.025 0.538 0.108 0.007 −0.070 0.081 LDL cholesterol 0.046 0.255 0.067 0.095 0.028 0.484 −0.105 0.009 HDL cholesterol −0.463 <0.001 −0.198 <0.001 0.337 <0.001 −0.119 0.003 Log Triglycerides 0.627 <0.001 0.198 <0.001 −0.225 <0.001 0.281 <0.001 Log Fasting glucose 0.305 <0.001 0.173 <0.001 −0.124 0.002 0.069 0.086 Log Hemoglobin A1c 0.233 <0.001 0.189 <0.001 −0.089 0.026 0.017 0.674 Log Insulin 0.177 <0.001 0.148 <0.001 −0.104 0.011 0.066 0.109 Log HOMA-R 0.220 <0.001 0.170 <0.001 −0.120 0.003 0.076 0.063 Log FABP4 0.331 <0.001 – – −0.046 0.247 0.224 <0.001 Log Adiponectin −0.312 <0.001 −0.046 0.247 – – −0.079 0.048 Log FGF21 0.268 <0.001 0.224 <0.001 −0.079 0.048 – – Total n = 627. AST, aspartate transaminase; ALT, alanine transaminase; eGFR, estimated glomerular filtration rate; FABP4, fatty acid-binding protein 4; FGF21, fibroblast growth factor 21; FLI, fatty liver index; GGT, γ-glutamyl transpeptidase; HDL, high-density lipoprotein; HOMA-R, homeostasis model assessment of insulin resistance; LDL, low-density lipoprotein.
Correlations of fatty liver index (FLI) with metabolic parameters. (a). Logarithmically transformed (Log) fatty acid-binding protein 4 (FABP4), (b) Log adiponectin and (c) Log fibroblast growth factor 21 (FGF21) were plotted against Log FLI in each participant (n = 627). Open circles and broken regression line: men (n = 292), closed circles and solid regression line: women (n = 335).
Multivariable regression analyses for FLIMultivariable regression analyses showed that the level of FABP4, adiponectin or FGF21 was independently associated with FLI after adjustment of age and sex (model 1; Table 3). When HOMA-R was additionally incorporated, the level of FABP4, adiponectin or FGF21 was an independent determinant of FLI (model 2). When uric acid and HDL cholesterol (model 3) or uric acid, HDL cholesterol and systolic blood pressure (model 4) were incorporated into the adjustment in model 2, the level of FABP4, adiponectin or FGF21 was an independent determinant of FLI. With further additional adjustment of FABP4, adiponectin and FGF21 into model 4, levels of FABP4 (β = 0.189, P < 0.001, R
留言 (0)