
記住我


Attention-deficit/hyperactivity disorder (ADHD) is a highly prevalent childhood-onset neuropsychiatric disorder that persists into adulthood in up to half of diagnosed cases.1 ADHD often co-occurs with other psychiatric disorders that complicate its clinical presentation and interfere with ADHD treatment effectiveness.2 One of the most frequently co-occurring psychiatric disorders in adolescents and adults with ADHD is substance use disorder (SUD).3 An epidemiologic study showed comorbid SUD in about 35% of adults with ADHD, compared with 3.6% in those without ADHD.4 Similarly, 23% of SUD patients were found to meet the diagnostic criteria for comorbid ADHD.5 Patients with both ADHD and SUD often start substance use at an earlier age, transit faster from recreational use to dependence and respond more poorly to treatment, compared with SUD-only patients.3 This implicates increased personal and societal burden2 and indicates a need to better understand mechanisms underlying the severe clinical presentation of ADHD–SUD patients.
Impaired inhibitory control (i.e., the ability to suppress prepotent, ongoing or impulsive responses) is part of the pathophysiology of ADHD.6 Indeed, many studies examining inhibitory control in ADHD reported worse performance for patients compared with controls.7-11 Impairments in inhibitory control also appear to be a premorbid vulnerability factor for SUD that further deteriorate with substance use. For instance, greater behavioural disinhibition in childhood is an SUD risk factor in offspring of patients with SUD that predicts or mediates later SUD development.17, 18 In addition, animal studies show deterioration in inhibitory control as a result of long-term substance administration.19, 20 These combined mechanisms might thus play a key role in the severe clinical presentation of ADHD–SUD patients.
On a neurobiological level, inhibitory control deficits in patients with ADHD have been associated with hypoactivation in various nodes of frontoparietal and frontostriatal networks (inferior frontal cortex [IFC], insula, supplementary motor area [SMA], anterior cingulate cortex [ACC], thalamus [Th] and caudate nucleus) during both successful and unsuccessful inhibition trials.6, 11, 16 Similarly, studies in patients with SUD showed impairments in inhibitory control, attention redirection and learning during inhibitory control tasks associated with hypoactivation in the salience network (anterior insular, dorsal ACC [dACC] and inferior parietal lobe [IPL]), executive network (ventrolateral prefrontal cortex [vlPFC] and dorsolateral prefrontal cortex [dlPFC]) and memory network (hippocampus and parahippocampus) during successful inhibition trials.17 It must be noted that findings from SUD studies might reflect both pre-existing impairments associated with SUD vulnerability (i.e., trait effects) and impairments resulting from substance use (i.e., state effects). It is thus important to use designs that disentangle substance use trait and state effects on inhibitory control.
Despite overlapping inhibitory control deficits in ADHD and SUD and its potential clinical significance, effects of substance use on inhibitory control in ADHD patients have hardly been investigated. A previous study focused on cannabis effects in participants with and without ADHD and found poor performance during go-trials and hypoactivation in the frontostriatal and frontoparietal networks during successful inhibition trials for ADHD patients regardless of cannabis use.18 In spite of no main effect of cannabis, non-ADHD cannabis users activated hippocampus and cerebellum more than ADHD cannabis users and non-ADHD noncannabis users.22 Two other publications examined behavioural performance during inhibition tasks. Crunelle et al. reported poor performance during inhibition trials for ADHD patients with versus without cocaine dependence and controls.19 Stevens et al. also found worse performance for ADHD patients with cocaine dependence compared with controls during an inhibition task. Yet, this study did not include ADHD patients without cocaine dependence.20
There is limited knowledge on potentially additive or distinct SUD effects on inhibitory control deficits in ADHD patients. The aim of our study is to examine these effects in adolescents and young adults with ADHD. Because a subset of adolescents with clinically relevant substance use problems is thought to remain undetected with the SUD criteria,21 we assessed substance misuse (SM) as a broader SUD phenotype. For this, we compared behavioural and functional magnetic resonance imaging (MRI) data of an inhibitory control task across ADHD adolescents and young adults with and without SM and healthy controls. In line with ADHD studies, we hypothesize poor performance and decreased activation in the frontostriatal circuit of the salience network and the frontoparietal central executive network for ADHD patients with and without SM, compared with controls. Considering similar ADHD and SUD effects, we hypothesize additive SM effects with worse performance and more pronounced hypoactivation in the same networks for ADHD patients with SM, compared with those without.
2 MATERIALS AND METHODS 2.1 ParticipantsThe sample was part of the NeuroIMAGE cohort,22 the Dutch follow-up of the International Multicenter ADHD Genetics (IMAGE) study. NeuroIMAGE cohort recruited ADHD and control families and investigated genetic, neural and cognitive correlates of ADHD. Data on substance use were collected during NeuroIMAGE and the intermediate follow-up. IMAGE participants had to be between 5 and 30 years old, of European Caucasian descent, to have IQ ≥ 70 and no diagnosis of autism spectrum disorder (ASD), epilepsy, general learning difficulties, brain or known genetic disorders.22 More detailed description of NeuroIMAGE can be found in theSupporting Information and/or the main design paper of the project.22
Additional exclusion criteria were applied here (Supporting Information), and groups were matched with important potential confounders. Our final sample included (1) an ADHD group without SM (ADHD-only, n = 33; 31 males - two females, mean age 18.18, SD 2.29, mean IQ 99.64, SD 16.39, seven with oppositional defiant disorder/conduct disorder (ODD/CD), 21 currently medicated), (2) an ADHD group with SM (ADHD + SM, n = 33; 31 males, two females, mean age 18.51, SD 2.41, mean IQ 91.52, SD 14.39, 11 with ODD/CD, 13 currently medicated) and (3) a control group (n = 33; 17 males - 16 females, mean age 17.38, SD 2.57, mean IQ 107.3, SD 14.29, without ODD/CD).
The ADHD + SM group included (i) 19 participants with only daily tobacco use, (ii) three with only daily drug use (two with cannabis, one with stimulants), (iii) nine with daily tobacco and daily/weekly drug use (six daily, three weekly; eight with cannabis, one with stimulants), (iv) one with daily tobacco and weekly alcohol use and (v) one with daily tobacco, weekly drug (cannabis) and weekly alcohol use within the past six months. Average age at first tobacco use for daily smokers was 13.05 (SD 2.26), at first drug use for daily/weekly users was 15.3 (SD 2.62) and at first alcohol use for weekly drinkers was 10 (SD 0). On the other hand, ADHD-only and control groups included (i) two participants with monthly drug use (one ADHD-only, one control), (ii) six with monthly tobacco use (four ADHD-only, two controls), (iii) one with weekly tobacco use (control) and (iv) 57 with less than monthly alcohol/drug/tobacco use.
Moreover, 21 ADHD-only patients and 13 ADHD + SM patients reported current use of stimulant medication. This included use of atomoxetine (n = 3 in ADHD-only, n = 1 in ADHD + SM), methylphenidate (n = 18 in ADHD-only, n = 12 in ADHD + SM) and dextroamphetamine (n = 0 in ADHD-only, n = 1 in ADHD + SM). Compatible with previous studies,23, 24 participants were asked to stop ADHD medication and alcohol or drug use 48 and 24 h prior testing, respectively, and were excluded from the study otherwise (n = 7). In line with the literature, cigarette smoking was not interrupted to avoid possible withdrawal effects on response inhibition.25 Other demographic characteristics can be found in Table 1.
TABLE 1. Sample characteristics ADHD-only (n = 33) ADHD + SM (n = 33) Control (n = 33) Group differences (p value)a Family history of SUD (FH−/FH+) 8/25 8/25 8/25 - Age (M ± SD) 18.18 ± 2.29 18.51 ± 2.41 17.38 ± 2.57 0.158 Sex (male/female) 31/2 31/2 17/16 <0.001b IQd (M ± SD) 99.64 ± 16.39 91.52 ± 14.39 107.3 ± 14.29 <0.001b Scan site (Nijmegen/Amsterdam) 20/13 18/15 22/11 0.602 DBD (yes/no) 7/26 11/22 NA 0.002b Depressive disorder (yes/no) NA 1/32 NA - Anxiety disorders (yes/no) NA 2/31 NA - Current ADHD medication (yes/no) 21/12 13/20 NA <0.001b Conners' Parents Rating Scale Inattention (M ± SD) 59.41 ± 10.25 66.84 ± 11.23 47.25 ± 5.39 <0.001c Hyperactivity–impulsivity (M ± SD) 64.21 ± 14.71 69.41 ± 13.05 46.91 ± 6.50 <0.001b Total (M ± SD) 62.58 ± 12.68 70.75 ± 12.45 46.69 ± 5.44 <0.001c Conners' Teacher Rating Scale/Adult ADHD Rating Scale Inattention (M ± SD) 64.21 ± 10.31 68.38 ± 10.97 47.10 ± 7.48 <0.001b Hyperactivity–impulsivity (M ± SD) 57.03 ± 13.37 60.41 ± 13.62 44.00 ± 8.96 <0.001b Total (M ± SD) 63.09 ± 12.24 67.59 ± 13.04 44.77 ± 7.71 <0.001b Note: Anxiety disorders = generalized anxiety disorder or social anxiety disorder or separation anxiety disorder or panic attack disorder. Abbreviations: ADHD, attention-deficit/hyperactivity disorder; ADHD-only, ADHD without substance misuse; ADHD + SM, ADHD with substance misuse; DBD, disruptive behavioural disorder (i.e., oppositional defiant disorder [ODD] or conduct disorder [CD]); FH, family history of SUD. 2.2 Instruments/measurements 2.2.1 Attention-deficit/hyperactivity disorderADHD diagnostic algorithm consisted of assessment with the Schedule for Affective Disorders and Schizophrenia for School-Age Children (K-SADS)26 and with Conners' ADHD questionnaires completed by parents, teachers or participants.27, 28 Detailed description of the diagnostic algorithm is included in the Supporting Information and in the main design paper of NeuroIMAGE.22
2.2.2 Substance useData from the Dutch version of the revised Self-Reported Delinquency Scale (SRD)29, 30 from NeuroIMAGE were used to assess substance use in participants. Daily alcohol or tobacco use or (at least) weekly drug use within the past six months was interpreted as indicative of SM in line with the Dutch Measurement of Addiction for Triage and Evaluation (MATE).31 Other data relevant for other aspects of substance use (disorder) were not available in the wave of NeuroIMAGE we used the response inhibition data from. Participants were excluded for missing data on substance use (n = 24).
The Alcohol Use Disorders Identification Test (AUDIT),32 the Drug Abuse Screening Test (DAST),33 the Fagerstrom Test for Nicotine Dependence (FTND)34 and the Timeline Follow Back (TLFB)35 from the intermediate follow-up were used to assess positive or negative family history of SUD (FH+/−). Cut-off points can be found in the Supporting Information. Participants were excluded for missing substance use data for at least one parent unless the data for the other parent were enough to indicate FH+.
To prevent interference with familial trait effects, the three groups were matched perfectly for FH of SUD, with ADHD + SM as the reference group. This resulted in the same number of FH−/+ participants in each group: 25 FH+ and eight FH−. The three groups were also matched optimally with age, and only the ADHD groups were matched perfectly with sex. Matching was performed with MatchIt in R (R version 3.6.2; Rstudio version 1.2.5033).36, 37
2.2.3 Stop-signal taskA standard stop-signal task was used to measure response inhibition11, 38 (Figure S1). During the task, participants were required to press the left or right button as fast as possible after presentation of the go-stimulus (i.e., white airplane; go-trials), unless that was followed by the stop-signal (i.e., white cross) indicating that participants were required to inhibit their response (i.e., stop-trials; 25% of trials). Task difficulty was adaptive to each participant's performance, with the time interval between the go-stimulus and the stop-signal adjusted by 50 ms after every successful or failed response. The task consisted of two practice blocks followed by four or three test blocks, each containing 60 trials. Here, 95 participants completed four blocks (33 ADHD-only, 31 ADHD + SM, 31 controls), and four participants completed three blocks (two ADHD + SM, two controls).
2.3 Analyses 2.3.1 Behavioural data analysisBehavioural variables were mean reaction times (MRTs), intra-individual coefficient of variation (ICV; standard deviation of reaction times divided by MRT) and percentage of omission and commission errors during go-trials and stop-signal reaction times (SSRTs; subtracting the delay between the go-stimulus and the stop-signal from the MRT) during stop-trials. Behavioural variables that were not normally distributed were transferred to normality with the log10 and the square root transformations. Group differences in SSRT, MRT, ICV and percentage of errors were examined with a one-way multivariate analysis of covariance (MANCOVA) followed by separate one-way analyses of covariance (ANCOVAs) with group as the independent variable (three levels: ADHD-only, ADHD + SM and controls) and FH, age, sex and scan site as covariates. Post hoc comparisons with Bonferroni–Holm correction for multiple comparisons followed significant group differences (i.e., p < 0.05). Behavioural data analysis was performed in R (R version 3.6.2; Rstudio version 1.2.5033).36
2.3.2 Functional MRI data analysisInformation on MRI data acquisition and preprocessing can be found in the Supporting Information. First-level activation maps were estimated with a general linear model (GLM) in FSL.39 Contrasts of interest included neural activation during (1) go-trials, (2) successful stop-trials minus go-trials and (3) failed stop-trials minus go-trials, with go-trials in the last two contrasts representing the baseline condition. Each participant's activation map for each contrast and block was normalized into MNI152 standard space. For each participant, activation maps from all blocks were then concatenated with a fixed-effects model per contrast in FSL. Group-level analysis for each contrast included a mixed-effects model with FSL flame.39 This included an F test for differences across the three groups (i.e., ADHD-only, ADHD + SM and controls) and mean-centred FH, age, sex and scan site as regressors of no interest. Z-statistical images were thresholded with a cluster-forming threshold of Z > 2.6 and a family-wise corrected cluster significance threshold of p < 0.05. Mean activation parameters (beta values) of significant clusters were extracted for each participant, and post hoc comparisons corrected with Bonferroni–Holm method were performed in R (R version 3.6.2; Rstudio version 1.2.5033).36
2.3.3 Sensitivity analysisTo make sure our findings did not derive from group differences in sex, we repeated the analysis for each behavioural variable and beta values from each significant cluster in males only. Moreover, to account for additional confounding factors, we performed separate linear mixed-effects models in R (version 3.6.2; Rstudio version 1.2.5033)36 for each behavioural variable and beta values from each significant cluster (in the whole sample). Additional factors consisted of family IDs (random-effects factor; random intercept model) to account for potential confounding effects of family relatedness in the sample, IQ, current use of ADHD medication and comorbid Disruptive Behavioural Disorder (DBD; i.e., ODD or CD) that is thought to represent an SUD risk factor.40
3 RESULTS 3.1 Behavioural resultsThe one-way MANCOVA showed a significant group effect (p < 0.001). Post hoc univariate comparisons showed an effect of group on both MRT (p < 0.001) and ICV (p = 0.006) during go-trials. Pairwise comparisons suggested longer and more variable reaction times for ADHD-only and ADHD + SM, compared with controls (MRT: p = 0.012 for ADHD-only vs. control, p < 0.001 for ADHD + SM vs. control; ICV: p = 0.013 for ADHD-only vs. control, p = 0.008 for ADHD + SM vs. control). There were no significant differences between ADHD-only and ADHD + SM in these variables (MRT: p = 0.172, ICV: p = 0.696). There was also a significant group effect on percentage of errors (p = 0.031), with more errors for ADHD + SM compared with controls (p = 0.034). ADHD-only did not differ from either ADHD + SM patients (p = 0.145) or controls (p = 0.319). We also found a significant group effect on SSRT (p = 0.019) during stop-trials. Post hoc comparisons indicated greater SSRT for ADHD + SM (p = 0.017) compared with controls. ADHD-only did not differ from ADHD + SM patients (p = 0.388) or controls (p = 0.078). Descriptive statistics can be found in Table 2, and covariate effects are summarized in Supporting Information.
TABLE 2. Descriptive statistics and group differences from the behavioural data analysis Dependent variables ADHD-only (n = 33) ADHD + SM (n = 33) Control (n = 33) F value p value (ηp2) Post hoc comparisons (p value) Go-trials Reaction time (MRT; M ± SD) 498.19 ± 73.13 523.73 ± 103.40 455.37 ± 59.29 F(2,92) = 7.98 <0.001 (0.148)a (0.172),
b (0.012),
c (<0.001)
Intra-individual coefficient of variation (ICV; M ± SD) .203 ± .049 .204 ± .051 .177 ± .041 F(2,92) = 5.38 0.006 (0.105)a (0.696),
b (0.013),
c (0.008)
Percentage of errors (M ± SD) 1.99 ± 2.24 3.47 ± 4.7 1.13 ± 1.03 F(2,92) = 3.58 0.031 (0.072)a (0.145),
b (0.319),
c (0.034)
Stop-trials Stop-signal reaction time (SSRT; M ± SD) 267.55 ± 57.95 277.93 ± 52.14 239.52 ± 41.06 F(2,92) = 4.10 0.019 (0.082)a (0.388),
b (0.078),
c (0.017)
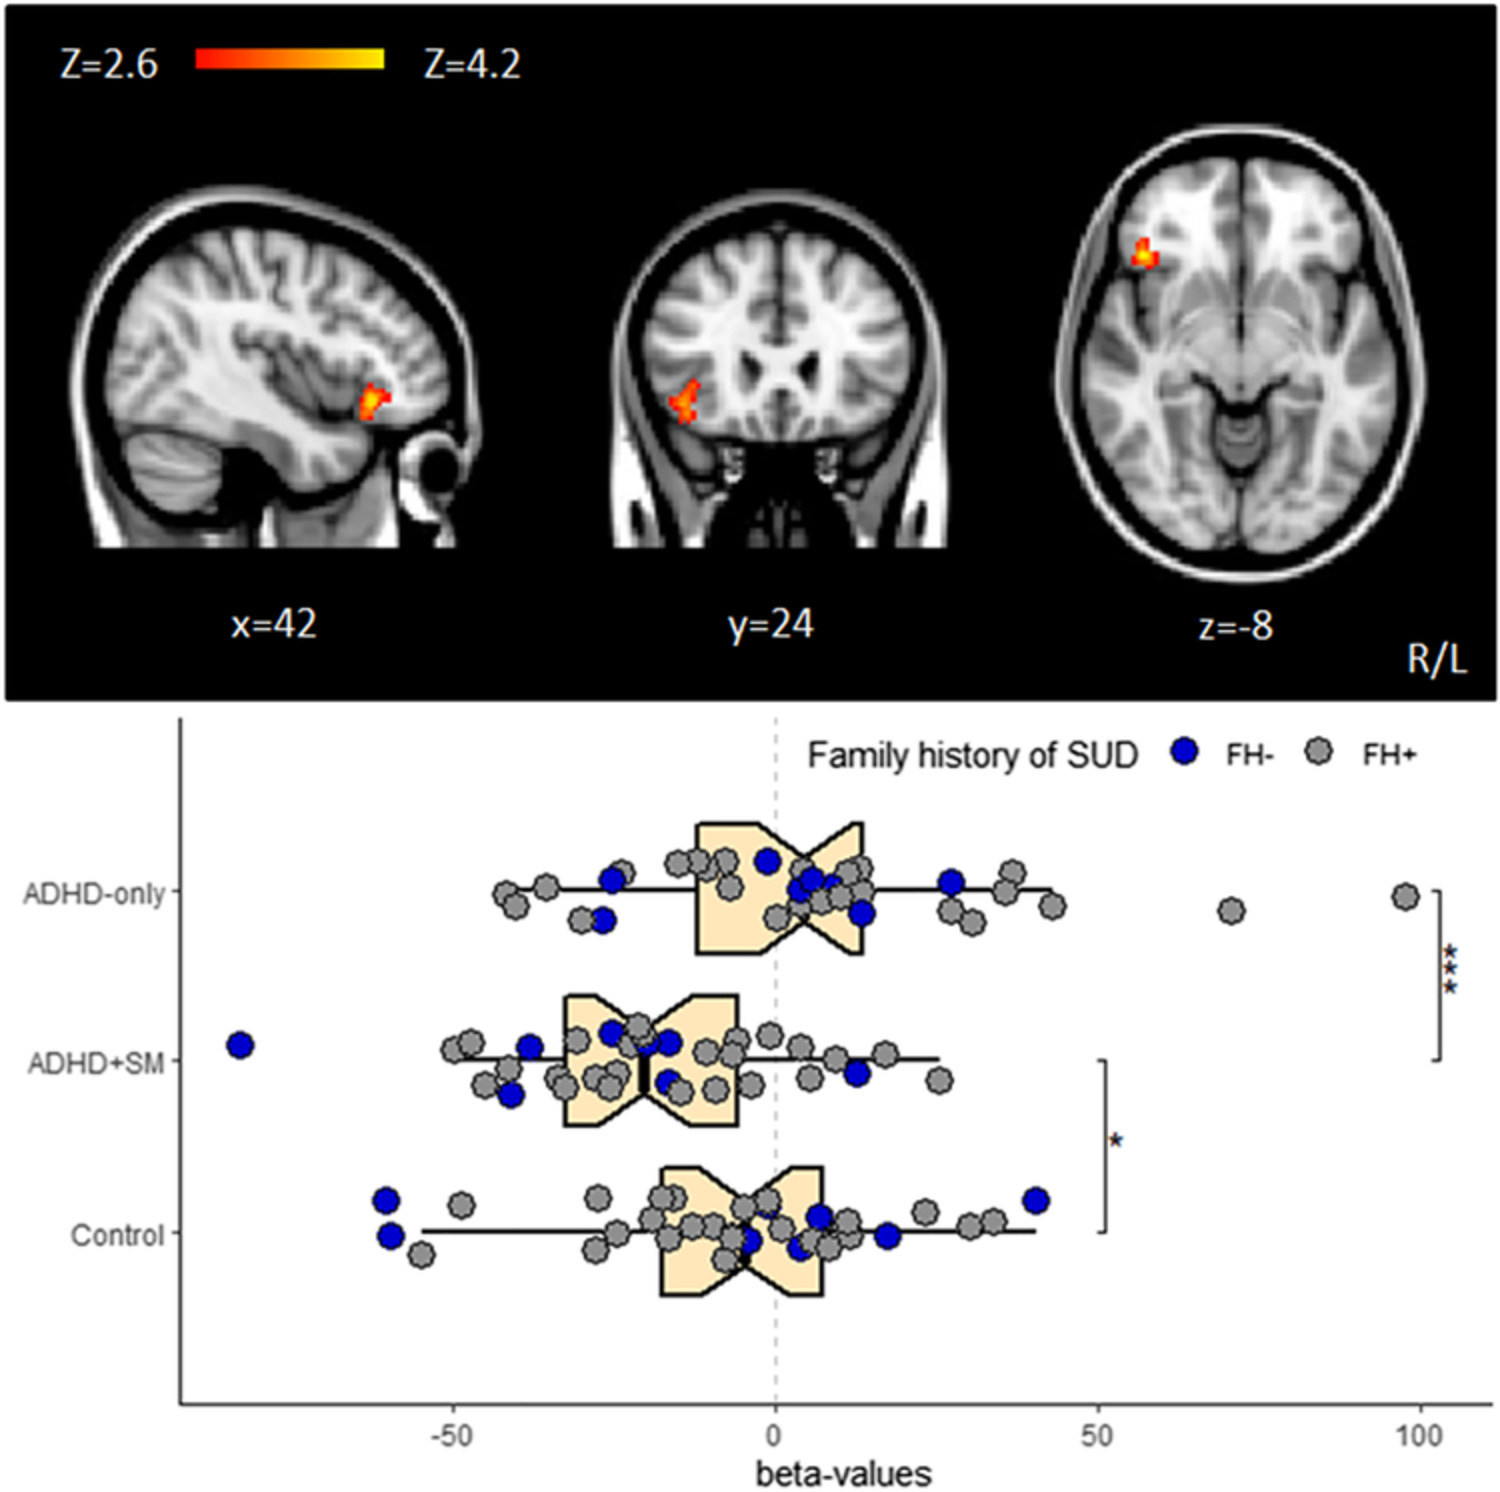
Note: a = ADHD-only versus ADHD + SM; b = ADHD-only versus control; c = ADHD + SM versus control; post hoc comparisons were corrected with Bonferroni–Holm method. Abbreviation: ADHD, attention-deficit/hyperactivity disorder. 3.2 fMRI resultsGroup activation maps during go-trials and successful and failed stop- minus go-trials are summarized in Table S1 and visually presented in Figures S2–S4. During go-trials, the whole-brain analysis revealed significant group differences in a cluster in right inferior frontal gyrus (IFG) and orbitofrontal cortex (OFC; p < 0.001). Post hoc comparisons showed decreased activation in ADHD + SM compared with ADHD-only (p < 0.001) and controls (p = 0.023) but no difference between ADHD-only and controls (p = 0.279; Figure 1). During successful stop- minus go-trials, there were significant group differences in a cluster in bilateral superior frontal gyrus (p = 0.039). Pairwise comparisons suggested decreased activation in ADHD-only (p = 0.021) and ADHD + SM (p = 0.007) compared with controls but no difference between the ADHD groups (p = 0.561; Figure 2A). During failed stop- minus go-trials, there were significant group differences in a cluster in right temporal–parietal junction (p < 0.001). Post hoc comparisons showed hypoactivation in ADHD-only (p < 0.001) and ADHD + SM (p = 0.014) compared with controls and even greater hypoactivation in ADHD-only compared with ADHD + SM (p = 0.008; Figure 2B). Detailed description of the fMRI results can be found in Table 3.

Neural activation in inferior frontal gyrus (IFG) and orbitofrontal cortex (OFC) from the F test contrast for group differences (across attention-deficit/hyperactivity disorder [ADHD]-only, ADHD + SM and control groups) during go-trials (p < 0.001) and boxplots with individual beta values for this cluster (lower part); *p < 0.05, **p < 0.01, ***p < 0.001

2 (A) Neural activation in superior frontal gyrus from the F test contrast for group differences (across attention-deficit/hyperactivity disorder [ADHD]-only, ADHD + SM and control groups) during successful stop- minus go-trials (p = 0.039) and boxplots with individual beta values for this cluster (lower part); (B) neural activation in temporal–parietal junction from the F test contrast for group differences (across ADHD-only, ADHD + SM and control groups) during failed stop- minus go-trials (p < 0.001) and boxplots with individual beta values for this cluster (lower part); *p < 0.05, **p < 0.01, ***p < 0.001
TABLE 3. Significant clusters for group differences from the fMRI data analysis Significant clusters N voxels Hemisphere MNI coordinates F test Post hoc comparisons (p value) x Y z Go-trials Inferior frontal gyrus, orbitofrontal cortex 155 R 44 28 −8 F(2,92) = 7.41; p < 0.001a (<0.001),
b (p = 0.279),
c (0.023)
Successful stop- minus go-trials Superior frontal gyrus 63 R/L 8 64 24 F(2,92) = 6.46; p = 0.039a (0.561),
b (0.021),
c (0.007)
Failed stop- minus go-trials Temporal–parietal junction 398 R 58 −44 24 F(2,92) = 6.95; p < 0.001a (0.008),
b (<0.001),
c (0.014)
Note: a = ADHD-only versus ADHD + SM; b = ADHD-only versus control; c = ADHD + SM versus control; each F value represents average F value across the cluster; MNI coordinates (mm) represent the location of the peak voxel; post hoc comparisons (with extracted beta values) were corrected with Bonferroni–Holm method. Abbreviation: fMRI, functional magnetic resonance imaging. 3.3 Sensitivity analysisFindings of the analysis performed in the male subgroup and the linear-mixed effects models (in the whole sample) did not deviate significantly from those in the main analysis. Exceptions to this were some of the behavioural results. Analysis in the male subgroup did not confirm significantly longer reaction times in ADHD-only compared with controls (p = 0.219; Table S2). The male analysis additionally showed significantly longer SSRT for ADHD-only compared with controls (p = 0.024) that had not reached significance level in the main analysis (p = 0.078). Detailed results from the sensitivity analysis can be found in the Supporting Information.
4 DISCUSSIONThe aim of our study was to examine effects of SM in adolescents and young adults with ADHD, using a sample matched for parental SUD to minimize SUD trait effects. As expected, ADHD patients with and without SM showed decreased activation in areas of the frontostriatal and frontoparietal networks compared with controls during successful and failed stop- minus go-trials. Unexpectedly, there were no differences observed between ADHD patients with and without SM during successful stop- minus go-trials, whereas ADHD patients without SM showed further decreased activation in temporal/parietal areas compared with those with SM during failed stop- minus go-trials. As expected, during go-trials, we observed decreased activation in inferior frontal areas for ADHD patients with SM compared with those without and controls.
Decreased activation in areas of the frontoparietal and frontostriatal networks observed in both ADHD groups during performance of an inhibitory control task is compatible with the ADHD literature.6 Findings suggest deficits in top-down attentional control processes during response inhibition in ADHD.41, 42 Hypoactivation of these networks during response inhibition for ADHD is also consistent with results in van Rooij et al. The current data were part of their data set, and they did not take SM into account.16 Contrary to our hypothesis, we did not observe additive substance use effects on these networks during response inhibition. Similar impairments in frontostriatal and frontoparietal networks for the ADHD groups are in line with Rasmussen et al. that indicated hypoactivation of these networks for ADHD patients regardless of cannabis use.18 Moreover, behavioural performance during these trials was worse for the ADHD groups (ADHD-only reached significance only in sensitivity analysis), and there was no difference between the ADHD groups. This is in contrast with worse performance previously seen in ADHD patients with versus without cocaine dependence and controls.19 Shorter duration and less severe substance use, as well as the use of different substances in our sample, might account for this difference.
Our results, however, indicate distinct SM effects on inferior frontal areas during go-trials, with hypoactivation of a cluster in IFG–OFC for ADHD + SM. IFG is thought to have a central role in response inhibition through detection of salient cues.43 Notably, this region was also found to respond to salient cues associated with motor response initiation or no motor response at all.43 IFG hypoactivation during go-trials might suggest an additional general deficit in sustained attention in ADHD + SM that is not specific to response inhibition but might still affect this process. It would be interesting for future studies to compare neural correlates between ADHD patients with and without SM during other executive functioning tasks that require sustained attention but do not include a response inhibition component. On the other hand, OFC is thought to encode the subjective value of goals in decision-making processes.44, 45 An alternative explanation might thus be that hypoactivation of this region reflects lower action values and an altered intrinsic motivational state. This may suggest deficits in cost–benefit decision-making as a result of SM that subsequently lead to poor performance in control-demanding tasks for ADHD + SM. Interestingly, we recently observed faster reaction times and increased responses of frontostriatal areas in ADHD + SM patients compared with ADHD-only and controls when performing a reward task (with no response inhibition component).
留言 (0)