
記住我

In 2019, a new coronavirus was identified as the cause of a disease outbreak that emerged in Wuhan, a city in Hubei's province in China. This novel virus referred to as severe acute respiratory syndrome coronavirus 2 (SARS-CoV-2) rapidly spread to other provinces of China and to other countries, hence becoming a global health threat and triggering unprecedented measures worldwide. In February 2020, the World Health Organization (WHO) formally named this respiratory infection coronavirus disease 2019 (COVID-19). A month later, the rapidly escalating health crisis led the WHO to declare the SARS-COV-2 outbreak a pandemic.1 As of December 27, the virus had infected at least 79 million people worldwide resulting in more than 1.7 million deaths. On the same day, 97,857 cases were reported in Algeria with an apparent fatality rate of 2.78%.2
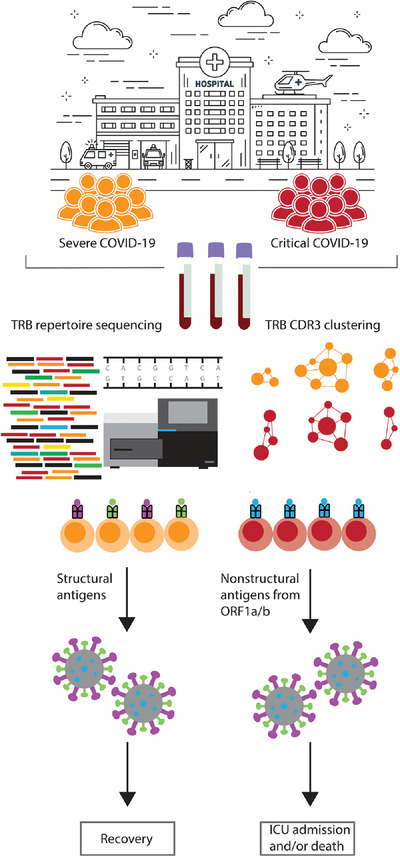
Although most of SARS-CoV-2 infected patients generally display mild-to-moderate symptoms and undergo spontaneous regression, approximately 14% of infected subjects experience a severe disease characterized by a significant hypoxia inherent to the respiratory distress syndrome. The remaining COVID-19 patients, who are mainly individuals over 60 and/or with comorbidities, develop a critical condition, which requires admission to the intensive care unit.3 It is likely that the variation in the overall immune response to SARS-CoV-2 is partly responsible for the clinical heterogeneity. Therefore, the identification of the immune signature of patients with COVID-19 is crucial for predicting the outcome of infection as well as informing clinical risk-based stratification, which can help for early intervention and treatment.
It is widely accepted that lymphocytes play a central role in the defense mechanisms against viral respiratory infection. Therefore, a better understanding of the dynamic changes of lymphocyte populations and the cytokine production in COVID-19 patients is a prerequisite for the development of efficient therapeutics, vaccines, and outcome-prediction tools. A growing number of investigations have reported phenotypic alterations in lymphocyte subsets and overproduction of the inflammatory cytokines, leading to a cytokine storm, indicating a potential association between this immune dysregulation and viral pathogenesis.4, 5 Several meta-analysis studies have identified the relevant risk factors correlated with the progression of the disease. Among these factors lymphocytes counts and cytokines levels have been of great interest.6, 7
The aim of this single-center study was to characterize the changes of peripheral blood lymphocyte subsets and quantify plasma cytokine levels in an Algerian cohort of SARS-CoV-2 infected patients with distinct disease severity. In addition, the study explored the predictive value of these parameters as a prognosis tool to determine the mortality and severity risks in COVID-19 patients.
2 METHODS 2.1 Study design and participantsThis study was conducted at the department of medical immunology at Issaad Hassani University Hospital in Algiers, Algeria. A total of 57 patients were enrolled in the study from March 22 to April 29, 2020. Diagnosis of COVID-19 was confirmed by the detection of SARS-COV-2 nucleic acid in nasopharyngeal swab samples using a real-time RT-PCR test. Blood samples were collected at the moment of the first in hospital consultation for COVID-19 symptoms, before any treatment. The clinical outcomes (survival or death) of all patients were followed up to 28 d after admission in the hospital. All patients received the following treatment: hydroxychloroquine 200 mg + azithromycin 500 mg + vitamin C 250 mg + zinc 10 mg. To assess the impact of infection on the polarization of T helper lymphocytes (Th), 24 age- and sex-matched healthy individuals without SARS-CoV-2 infection were recruited as healthy controls.
The study was approved by the institutional ethics committee of Issaad Hassani University Hospital. Informed consent was obtained from all subjects enrolled in the study.
2.2 Clinical classification of the COVID-19 patientsDisease severity classification of COVID-19 patients was performed according to the interim guidelines from the WHO and the National Health Commission of China8, 9: (i) The mild disease group was defined as patients displaying mild, clinical symptoms with no pneumonia on computerized tomography (CT) imaging. (ii) Patients with a moderate illness were characterized by fever, respiratory symptoms, and a CT imaging indicating the presence of pneumonia. (iii) Patients belonging to the severe disease group were those who met at least one of the following criteria: shortness of breath and respiratory rate ≥ 30 breaths/min; SpO2 ≤ 93% at a rest state; PaO2/FiO2 ≤ 300 mmHg; and/or lung infiltrates >50% of the lung field within 24–48 h. (iv) Critical patients were defined as those meeting at least one of the following conditions: patients with respiratory failure who were in need of mechanical ventilation; patients displaying signs of cardiovascular shock; and patients with other organ failures, which required monitoring in the intensive care unit.
For the purpose of the following study, the cases were divided into nonsevere (mild to moderate) and severe groups (severe to critical).
2.3 Data collectionData on demographic characteristics, comorbidities, severity assessment on admission, as well as clinical outcomes were retrieved from a medical record system. All data were reviewed and validated by a team of trained physicians.
2.4 Measurement of cytokine levelsApproximately 4–5 ml of anticoagulant fresh peripheral blood were collected from patients with COVID-19 and healthy controls. The plasma samples were separated by centrifugation at 2500 rpm for 10 min at 4°C, and immediately stored at −80°C until analysis.
IL-2, IL-4, IL-6, IFNγ, IL-10, IL-17A, and TNFα were quantified using BD Cytometric Bead Array Human Th1/Th2/Th17 Cytokine Kit (BD Biosciences, San Jose, CA, USA) following manufacturer's instructions. Briefly, 50 μl of mixed capture beads were incubated with 50 μl of cytokines standards or plasma samples along with 50 μl of phycoerythrin detection reagent at room temperature for 3 h. The captures beads were washed and resuspended in 300 μl of wash buffer and were then acquired on the BD FACSLyric flow cytometer (Becton Dickinson, San Jose, CA, USA). The acquired data were subsequently analyzed for individual cytokine concentrations using the FCAP Array Software Version 3.0 (BD Biosciences). The detection limits were, respectively: 2.6 pg/ml for IL-2; 4.9 pg/ml for IL-4; 2.4 pg/ml for IL-6; 4.5 pg/ml for IL-10 pg/ml; 3.8 pg/ml for TNF-α; 3.7 pg/ml for IFNγ; and 18.9 pg/ml for IL-17A.
2.5 Quantification of lymphocyte subsetsFor the immune cell phenotyping, 1 ml of peripheral blood (EDTA—anticoagulated whole blood) was used within 8 h from collection. Lymphocytes were stained with the monoclonal antibodies listed in the Supporting Information Table S1. After red blood cell removal using a lysis buffer followed by washing steps, cells were stained and acquired using a BD FACSLyric flow cytometer (Becton Dickinson) and the data were analyzed using BD FACSuite Software (BD Biosciences).
Lymphocyte subsets were defined as follows10: T cells (CD3+), CD4+ T cells (CD3+CD4+), CD8+ T cells (CD3+CD8+), B cells (CD3−CD19+), and natural killer (NK) cells (CD3−CD16+CD56+). In CD4+ T cells compartment, recent thymic emigrant (RTE) were defined as (CD4+CD31+CD45RA+), effector and central memory CD4+ T cells as (CD4+CD45RO+), and for those who remain as (CD4+CD45RA+). CD8+ T cells maturation subsets were identified using CCR7 (CD197) and CD45RA and include naïve (CCR7+CD45RA+), terminally differentiated T cells (TEMRA; CCR7−CD45RA+), central memory (CCR7+CD45RA−), and effector memory (CCR7−CD45RA−).
2.6 T cell activation and intracellular cytokine stainingHeparinized blood samples collected from COVID-19 patients and healthy controls were cultured at 1 h after collection. Whole blood (500 μl) was diluted 1:1 with RPMI 1640 supplemented with PMA (2.5 ng/ml, Sigma-Aldrich, St Louis, MO, USA), ionomycin (1 μg/ml, Sigma-Aldrich), and BD GolgiStop (BD Biosciences). Cells were incubated for 4 h at 37°C in the presence of 5% CO2. A total of 100 μl of the stimulated cells were stained with an antibody cocktail containing anti-CD3 and anti-CD4 antibodies (Supporting Information Table S1). The cells were then fixed with 300 μl of BD Cytofix Fixation Buffer (BD Bioscience) and permeabilized with 2 ml of BD Perm/Wash permeabilization buffer (BD Biosciences) following the manufacturer instructions. The cells were washed and incubated with the human Th1/Th2/Th17 phenotyping cocktail (BD Biosciences) and anti-CD3 for 30 min. For each sample, 20,000 CD4+ cells were acquired on BD FACSLyric flow cytometer (Becton Dickinson) and analyzed with BD FACSuite Software (BD Biosciences). Th1, Th2, and Th17 cells were identified as CD3+CD4+ cells producing IFNγ, IL-4, and IL-17, respectively. Results were expressed as a percentage of IL-17+ (Th17) or IL-4+ (Th2) or IFNγ+ (Th1) expressing cells from CD3 and CD4+ T cell population.
2.7 Statistical analysisAll statistical analyses were performed by SPSS software (IBM Statistic 20.0) and GraphPad Prism software 6. Shapiro-Wilk normality test was conducted to estimate the distribution of the data. Categorical variables were expressed as frequency rates or percentages and significance was detected by χ2 or Fisher's exact test. Continuous variables were expressed as mean and sd or medians and interquartile range (IQR) values. For normally distributed continuous variables, differences between groups were compared using independent group t-test; conversely, the Mann-Whitney U-test was used for continuous variables that were not normally distributed. Correlations were determined using the Spearman rank correlation analysis. Receiver operating characteristic (ROC) curve analysis was conducted to evaluate the ability of the immunologic parameters in predicting patient outcomes. The optimal cut-off points were obtained by calculating Youden's index. Backward stepwise binary logistic regression was performed on the covariates. Survival analysis was performed using Kaplan-Meier method. For all statistical analysis, P ˂ 0.05 was considered statistically significant.
3 RESULTS 3.1 Demographics and baseline characteristicsA total of 57 patients with SARS-CoV-2 infection were included in this study. The baseline characteristics of patients were summarized in Table 1. The mean age of the subjects was 59.72 yr. A total of 40 patients (70.18%) were males and 17 (29.82%) were females. Of the 23 patients with comorbidities (40.35%), hypertension (19.30%), and diabetes (12.18%) were the most common underlying diseases, followed by benign tumors and pulmonary diseases, with almost identical percentages for each condition at around of 7.02%, hypothyroidism 5.26%, and cardiovascular diseases (1.75%).
TABLE 1. Baseline characteristics of patients All patients N = 57 Nonsevere N = 31 Severe N = 26 P-value Age (years) 59.72 (±14.95) 53.71 (±14.42) 66.88 (±12.38) ˂0.001Sex
Male
Female
40/57 (70.18%)
17/57 (29.82%)
19/31 (61.29%)
12/31 (38.71%)
21/26 (80.77%)
5/26 (19.23%)
0.109Underlying diseases
Any
Hypertention
Cardiovascular disease
Diabetes
Tumors (benign)
Pulmonary diseases
Hypothyroidism
Others
23/57 (40.35%)
11/57 (19.30%)
1/57 (1.75%)
7/57 (12.28%)
4/57 (7.02%)
4/57 (7.02%)
3/57 (5.26%)
4/57 (7.02%)
5/31 (16.12%)
2/31 (6.45%)
0/31 (0%)
1/31 (3.23%)
1/31 (3.23%)
0/31 (0%)
2/31 (6.45%)
2/31 (6.45%)
18/26 (69.23%)
9/26 (34.62%)
1/26 (3.85%)
6/26 (23.08%)
3/26 (11.54%)
4/26 (15.39%)
1/26 (3.85%)
3/26 (11.54%)
˂0.001
Clinical outcomes
Cured and discharge
Death
42/57 (73.68%)
15/57 (26.32%)
31/31 (100%)
0/31 (0%)
11/26 (42.31%)
15/26 (57.69%)
˂0.001 Data are expressed as mean ± sd or n/N (%), where N is the total number of patients with available data. P-values comparing nonsevere and severe group are from independent group t-test, χ2, or Fisher's exact test.According to the guidelines criteria described in Section 2 (Methods), the patients were divided into two groups with respect to the severity of their illness: Among the patients, 31 cases (54.38%) were classified as nonsevere group and 26 (45.62%) categorized as severe group. Compared with the patients in the nonsevere group, patients in the severe group were older (66.88 ± 12.38 yr vs. 53.71 ± 14.42 yr, P < 0.001) and were commonly associated with underlying comorbidities (18/26 [69.23%] vs. 5/31 [16.12%], P < 0.001). In addition, there were no significant gender differences between the two groups. The patients in the severe group showed a higher mortality than that in the nonsevere group (15/26 (57.69%) vs. 0/31 (0%); P < 0.001). Based on the outcome of the disease, 42 patients were ultimately discharged (73.68%) and 15 patients died (26.32%).
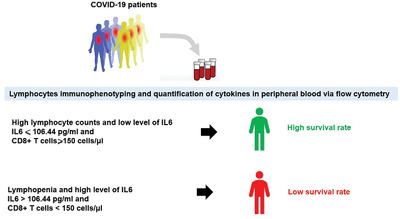
3.2 Lymphocyte subsets and cytokine alterations in COVID-19 patients with different disease severity and outcomesThe quantification of peripheral blood lymphocyte subsets shown in Table 2 and Supporting Information Table S2 were compared with those already established in the literature as a reference10 for adults with the same age group. Our data showed that lymphocyte absolute counts were below the normal range in 36 (63.15%) patients with a median of lymphocyte counts of 758.0 cells/μl (IQR, 480.5–1288.5). A significant decrease in total lymphocyte counts was found in the severe cases compared to the nonsevere group (513.5 vs. 1199 cells/μl; P ˂ 0.001) (Fig. 1A). Furthermore, this decrease was more pronounced in the fatal cases when compared to survived patients (401 vs. 983.5 cells/μl; P ˂ 0.001) (Fig. 1B). The absolute counts of the main lymphocyte subsets (T cells, B cells, and NK cells) were decreased in more than one-third of patients with COVID-19. T cells decreased in 33 (57.89%) patients, B cells decreased in 31 (54.38%) patients, and NK cells decreased in 21 (36.84%) patients. Among patients with nonsevere COVID-19, the median value of total T cells, B cells, and NK cells counts were 789, 150, and 171 cells/μl, respectively, whereas the median values decreased to 354, 40, and 76 in the severe group. Moreover, this study found that the median values of these subsets were significantly higher in nonsurvivors than in the survivor group (277 vs. 726 cells/μl; P < 0.001 for T cells, 39 vs. 112.5 cells/μl; P = 0.006 for B cells and 58 vs. 157.5 cells/μl; P = 0.003 for NK cells) (Fig. 1B).
TABLE 2. The laboratory findings of patients (categorized by severity of illness and survival states) Nonsevere vs. severe Survival vs. death Normal range* All patients (N = 57) Nonsevere (N = 31) Severe (N = 26) P-value Survival (N = 42) Death (N = 15) P-valueLymphocyte subsets
Lymphocytes (T cells + B cells + natural killer [NK] cells)/μl
T cells (CD3+)/μl
B cells (CD3−CD19+)/μl
NK cells (CD3−CD16+CD56+)/μl
1000–2500
700–1900
100–400
100–400
758 (480.5–1288.5)
521 (305.5–859.5)
92(38–175.5)
136 (66–216.5)
1199 (704–1623)
789 (465–1153)
150 (67–249)
171 (133–292)
513.5 (271–701)
354 (178–489.50)
40 (26.75–92.25)
76 (49.75–139.50)
˂0.001
˂0.001
˂0.001
˂0.001
983.5 (610.75–1372.5)
726 (391.75–968.75)
112.5 (56–181.5)
157.5 (96.5–250.5)
401 (243–642)
277 (146–463)
39 (27–92)
58 (39–123)
˂0.001
˂0.001
0.006
0.003
T cells subsets
CD4+ T cells/μl
CD8+ T cells/μl
CD4+/CD8+
DP T cells (CD4+CD8+)/μl
CD4+CD45RA+ T cells/CD4+ T cells %
RTEs (CD3+CD4+CD45RA+CD31+)/CD4+ T cells %
CD4+CD45RO+ T cells/CD4+ T cells%
Naïve CD8+ T cells (CD8+CD45RA+CCR7+)/CD8+ T cells %
TEMRA CD8+ T cells (CD8+CD45RA+CCR7−)/CD8+ T cells %
CM CD8+ T cells (CD8+ CD45RA−CCR7+)/T CD8+ T cells %
EM CD8+ T cells (CD8+CD45RA−CCR7−)/CD8+ T cells %
Activated CD4+ T cells (CD4+HLADR+CD38+)/CD4+ T cells %a
Activated CD8+ T cells (CD8+HLADR+CD38+)/CD8+ T cells %a
CD4+ IFNγ+ (Th1)/CD4+ T cells %b
CD4+ IL-4+ (Th2)/CD4+ T cells %b
CD4+ IL-17A+ (Th17)/CD4+ T cells %b
400–1300
200–700
1.5–2.9
2–88
29.4–55.4
6.4–41.7
44.4–68.9
28.6–64.3
14.4–48.8
6.1–14.3
6.4–16.7
1.2–2.3
2.5–6.7
/
/
/
288 (149–440)
208 (119–328)
1.4 (0.965–1.995)
8 (3.5–18.5)
27 (19.5–42.75)
15 (8.5–22.5)
73 (57.25–80.5)
11.3 (5.17–25.17)
46.29 (31.83–60.24)
4.19 (2.965–5.26)
32.56 (19.99–40.45)
3 (1.9–4.85)
6.8 (3.295–14.6)
16.34 (11.48–20.80)
2.53 (1.24–3.97)
1.56 (0.67–3.8)
395 (264–661)
295 (197–432)
1.46 (0.91–2.05)
8 (4–19)
27 (19–37.50)
15 (10.50–25.50)
73 (62.50–81)
17.21 (7.21–33.83)
46.29 (30.50–58.05)
4.07 (3.14–5.32)
29.85 (22.38–36.69)
2.65 (1.36–5.43)
6.34 (2.79–10.03)
17.25 (12.76–24.29)
2.45 (1.24–4.66)
0.98 (0.53–3.02)
160 (82.50–250.50)
126.5 (58.25–203.50)
1.35 (1.16–1.94)
6 (2–14)
27.25 (19.62–48.50)
12 (7.25–21.75)
72.75 (51.50–80.38)
7.31 (3.46–15.43)
47.27 (34.80–62.44)
4.415 (2.78–5.20)
34.62 (16.90–52.45)
3 (2.50–4.40)
9 (4–20)
14.17 (9.58–19.19)
2.53 (1.2–3.79)
1.65 (1.36–5.12)
˂0.001
˂0.001
0.974
0.275
0.380
0.476
0.380
0.014
0.344
0.898
0.293
0.239
0.234
0.112
0.739
0.105
299 (192.25–513)
273 (162.5–374.75)
1.3 (0.85–1.83)
8.5 (4.75–19)
29 (20.38–41.13)
16.75 (10–22.13)
71 (58.88–79.63)
15.17 (6.26–32.79)
46.80 (30.88–60.23)
4.09 (2.54–5.28)
30.28 (19.05–36.83)
2.6 (1.51–4.52)
6.42 (2.77–8.85)
17.25 (12.76–24.29)
2.43 (1.51–3.98)
1.32 (0.63–3.55)
146 (81–321)
119 (50–163)
1.5 (1.28–2.7)
4 (2–10)
23.5 (18–53)
11 (8–24)
76.5 (47–82)
6.57 (3.08–14.3)
43.55 (34.2–60.3)
4.8 (3.27–5.25)
42.75 (20.48–57.97)
3.4 (2.78–5.6)
9.5 (5.4–23.75)
12.65 (7.42–17.64)
2.63 (0.92–4.19)
1.56 (1.31–5.84)
0.004
˂0.001
0.030
0.022
0.928
0.253
0.928
0.016
0.951
0.310
0.052
0.051
0.053
0.042
0.692
0.333
Cytokines
IL-17A (pg/ml)
IFNγ (pg/ml)
TNFα (pg/ml)
IL-10 (pg/ml)
IL-6 (pg/ml)
IL-4 (pg/ml)
IL-2 (pg/ml)
/
/
/
/
/
/
/
0 (0–8.18)
0.41 (0–2.32)
0.86 (0.12–2.10)
4.11 (1.45–8.13)
52.25 (13.03–127.08)
0.86 (0.35–1.40)
0 (0–0)
0 (0–18.19)
0 (0–1.38)
1.04 (0.37–1.99)
2.13 (0.75–4.11)
20.22 (3.38–42.59)
1 (0.56–1.65)
0 (0–0.05)
0 (0–0.94)
0.71 (0.14–2.95)
0.39 (0–2.36)
7.45 (4.5–11.57)
136.45 (89.12–255.80)
0.79 (0–1.09)
0 (0–0)
0.240
0.038
0.214
˂0.001
˂0.001
0.137
0.407
0 (0–11.24)
0.21 (0–2.48)
0.86 (0.17–1.57)
2.85 (0.9–6.51)
24.65 (6.52–71.52)
0.97 (0.53–1.58)
0 (0–0.01)
0 (0–0)
0.56 (0–1.01)
0.6 (0–3.46)
7.88 (4.33–13.72)
198.27 (138.96–288.02)
0.79 (0–0.97)
0 (0–0)
0.385
0.708
0.729
0.001
˂0.001
0.060
0.596
*Reference values for the lymphocyte subsets, according to Yi et al.10 Data are presented as medians and interquartile ranges. P-values comparing nonsevere and severe group, survival and death group are from independent group t-test, or Mann-Whitney U-test.COVID-19: coronavirus disease 2019; CD4+ T cells; CD8+ T cells; DP: double positive; RTEs: recent thymic emigrants; TEMRA: terminally differentiated effector memory-RA; CM: central memory; and EM: effector memory.
Lymphocyte subsets and cytokine levels in coronavirus disease 2019 (COVID-19) patients. (A) and (B) Lymphocyte subsets in different groups. (C) Proportion of Th1, Th2, and Th17 cells among healthy controls and COVID-19 patients. (D) and (E) Cytokines levels in different groups
In addition to the changes occurring in lymphocyte subpopulations, the study extended our analysis to the different subsets of T lymphocytes. CD4+ T cells and CD8+ T cells were, respectively, decreased in 42 (73.68%) and 27 (47.36%) COVID-19 patients. Interestingly our data revealed that CD4+/CD8+ ratio was below the normal range in 33 patients (57.89%). When compared to the nonsevere group, a more substantial decrease in both CD4+ T cells and CD8+ T cells was noticed in the severe group (160 vs. 395 cells/μl; P < 0.001 for CD4+ T cells, 126.5 vs. 295 cells/μl; P < 0.001 for CD8+ T cells) (Fig. 1A). A similar tendency was also observed between fatal cases and survivors (146 vs. 299 cells/μl; P = 0.004 for CD4+ T cells, 119 vs. 273 cells/μl; P < 0.001 for CD8+ T cells) (Fig. 1B). The CD4+/CD8+ ratio showed no difference between severe and nonsevere cases whereas a statistically significant difference was observed between survivors and deceased patients (P = 0.03). The frequencies of naïve CD8+ T cells (CD8+, CD45RA+, CCR7+) decreased in 45 patients (78.94%), which were markedly lower in severe cases compared to nonsevere COVID-19 patients (7.31% vs. 17.21%; P = 0.014). Lower frequencies were also found in the deceased group compared to patients who were cured and discharged from the hospital (6.57% vs. 15.17%; P = 0.016). The percentages of effector memory CD8+ T cells (CD3+, CD8+, CD45RA−, CCR7−) increased in 47(82.45%) patients. Interestingly, there was no statistical difference between severe and nonsevere cases (P = 0.293), but a clear tendency to significance (P = 0.052) was found between dead patients and survivors. Quantification of (CD4+, CD45RA+) T cells, RTE (CD4+, CD45RA+, CD31+), effector, and central memory CD4+ T cells (CD4+, CD45RO+), TEMRA CD8+ T cells (CD3+, CD8+, CD45RA+, CCR7−), and central memory CD8+ T cells (CD3+, CD8+, CD45RA−, CCR7+) did not show any significant difference regardless of the disease severity and the survival. However, the study observed that more than half of the patients 30 (52.63%) had decreased percentages of (CD4+, CD45RA+) T cells without a perturbation in thymic output of RTE in 48(84.21%) patients. Furthermore, this study noticed an increase of (CD4+, CD45RO+) T cells in 31(54.38%) patients, whereas only 25 (43.85%) patients had an increase of their peripheral TEMRA CD8+ T cells. Moreover, and most of the patients had low frequencies of central memory CD8+ T cells 45 (78.94%).
In parallel to the quantification of T cell subsets upon SARS-COV2 infection, the study also used HLA-DR and CD38 to determine the activation status of T cells.11-14 This study observed that both median frequencies of CD38+HLA-DR+ CD4+T cells (3%, IQR 1.9–4.85) and CD38+HLA-DR+ CD8+ T cells (6.8%, 3.295–14.6) were above the upper reference limits in COVID-19 patients. Interestingly, increased activated CD4+T cells and CD8+ T cells was observed in patients with a fatal outcome compared to those who survived (P = 0.051 and P = 0.053).
In order to characterize the nature of CD4 T helper response to SARS-CoV-2 infection, the percentages of CD4+IFNγ+ (Th1), CD4+IL-4+ (Th2), and CD4+IL-17A+ (Th17) cells were assessed by flow cytometry. As shown in Figure 1C and Table 2, COVID-19 patients exhibited a significant reduction in the proportion of IL-4 producing CD4+ T cells and a significant increase of Th17 frequency when compared to healthy subjects (P < 0.0001 and P = 0.009). On the other hand, only a significant decrease of Th1 cells was observed in the patients who died compared to those who recovered (P = 0.042). Interestingly, no differences were found between nonsevere and severe cases in terms Th frequencies. Besides the analysis of Th populations, the study also assessed plasma cytokine levels in these patients (Table 2). IL-6 and IL-10 concentrations were markedly higher in deceased cases compared to the survivors (P < 0.001 and P = 0.001) (Fig. 1E). The patients who had a severe clinical disease showed a significant increase of IL-6, IL-10, and IFNγ (P < 0.001, P = 0.001 and P = 0.038) (Fig. 1D).
3.3 Correlation between lymphocyte subsets and cytokinesIn order to gain a broader understanding of the immune response triggered by SARS-COV2 infection, the study examined the correlation between the different lymphocyte subsets and the cytokine levels (IL-2, IL-4, IL-6, IL-10, TNFα, IFNγ, and IL-17A) (Table 3, Fig. 2). The analysis revealed a strong positive correlation between IL-6 and IL-10 (r = 0.783, P < 0.0001). The total lymphocyte T cell, CD4+ T cell, CD8+ T cell, B cell, NK cell, and, double positive (DP) cell numbers as well as the frequencies of naïve CD8+ T cells were negatively correlated with IL-6 and IL-10 levels (P < 0.01). In contrast, IL-6 and IL-10 concentrations were positively correlated with the frequencies of terminally differentiated TEMRA CD8+ T cells (P < 0.05, P < 0.01). Furthermore, the study found that the levels of IL-4 and TNFα were positively correlated with total lymphocyte, T cell, NK cell, CD4+T cell, CD8+ T cell, and naïve CD8+ T cell counts. No correlation was found between theses lymphocyte subsets and IL-17A concentrations. Similarly, there was no significant correlation between IL-17A and Th17 cells (data not shown).
TABLE 3. Correlations between lymphocytes subsets and cytokines Cytokines Lymphocyte subsets IL-17 A IFNγ TNFα IL-10 IL-6 IL-4 IL-2 Lymphocytes 0.058 −0.162 0.271* −0.455** −0.554** 0.295* 0.123 T cells (CD3+) 0.030 −0.229* 0.290* −0.465** −0.547** 0.296* 0.107 B cells (CD3−CD19+) 0.102 −0.158 0.221* −0.463** −0.501** 0.111 0.117 Natural killer (NK) cells (CD3−CD16+CD56+) 0.154 ,009 0.308** −0.323** −0.442** 0.340** 0.109 CD4+ T cells 0.082 −0.221* 0.316** −0.482** −0.537** 0.295* 0.110 CD8+ T cells −0.015 −0.162 0.237* −0.370** −0.469** 0.237* 0.056 DP T cells (CD3+CD4+CD8+) −0.216 −0.193
留言 (0)