
記住我


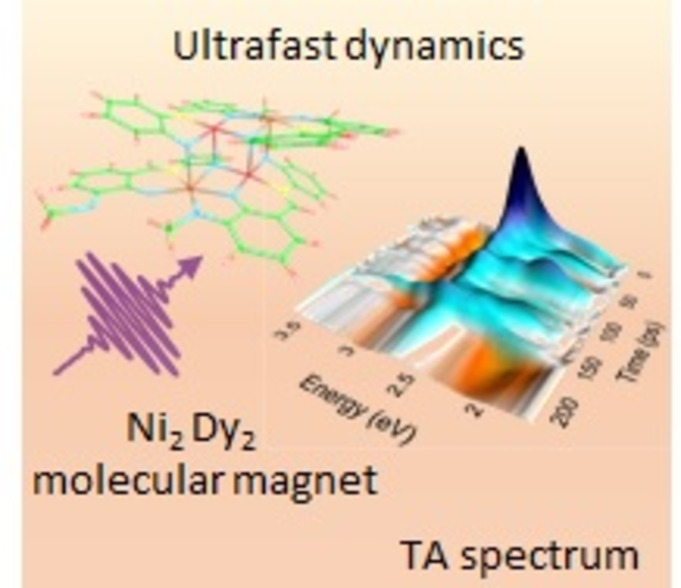
The idea of mixing 3d and 4f metal ions within molecular systems has recently received increasing attention especially in the field of single molecule magnets (SMMs). Here the cooperativity amongst the paramagnetic metal ions is often difficult to unravel. The exchange coupling is expected to be relatively small, but the dipolar coupling should be significant, especially in cases where strongly anisotropic 4 f Ising ions such as Dy(III) are present. One of the most intriguing aspects here is the fact that in some cases the presence of 3d ions has a moderating effect on the usually very fast relaxation processes of 4 f metal ions like Dy(III).1 Indeed, it has been shown that the usual “shortcuts” through the energy barrier to spin reversal for the 4 f components can be quenched by providing a suitable 3d metal ion - in the best cases so far identified this is the Co(II) ion in its high spin configuration.1, 2 On examining single ion properties in terms of magnetization relaxation processes it is clear that in addition to theoretical approaches an appropriate experimental method is to use very fast UV/Vis pump-probe femtosecond spectroscopy to help unravel details of the electronic state rearrangements.3 We can note here that the single ion relaxation processes of 4 f ions are regularly within a timescale of 10−10 to 10−15 seconds, which makes ultrafast techniques such as femtosecond spectroscopy extremely relevant. Given that it is always desirable to probe electronic structures using a multitechnique approach, preferably with experimentation as well as theory, we decided to investigate a Ni2Ln2 system which has the benefit of being accessible to theory as well as further experimentation. The magnetic details in terms of susceptibility, slow relaxation of the magnetization and spin state of the system have already been published and here we expand on these results by closely examining the possibility that vibrational modes contribute to the zero-field tunneling observed in the microSQUID measurements on oriented single crystal arrays.4 We use theory and femtosecond spectroscopy to aid in gaining further insights into this system. This study provides a useful approach and way forward for examining the effect of processes operating on various timescales which shed light on relaxation pathways in such molecular-based SMM systems.
“Single Molecule Magnets” are called like this in the first place, because they act like a bulk material even though they are molecules. The best analogy is perhaps with superparamagnetic magnetic nanoparticles.5-7 The [Dy2Ni2(L)4(NO3)2(DMF)2] structure investigated in this manuscript (Figure 1) has already been successfully synthesized and characterized.8 This relatively small molecule, which contains two Ni and two Dy atoms, can act as a prototypic system for coordination clusters of transition metals covalently bound to oxygen, in which the magnetic and optical properties can be fine-tuned by adjacent lanthanides.9-11 Nonetheless, its size still allows relatively accurate and reliable theoretical calculations by specifically addressing the various electronic excited states.

The complete complex. The core is emphasized with the darker bonds. The molecule has no charge. (Dy: cyan, Ni: green, O: red, N: magenta, C: dark gray, H: light gray).
The “butterfly” structure of the ligand is a defect-dicubane core topology coordination. Especially for tetranuclear  -
- clusters, this is one of the more familiar structural motifs in magneto-chemistry.12 The Schiff-based ligand ((E)-2-(2-hydroxy-3-methoxybenzylideneamino)phenol, (H2L) has two types of pockets:13 Pocket-I, ONO-donating; Pocket-II, OO-donating. Dy2Ni2 was synthesized as described by Mondal et al.8 and dissolved in dimethylformamide for steady state and transient absorption experiments.
Interestingly, it has been found before that defect-dicubane compounds exhibit single molecular magnet behavior with significant barriers to spin reorientation.14-16 A similar behavior was also observed in several 3d–4f coordination clusters with different core topologies.17-31
Transient absorption has been employed for decades in order to measure time-dependent optical phenomena on various time scales. Especially on the ultrafast (subpicosecond) time scale it represents an important investigation tool, e. g., for the energy transfer in a photosynthetic membrane, which typically takes place on a time scale of less than 100 fs.32 In general the technique involves two laser pulses, i. e., a pump and a probe laser pulse which jointly interact with a sample. The pump pulse produces a nonlinear optical response in the sample and influences the absorption of the probe pulse, leading to a stroboscopic detection of the absorption properties of the sample. Quite often, as in our work, the detected absorption spectra are put in relation to the ground state spectrum and consequently the difference spectra are given. Although generally these excitation processes are well understood,33, 34 the exact molecular orbitals participating in the virtual excitations of the pertinent many-body states are often challenging to identify and analyze.
Mostly the investigated samples are not disconnected from the environment.35 In order to give a theoretical explanation of the experimental physics a description of the sample as a closed quantum system is insufficient. In this contribution the density matrix formalism is used for the theoretical calculations. The Lindblad superoperator describes the interaction of the sample with its environment leading to energy dissipation, decoherence and relaxation effects.36
Interesting physics has been found in magnetic materials on similar time scales, i. e. picoseconds (ps) 10−12 s and femtoseconds (fs) 10−15 s. The milestone experiment of Beaurepaire et al. in 1996,37 which for the first time showed laser-induced demagnetization in ferromagnetic Ni in the subpicosecond regime was the starting point of a quickly growing field and attracted great interest,38-43 since it showed how to manipulate the spin state of magnetic materials orders of magnitude faster than before and thus opened the way to “spintronics” applications (i. e., logic devices in which the spin rather than the charge of the electrons take over the role of the information carrier).44-48 This promising perspective among others also launched investigation of many different functionalities based on Λ processes (i. e., electronic excitation of a system to an intermediate state immediately followed by a deexcitation to a different state than the original one, all with a single laser pulse) and the applicability on real, synthesized structures.35, 49-51 Furthermore, also more complicated processes, such as the V and the four-photon M processes (the letters Λ, V, and M roughly indicate the energy positions of the involved electronic states), also in conjunction with bath reservoirs, have been investigated.52, 53 Note that slow direct relaxation is a prerequisite for the success of the coherent Λ, V, and M processes, corroborating the joint role of f and d electrons in these types of systems. Element-resolved laser-induced magnetization dynamics was also reported in  -
- systems, such as the ferrimagnetic CoDy.54
Since the Ni2Dy2-system or any other related system do not show luminescence, it is expected that there are other dominating relaxation channels after photoexcitation, which occur on an ultrafast timescale (ps and fs). One commonly used method to explore this time scale is transient broadband absorption spectroscopy. Typically, the analysis is straightforward as it can be analysed linearly after some coherent artefacts around time zero. Often, the analysis does not require sophisticated calculations of nonlinear coupling terms and can, in principle, be directly compared with theoretical calculations of excited states. Finally, the excitation intensities applied in transient absorption spectroscopy can be kept comparably moderate resulting in higher photo stability of this group of complexes.
For the theoretical description of our highly correlated magnetic system we employ an adequate post-Hartree-Fock quantum-chemistry method, from the coupled-cluster family. Generally coupled-cluster methods are capable of adequately describing both static correlations (which dominate magnetism) and dynamical correlations (which govern the optical properties, since they consist of charge-transfer virtual excitations).55 At the same time, being size-consistent it allows for much better description of geometry deformations (such as vibrations) than the simpler configuration-interaction based methods for both the ground and the electronically excited states.56-58
In our joint experimental and theoretical study we mainly investigate the dynamics of the cluster after the excitation with a laser pulse, and compare the observed ultrafast transient absorption spectra with state-of-the-art quantum chemistry. Our approach allows us to not only compare the experimental and the theoretical relaxation times, but to also assign the specific electronic transitions involved (at least on a semi-quantitative basis), as well as to analyze their charge-transfer nature.
2 Static PropertiesBefore we delve into the investigation of the dynamic properties of the system, which is our main goal, we must first perform some static quantum chemical calculations and compare their results with experimental spectra, in order to assess their validity. Furthermore, the analysis of the energy levels, can give us some additional insight into the microscopic mechanisms involved in the dynamics studied in the next section.
2.1 Energy LevelsFor our ab initio calculations we employ the high-level coupled-cluster method with single and double excitations (CCSD),59-61 followed by the the equation-of-motion CCSD (EOM-CCSD) for the excited states,58, 62 as implemented in the GAMESS quantum chemistry package,63 and the perturbative inclusion of spin-orbit coupling (SOC) and a static magnetic field (Zeeman splitting, to distinguish between spin-up and spin-down states). In our experience, this combination is a very good compromise between incorporating enough static correlations to adequately describe most of the  transition states (missing only few of the higher multiplicity states), which govern magnetism, and the satisfactory description of the charge-transfer states, which are responsible for the optical excitations. For the non-metallic atoms we use Slater-type basis sets: STO-2G for the hydrogens and STO-6G for the rest.64 For the two Ni atoms we use the SPK-DZC basis set,65 while for the two Dy atoms we use and compare two different basis sets, i. e., SARC-ZORA66 and WTBS.67, 68 The resulting many-body energy level scheme is shown in Figure 2. Although after the inclusion of SOC the spin Ŝ2 is not a good quantum number anymore, inspection of the ground-state wavefunction reveals that the ground state can be approximately considered a triplet state. In the remainder of this manuscript the words “singlet” and “triplet” should be understood in a similar loose manner.

Level schemes of the complex without (left) and with (right) SOC and a magnetic field, calculated with the SARC-ZORA and the SPK-DZC basis set for Dy and the Ni, respectively. Green is the reference (CCSD) state. Red are the triplet states, and black the singlet states. Blue are the states after the inclusion of SOC, for which  (and hence the multiplicity) is not a good quantum number anymore.
The importance of the static correlations is revealed if one looks at the main virtual transition of the ground state, namely from the highest occupied molecular orbital (HOMO) to the lowest unoccupied molecular orbital (LUMO), for both basis sets (Figure 3), amounting to a correlation energy of the order of 14 eV for the reference CCSD state (17 ppm of the total CCSD energy). For both basis sets, the HOMO and LUMO are mainly linear combinations of orbitals located on the Ni atoms (differing in the sign of their linear combinations) with a strong d character. The same strong static correlations are also found for higher many-body electronic states. Very interesting for our dynamics is the fact that there is a substantial difference in the participation of the metallic d atomic orbitals between molecular orbitals 341/342 and 345, which corresponds to a (partial) metal-oxygen charge transfer when exciting the compound with our laser pulses.

Some of the molecular orbitals participating in the virtual excitations of the ground and the excited manybody triplet states at about 3 eV (345→346 and 341/342→346), calculated with the SARC-ZORA basis set. The difference in the participation of the metallic d orbitals between molecular orbitals 341/342 and 345 corresponds to a (partial) metal-oxygen charge transfer when exciting the compound with our laser pulses. The virtual transition 341/342→346 is also the main contribution to the trap state  at 2.3 eV (see text).
Due to the huge number of molecular orbitals, and in order to better understand the physics behind the correlation energy we also analyze the density of states and the partial density of states of the molecular orbitals at the Hartree-Fock level (Figure 4). Note that although the energies of the one-electron molecular orbitals do not correspond to the excitation energies of our many-body wavefunctions, their analysis gives some insight into the distribution of the electron charges in the compound. One should bear in mind, however, that any charge analysis (e. g., Mulliken or Löwdin analyses) is based on the lossy projection of the one-electron density matrix out of a correlated, multiconfigurational wavefunction, accompanied by the arbitrary division of the overlap electronic population each among pairs of atoms to the participating atoms (e. g., equal division for the Mulliken analysis, or proportional to their electronegativities for the Löwding analysis). Therefore, although the charges often constitute a helpful qualitative tool, they can substantially differ from the formal charges expected from stoichiometry chemistry. Most of the one-electron (i. e., uncorrelated) states around the Fermi level are either d-character Ni orbitals or f-character Dy orbitals. The latter however, contribute with much lower amplitudes to the correlated ground and lower-lying many-body states. Thus, in total the correlation energy mainly stems from the static correlations of the d electrons of the Ni. From a more physical point of view, this also means that altering the local geometry of the Ni atoms (which in turn changes their respective ligand-field splitting) will have a dramatic impact on the energy level of the whole compound and thus change its dynamical behavior. More specifically, further lifting the degeneracies of the d orbitals will increase the excited state energies and decrease the exchange coupling between the four magnetic atoms.

The density of states of the Ni (left), the Dy (middle) and the whole complex (right) with the SARC-ZORA (upper panel) and the WTBS (lower panel) basis set at the Hartree-Fock level. The black, the red and the green curves refer to the total, the d and the f density of states of each atom, respectively. The summation of all electronic density belonging to each category is also given.
The charge and the spin distribution is more or less similar for all many-body states of the coupled cluster calculations with SARC-ZORA. We find a  charge on the ligands (distributed over all the non-metallic atoms),
  on the two Ni atoms, and almost 0 on the two Dy atoms. The spin is completely localized on the ligands. For WTBS the spin localization is similar. The charge distribution is very different, though. We find a positive charge density on the two Dy atoms (
 ) and a negative charge density on the ligands (
 ). There is no charge density on the Ni atoms.
As a first measure of trustworthiness of our quantum chemical calculations, in Figure 5 we compare the theoretical ground state spectrum (at temperatures  K and
K and  K) with the experimentally measured one [the absorption spectra in a wavelength range between 200 and 800 nm were obtained with an UV/Vis/NIR spectrometer Cary 500 (Varian)].

Experimental (in DMF as solvent) and theoretical (without solvent) ground state absorption spectra. The theoretical spectra were calculated with the SARC-ZORA and the WTBS basis sets and at two different temperatures (0 and 300 K). The peaks at around 400 nm (partially) correspond to charge-transfer excitations within the core (cf. Figure 3).
For both basis sets the theoretical spectrum exhibits two peaks. For the coupled cluster calculation with the SARC-ZORA basis set the peaks are shifted to higher energies; weakly for the 305 nm and strongly for 415 nm. In case of WTBS basis set the shifting to shorter wavelength is a bit stronger for the 305 nm peak and much less for the 415 nm peak. The units on the y-axis are in at. un. In fact few dipole allowed transitions are found for the system calculated with SARC-ZORA and even fewer for WTBS. In the experimental spectrum we see two peaks and at least one shoulder. Again, one at a wavelength of 305 nm, the other one at 415 nm. The broadening of the low energy peak towards shorter wavelength could stem from either another electronic transition (shoulder) or a vibrational progression due to the aromatic ring of the ligand. The coupled-cluster calculated spectrum with WTBS is in very good agreement with the experimental data, although it does not fully cover the low-energy tail (i. e., wavelengths being larger than 500 nm), where the SARC-ZORA calculation (at 300 K) adds an important peak.
2.3 Infrared SpectrumHere we present the theoretically calculated vibrational spectrum of the system and compare with the experimental results. The theoretical spectrum is first obtained at the HF level, for which it is possible to calculate analytical derivatives of the total energy with respect to the atomic dislocations (Figure 6).

Experimental (blue line) and theoretically calculated (red line) infrared spectrum of the complex. The theoretical spectrum is at the HF level. The five vertical dashed lines indicate the frequencies which were calculated at the highly correlated CCSD level (cf. Table 1).
After analytically obtaining the normal modes, we use them to numerically calculate the vibration frequencies at the CCSD level of three modes in three different regions, namely in the intermetallic-vibration region (517 cm−1), the mid-range region (1050 cm−1), and at a higher range (3699 cm−1). The single-point energy data thus obtained are fitted to both a quadratic and a cubic polynomial.69 In fact both polynomials give results which can differ quite a lot from the analytic ones (some exemplary normal modes are given in Table 1). This, of course, is a result of the strong correlations in the system, which strongly depend on the exact interatomic distances (notably the static correlations). For example, mode 331, which mainly includes vibrations of two carbon atoms from a benzene ring (no static correlations there), does not differ significantly in the two calculations. Mode 101 on the other hand heavily involves an oxygen atom which bridges a Dy and a Ni metal, and thus is affected by the correlational level of the computational method. Correlations can generally both increase (e. g., mode 101) and decrease (e. g., mode 105) the HF frequencies. Remarkably, mode 245 gets shifted by approximately 150 cm−1 (or even more than 230 cm–1 if one uses a wider interpolation range and a cubic polynomial fitting). The experimentally measured peaks in solid state in KBr, as already reported by Mondal et al.,8 are 3546 m, 3478 s, 3414 s, 3232w, 2924w, 1660s, 1605 s, 1584 m, 1548 m, 1474 s, 1455 s, 1383 s, 1398 m, 1384 m, 1297 m, 1228 s, 1181 s, 1108w, 1032w, 958w, 870w, 819 m, 744 m, 729 m, 685w, 637w, 584w, and 517w cm–1, respectively, were w, m, and s, stand for weak, medium and strong, respectively (Figure 6). Out of those, the peaks at 584, 637, 1181 and 1297 cm–1 nicely match and are therefore tentatively attributed to modes 101, 105, 175 and 245 of Table 1, respectively. Mode 331 probably lies outside the experimentally measured spectrum.
Table 1. Infrared frequencies (in cm−1) calculated with five different methods, (analytically at the HF level, numerically at the CCSD level with a short and a longer range for the single point energy calculations, and the latter two both with a quadratic and a cubic polynomial fitting), as well as previously reported experimental results. Cf. Figure for the complete spectrum at the HF level.mode
HF
Exp.8
#
wide range
short range
quadratic
cubic
quadratic
cubic
101
539.63
598.80
557.83
597.98
–
584
105
567.11
654.76
654.55
654.83
–
637
175
1050.42
1153.64
1544.74
1153.43
–
1181
245
1421.08
1283.23
1281.25
1282.96
1190.02
1297
331
3699.01
3706.63
3706.63
3698.49
3698.39
–
3 DynamicsThe experimental investigation of the dynamics of the complex is performed with transient absorption (TA) spectroscopy. Laser pulses from the Astrella laser system (Coherent) (35 fs pulse duration, 800 nm central wavelength, 1 kHz repetition rate) were split into one part to generate the probe white light in a CaF2 crystal and another part to provide the pump pulse by second harmonic generation from the fundamental (400 nm) or from the output of a non-collinear optical parametric amplifier (NOPA) (350, 320 and 300 nm). Every second pump pulse was chopped (optical chopper, AMETEK), to obtain spectra with and without pump pulse delayed via a computer controlled stage (Thorlabs). After passing the sample, the white light was refracted by a fused silica prism and recorded by a CCD Camera (Series 2000, Si Photodetector, Entwicklungsbüro Stresing). Spectra without pump pulse were subtracted from the pump-induced transient spectra which results in ΔA spectra with a time resolution <100 fs. Data was collected and processed with in-house written Labview programs. All spectra were measured in cuvettes made of fused silica (Suprasil300, Hellma) with 1 mm optical path length at room temperature.
Time resolved spectra in a wavelength range between 350 and 700 nm were measured with an experimental setup described elsewhere.33, 70 The broad stationary absorption spectrum offers a wide pump wavelength range. Therefore, we have chosen 300, 320, 350 and 400 nm. Excitation at 300 nm leads to a spectral broad transient response between 370 and 700 nm (Figure 7, left panel). Within a few ps it converts to a band with a maximum at 480 nm tailing into the red wavelength range. The maximum shifts with time to 460 nm whereby a superposition with the ground state bleach needs to be considered between 350 and 450 nm. This leads to a negative transient response around 410 nm (no fluorescence could be found). Therefore, the apparent maxima are probably red shifted compared to the maximum of the excited state. The ground state is completely recovered within 300 ps. Excitation at longer wavelengths does not significantly change the TA spectra. A comparison is given for 460 nm probe wavelength in Figure 8. A global fit analysis with exponential decay functions reveals three processes with similar time constants for all excitation wavelengths. The amplitudes for the exponential decay functions received from global analysis exemplarily for 300 and 400 nm excitation are given in decay associated spectra (DAS) in Figure 9.

Upper panel: Experimental TA spectra at given delay times after 300 nm excitation. Absorption spectrum is shown in black for comparison. Middle panel: Theoretically calculated differential absorption spectrum, corresponding to an excitation of a 300 nm pump pulse using the WTBS 5d 7f basis set and a Gaussian broadening (standard deviation  ), so that they can be directly compared with the upper panel. (Black line) for mixed populations starting from the triplet electronic states
  , which get populated after about 1 ps. (Red dashed line), for a mixed population starting from the singlet states
  and
and  , which are populated after more than 50 ps due to electronic relaxation. Lower panel: Theoretical difference absorption spectra using the WTBS 5d 7f basis set at two different times of the propagation shown in Figure 10.

Comparison of experimental TA decay at 460 nm probe wavelength after 300 (black), 320 (red), 350 (green) and 400 (blue) nm excitation. Circles: measured data points, lines: fit functions. ΔA values were referenced at 2 ps for better comparison.

Experimental decay associated spectra obtained from global analysis for 300 nm excitation (upper panel) and 400 nm excitation (lower panel). Evaluation of the first time constant is not possible after 300 nm excitation due to artifacts on that time scale. Scattering from the pump pulse after 400 nm excitation hinders analysis in this region.
A first time constant was obtained within few hundred fs (τ1) after 400 nm photoexcitation, which for the 300 nm excitation is masked by artifacts (mainly chirp and group velocity mismatch). A second time constant on the ps range (τ2) is somewhat larger for 400 nm excitation than for 300 nm. The longest time constant was found to be around 70 ps (τ3) (Table 2). No longer-lived components were observed indicating that the system relaxes back to the ground state indicating no significant photo instabilities. It is known for α-Fe2O3 nanoparticles71 and for α-Fe2O3 thin films72 that after O 2p excitation into the conduction band vibrational relaxation as well as trapping into
  states from the Fe occurs on a hundred fs timescale. Subsequent geminal recombination can be observed within few ps whereas the trapped electrons live some tens of ps. In case of NiO thin films, the relaxation dynamics is similar but with an additional long lived (several ns) trap state exists.34 The three step relaxation process can also be found for Fe10Ln10 clusters.3 Considering the relatively close structural absorptive properties, an analogue interpretation is given here. Consequently, we attribute the first time constant τ1 after photoexcitation of the O−Ni unit to vibrational relaxation and trapping processes, τ2 to geminal recombination, and τ3 to the lifetime of the trap states. In molecular systems, the optical transitions are usually dictated by electrons which are close to the Fermi level (i. e., near the HOMO) and contribute substantially to the correlations through virtual excitations (in other words they move “more freely” than the deeper lying stronger “bound” core electrons). Our system, containing two
  and two
  interacting magnetic atoms although not (quasi-)infinitely extended like nanoparticles, it still possesses states of different multiplicities which are inert enough, so that spin-crossover transitions become slower than in other mono-metallic systems, such as Cr(acac)373 or Fe(II) complexes.74-78
300 nm
400 nm
τ1 (ps)
–
0.5
τ2 (ps)
3.6
6.4
τ3 (ps)
76
69
In general, the very-early-time dynamics requires calculations under non-equilibrium conditions and reflects the intramolecular vibrational redistribution (IVR), which takes place after the initial Franck-Condon excitation. This, although very interesting, goes well beyond the scope of this work, which focuses on the electronic dynamics. Furthermore, the wavelength dependence of the IVR is still a challenging task (under debate in many systems and often not known). Here, solid state measurements or better solvents could give access to the earliest events like vibrational relaxation and trapping. This technique, however, would remain to future studies and is currently not available. The system does not relax to the ground state distribution (Boltzmann distribution) on the electronic time scale (τ2). Only on longer time scales (τ3), when the phononic contributions become significant, a complete thermalization occurs.
As a first attempt to theoretically explain the observed behavior we look at the differential absorption spectra of the excited states, which are most probably populated by the 300 nm (4.13 eV) pump pulse. For both basis sets we find the substates of two triplet states at this energy region. Here, we exemplarily mention the WTBS results, namely two triplet states from  to
to  , with energies from 2.37 eV (523 nm) up to 2.83 eV (438 nm) with very similar electronic absorption spectra. Thus the most pronounced peak at 2.68 eV (462 nm) which is experimentally observed after about 1 ps (Figure 7, left panel), corresponds to excitations from states
留言 (0)