This study presents the 2014 nationwide cancer statistics in Korea, including cancer incidence, survival, prevalence, and mortality.
Materials and MethodsCancer incidence data from 1999 to 2014 was obtained from the Korea National Cancer Incidence Database and followed until December 31, 2015. Mortality data from 1983 to 2014 were obtained from Statistics Korea. The prevalence was defined as the number of cancer patients alive on January 1, 2015, among all cancer patients diagnosed since 1999. Crude and age-standardized rates (ASRs) for incidence, mortality, prevalence, and 5-year relative survivals were also calculated.
ResultsIn 2014, 217,057 and 76,611 Koreans were newly diagnosed and died from cancer respectively. The ASRs for cancer incidence and mortality in 2014 were 270.7 and 85.1 per 100,000, respectively. The all-cancer incidence rate has increased significantly by 3.4% annually from 1999 to 2012, and started to decrease after 2012 (2012-2014; annual percent change, –6.6%). However, overall cancer mortality has decreased 2.7% annually since 2002. The 5-year relative survival rate for patients diagnosed with cancer between 2010 and 2014 was 70.3%, an improvement from the 41.2% for patients diagnosed between 1993 and 1995.
ConclusionAge-standardized cancer incidence rates have decreased since 2012 and mortality rates have also declined since 2002, while 5-year survival rates have improved remarkably from 1993-1995 to 2010-2014 in Korea.
Key words: Incidence, Survival, Prevalence, Mortality, Neoplasms, Korea
Introduction Cancer is a major life-threatening disease worldwide. Approximately 14.1 million patients were newly diagnosed with cancer and 8.2 million people died from cancer in 2012 worldwide [1]. The global burden of cancer is expected to grow rapidly due to aging population [2]. In Korea, cancer accounts for one in four deaths and more than 200,000 new cancer cases were diagnosed in 2013 [3].The number of cancer incidences and deaths are expected to increase with an aging population and westernized lifestyles [4]. Additionally, the economic burden of cancer in Korea increased approximately 1.8-fold, from $11,424 to $20,858 million, between 2000 and 2010 [5].In this context, cancer statistics are the most important indicator to assess the national cancer burden and form cancer prevention and control strategies. This article aims to provide nationwide cancer statistics including incidence, survival, prevalence, and mortality in 2014.
Materials and Methods 1. Data sources The Korea Central Cancer Registry (KCCR) was established by the Ministry of Health and Welfare in 1980 as a nationwide hospital-based cancer registry. Since 1999, the KCCR has collected cancer incidence data nationwide by integrating a hospital-based KCCR database with data from regional cancer registry programs. The KCCR currently provides the nationwide cancer incidence, survival, and prevalence statistics annually [6]. The KCCR built the Korea National Cancer Incidence Database (KNCI DB) from hospitals, 11 population-based registries, and additional medical chart reviews. The KNCI DB contains information regarding age, sex, region, date of diagnosis, primary cancer site, histological type, most valid diagnostic method, and SEER stage. The completeness of cancer incidence data for 2014 was estimated to be 97.8% based on the method proposed by Ajiki et al. [7]. The mid-year population and cancer mortality data from 1983 to 2014 were obtained from Statistics Korea [8]. To ascertain vital status and to calculate survival and prevalence, the KNCI DB was linked to mortality data and population registration data from Ministry of the Interior. 2. Classification All incidence cases were registered according to the International Classification of Diseases for Oncology, 3rd edition [9] and converted to the International Classification of Diseases, 10th edition (ICD-10) [10]. The mortality cases were registered according to ICD-10. All cancer cases were reported based on the 24 cancer types. 3. Statistical analyses Rates were expressed as crude and age-standardized rates (CR and ASR, respectively) per 100,000 individuals. The crude rate was calculated as the total number of incidence/ mortality cases divided by the mid-year population of the specified years. The ASR is a weighted average of the age-specific rates, where the weights are the proportions of persons in the corresponding age groups of a standard population [11]. In this report, ASRs were calculated using Segi’s world standard population [12]. The cumulative risk of developing cancer from birth to life expectancy was calculated using cumulative rates; that is, the sum of the age-specific rates from birth to life expectancy, as follows [13]. Cumulative risk of developing cancer from birth to life expectancy =100×1-e-cumulative rate100 Trends in incidence/mortality rates were summarized as an annual percentage change (APC) by using a Joinpoint regression. APC is the average percentage change of rates and is calculated as follows [11]: APC=Ry+1-RyRy×100=(eb1-1)×100, where log(Ry)=b0+b1y,
log(Ry) is the natural log transformed age standardized rates.
y=year, b0=intercept,b1=slope
The survival duration for each cancer case was determined as the interval between the date of initial diagnosis and the date of death, date of loss of follow-up, or closing date for follow-up. The 5-year relative survival rates were calculated as the ratios of the observed survival of the cancer patients to the expected survival of the general population, which was derived from the standard life table provided by Statistics Korea. Trends in 5-year relative survival rates were evaluated as percentage differences in 5-year relative survival rates from 1993-1995 and 2010-2014. Relative survival rates were calculated using the Ederer II method [14] with some minor corrections, based on an algorithm by Paul Dickman [15].Prevalent cases were defined as the number of cancer patients alive on January 1, 2015 among all cancer patients diagnosed between 1999 and 2014. Limited-duration prevalences were calculated using SEER*Stat software. Any p-values less than 0.05 were considered statistically significant. SEER*Stat 8.2.1 (National Cancer Institute, Bethesda, MD), Joinpoint 4. 1. 1 (National Cancer Institute), and SAS 9.3 (SAS Institute, Cary, NC) were used in this report.
Selected Findings 1. Incidence A total of 217,057 cases were newly diagnosed with cancer during the study period (Table 1). Of these cases, 112,882 (52.0%) were men and 104,175 (48.0%) were women. Thyroid cancer was the most commonly diagnosed cancer in 2014, followed by stomach, colorectal, lung, and breast cancer in 2014. The overall cumulative risk of developing cancer from birth to life expectancy was 36.2%. However, the cumulative risk of developing cancer from birth to life expectancy was higher in men (38.7%) than in women (33.1%) (data not shown). The total CR and ASR for overall cancer incidences in 2014 were 427.6 and 270.7 per 100,000, respectively (Table 2). According to sex, CRs for all sites combined were 444.9 per 100,000 in men and 410.3 per 100,000 in women. The ASRs were 302.2 and 255.5 per 100,000 in men and women, respectively. Stomach cancer (CR, 79.2 per 100,000) was the most common cancer in men, followed by lung (CR, 66.0 per 100,000), colorectal (CR, 63.8 per 100,000), liver (CR, 47.5 per 100,000), and prostate cancer (CR, 38.6 per 100,000). These five cancers accounted for 66.3% of newly diagnosed cases in men during the study period. In contrast, thyroid cancer (CR, 97.0 per 100,000) was the most common cancer among women, followed by breast (CR, 72.1 per 100,000), colorectal (CR, 42.5 per 100,000), stomach (CR, 38.5 per 100,000), and lung cancer (CR, 28.7 per 100,000). These five cancers accounted for 67.9% of cases in women. 2. Mortality In 2014, the total number of deaths from cancer was 76,611, accounting for 28.6% of all deaths (Table 3). Expressed based on sex, 62.5% and 37.5% of cancer deaths occurred in men and women, respectively (Table 1). The total CR and ASR for cancer deaths were 150.9 and 85.1 per 100,000, respectively, in 2014 (Table 4). The total CR and ASR for cancer deaths per 100,000 were higher among men (CR, 188.7; ASR, 125.8) than in women (CR, 113.2; ASR, 55.6).According to the cancer sites, lung cancer (CR, 50.4 per 100,000) was the leading cause of death in men, followed by liver (CR, 34.0 per 100,000), stomach (CR, 22.7 per 100,000), colorectal (CR, 18.8 per 100,000), and pancreatic cancer (CR, 10.8 per 100,000). The top five causes of deaths from cancer in women included lung (CR, 18.3 per 100,000), colorectal (CR, 14.1 per 100,000), stomach (CR, 12.4 per 100,000), liver (CR, 11.6 per 100,000), and pancreatic cancer (CR, 9.3 per 100,000).
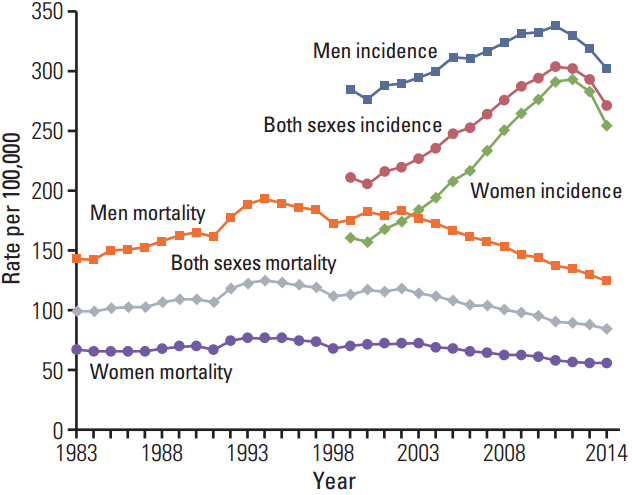
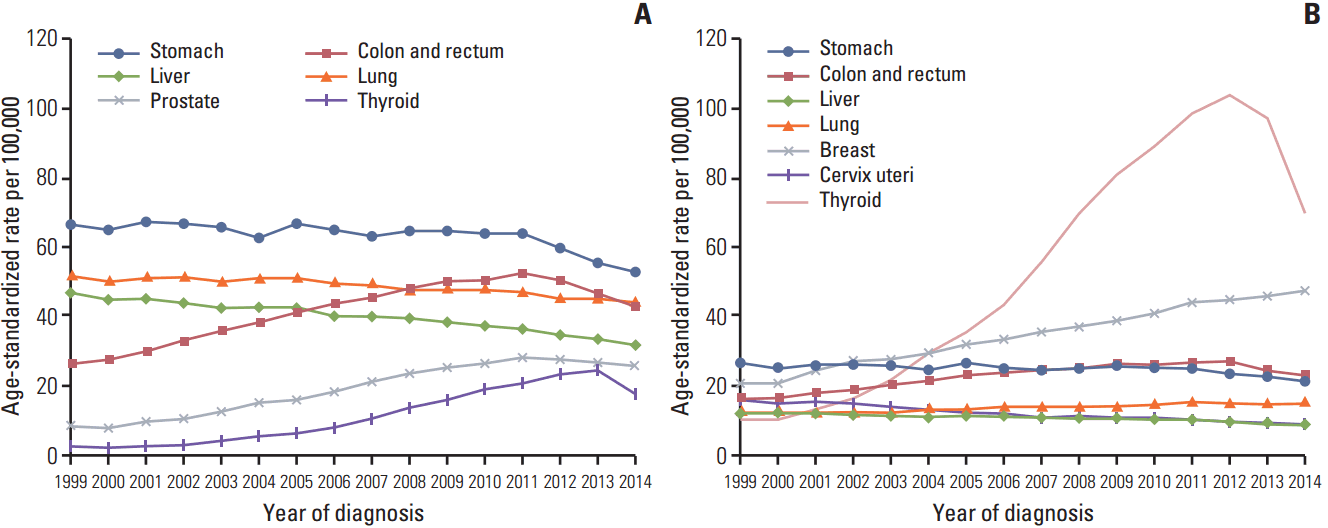
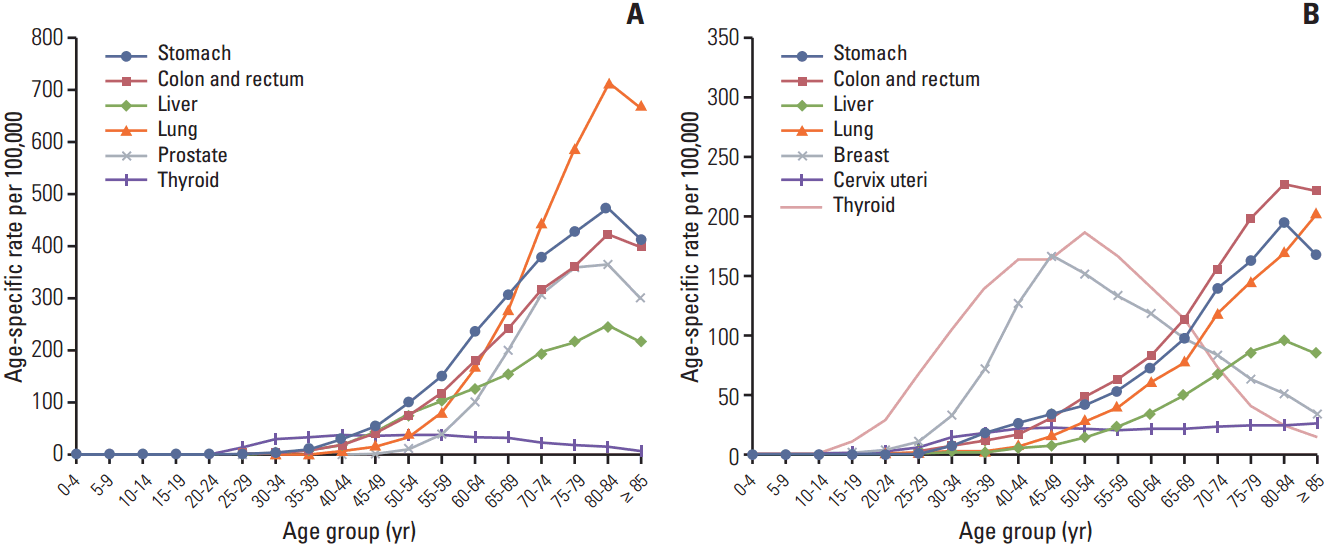
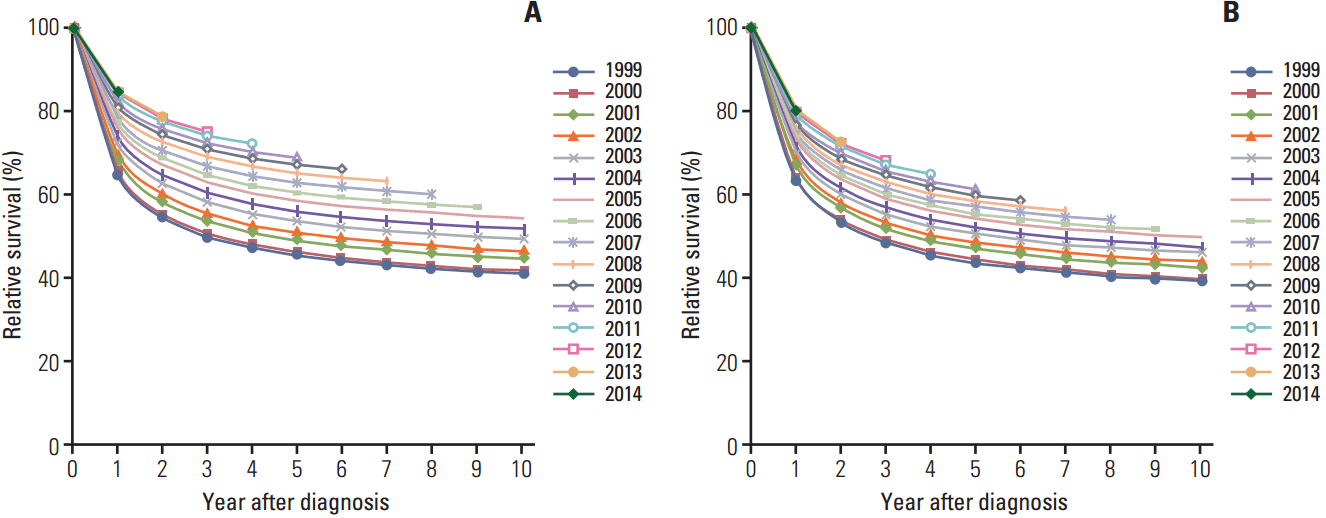
3. Trends in cancer incidence and mortality Fig. 1 shows trends in cancer incidence and mortality from 1983 to 2014. The ASR for all-cancer incidence increased by 3.4% annually from 1999 to 2012, and then began to decrease from 2012 to 2014 (APC, –6.6%) (Table 5, Fig. 1). Cancers in stomach, colorectum, lung and thyroid started to decrease around 2011 (Table 5, Fig. 2). Especially, ASR for thyroid cancer has increased rapidly 22.4% from 1999 to 2011, but then decreased swiftly 10.8% annually starting in 2011. Incidence of breast cancer has increased constantly throughout the period, but APC was slowed from 2005. Conversely, the incidence rates of cervix and liver showed constant decrease for the whole period. The incidence rate for liver cancer has started to decrease since 1999. After 2011, decreasing rate for liver cancer was more steepen. The ASR for all-cancer mortality rate has been increased until 2002 (Table 6, Fig. 1). After that year, it began to decrease (2002-2014; APC, –2.7%). Same patterns were shown in men and women. Most cancer sites, including lung, liver, colorectum, gallbladder, leukemia, brain and central nervous system, cervix uteri, and thyroid started to decrease in the early 2000s. However, cancers in stomach, larynx, testis, bladder, and non-Hodgkin lymphoma decreased starting in 1999 (Table 6, Fig. 3). Cancers in the pancreas, breast, and prostate showed constant increasing trends for the whole period. 4. Age-specific incidence rates Leukemia was the most commonly diagnosed cancer among children between 0 and 14 years of age. Thyroid cancer was the most common cancer among adolescents and young adults between 15 and 34 years of age (Table 7). For men, the incidence rate of cancer increased until age 70 (Fig. 4A). Stomach cancer was the most commonly diagnosed cancer among men 35 to 64 years old, while lung cancer was the most common among men 65 and over. In contrast, thyroid cancer was most commonly diagnosed among women 35 to 64 years old, while colorectal cancer was the most common among women 65 and older. Thyroid and breast cancer showed an inverted U-shaped incidence rates by age (Fig. 4B). 5. Survival rates The 5-year relative survival rates for all cancer combined improved remarkably in both sexes, from 41.2% in 1993-1995 to 70.3% in 2010-2014 (Table 8, Fig. 5A). After excluding thyroid cancer, the 5-year relative survival rates for all cancer still increased from 1993 to 2014 (Fig. 5B).The 5-year relative survival rate during 2010-2014 for all cancer combined was 62.2% in men and 78.2% in women, respectively. The 5-year relative survival rate for thyroid cancer was over 100%, while the 5-year relative survival rates for testis, prostate, and breast cancer were over 90% in 2010-2014 for both sexes, respectively. However, the 5-year relative survival rate for pancreatic cancer was only 10.1% in both sexes in 2010-2014.
When compared to the 5-year relative survival rate for men in 1993-1995, prostate cancer diagnosed from 2010 to 2014 showed the most outstanding improvement, followed by stomach cancer, leukemia, lip/oral cavity/pharynx and liver cancer. Among women, stomach cancer diagnosed during 2010-2014 showed the greatest improvement in 5-year relative survival rates compared to those between 1993 and1995, followed by leukemia, non-Hodgkin lymphoma, colorectal, and liver cancer.
6. Prevalence rates A total of 1,464,935 cancer prevalent cases were identified on January 1, 2015 (Table 1). Of these cases, 645,332 (44.1%) were men and 819,603 (55.9%) were women. The crude and age-standardized prevalence rates for cancer overall were 2,885.8 per 100,000 individuals and 1,837.6 per 100,000 individuals for both sexes, respectively, in 2014 (Table 9).The five most common cancers for men were stomach (CR, 615.8 per 100,000), colorectal (CR, 477.1 per 100,000), prostate (CR, 245.3 per 100,000), thyroid (CR, 215.6 per 100,000), and liver cancer (CR, 170.2 per 100,000). In contrast, thyroid cancer was most common in women (CR, 1,076.8 per 100,000), followed by breast (CR, 623.5 per 100,000), colorectal (CR, 320.0 per 100,000), stomach (CR, 310.8 per 100,000), and cervix uteri cancer (CR, 178.0 per 100,000).
Analysis of the period after cancer diagnosis revealed that thyroid (20.1%) cancer was the most prevalent cancer within two years after diagnosis, followed by stomach (14.1%) and colorectal cancer (13.1%) (Fig. 6). Thyroid cancer (27.2%) was most prevalent for 2-5 years, followed by stomach (14.8%) and colorectal cancer (13.9%). After 5 years, thyroid cancer (20.4%) was the most prevalent cancer, followed by stomach (18.0%) and colorectal cancer (14.1%). Conflicts of InterestConflict of interest relevant to this article was not reported.
AcknowledgmentsThis work was supported by a research grant from the National Cancer Center (No. 1610200), Republic of Korea. The authors are indebted to the Korea Central Cancer Registry (KCCR)-affiliated hospitals, non-KCCR-affiliated hospitals, the National Health Insurance Service and Statistics Korea for data collection.
Fig. 1.Annual age-standardized cancer incidence and death rates by sex for all sites from 1983 to 2014 in Korea. Age standardization was based on the Segi’s world standard population.
 Fig. 2.
Trends in age-standardized incidences of selected cancers by sex from 1999 to 2014 in Korea. (A) Men. (B) Women. Age standardization was based on the Segi’s world standard population.
 Fig. 3.
Annual age-standardized cancer mortalities of selected cancers by sex from 1983 to 2014 in Korea. (A) Men. (B) Women. Age standardization was based on the Segi’s world standard population.
 Fig. 4.
Age-specific incidence rates of common cancers for 2014 in Korea. (A) Men. (B) Women
 Fig. 5.
Trends in relative survival by year of diagnosis from 1999 to 2014. (A) All sites for both sexes. (B) All sites except thyroid cancer for both sexes.
 Fig. 6.
Prevalence of common cancer sites by time period after cancer diagnosis. Prevalent cases were defined as the number of cancer patients alive on January 1, 2015 among all cancer patients diagnosed between 1999 and 2014.
 Table 1.
Cancer incidence, deaths, and prevalence by sex in Korea, 2014
Site/Type New cases Deaths Prevalent casesa) Both sexes Men Women Both sexes Men Women Both sexes Men Women All sites 217,057 112,882 104,175 76,611 47,869 28,742 1,464,935 645,332 819,603 Lip, oral cavity, and pharynx 3,191 2,261 930 1,097 824 273 19,687 13,253 6,434 Esophagus 2,344 2,131 213 1,540 1,407 133 8,496 7,666 830 Stomach 29,854 20,087 9,767 8,917 5,767 3,150 235,172 156,264 78,908 Colon and rectum 26,978 16,182 10,796 8,338 4,760 3,578 202,295 121,057 81,238 Liver 16,178 12,058 4,120 11,566 8,616 2,950 57,691 43,192 14,499 Gallbladderb) 5,576 2,838 2,738 3,931 1,966 1,965 17,061 8,749 8,312 Pancreas 5,948 3,191 2,757 5,116 2,752 2,364 8,472 4,539 3,933 Larynx 1,111 1,048 63 410 371 39 9,262 8,714 548 Lung 24,027 16,750 7,277 17,440 12,785 4,655 63,460 40,098 23,362 Breast 18,381 77 18,304 2,271 17 2,254 158,916 622 158,294 Cervix uteri 3,500 - 3,500 960 - 960 45,189 - 45,189 Corpus uteri 2,214 - 2,214 264 - 264 18,381 - 18,381 Ovary 2,413 - 2,413 1,021 - 1,021 16,161 - 16,161 Prostate 9,785 9,785 - 1,667 1,667 - 62,256 62,256 - Testis 259 259 - 14 14 - 2,570 2,570 - Kidney 4,471 3,108 1,363 944 665 279 31,610 21,404 10,206 Bladder 3,949 3,182 767 1,354 1,016 338 28,559 23,293 5,266 Brain and CNS 1,725 917 808 1,285 716 569 9,500 4,898 4,602 Thyroid 30,806 6,174 24,632 346 84 262 328,072 54,696 273,376 Hodgkin lymphoma 278 167 111 70 38 32 2,318 1,471 847 Non-Hodgkin lymphoma 4,948 2,766 2,182 1,574 910 664 31,553 16,984 14,569 Multiple myeloma 1,396 758 638 864 473 391 4,811 2,513 2,298 Leukemia 3,080 1,771 1,309 1,671 921 750 17,151 9,534 7,617 Other and ill-defined 14,645 7,372 7,273 3,951 2,100 1,851 86,292 41,559 44,733 Table 2.Crude and age-standardized cancer incidence rates by sex in Korea, 2014
Site/Type Crude incidence rate per 100,000 Age-standardized incidence rate per 100,000a) Both sexes Men Women Both sexes Men Women All sites 427.6 444.9 410.3 270.7 302.2 255.5 Lip, oral cavity, and pharynx 6.3 8.9 3.7 4.0 6.1 2.3 Esophagus 4.6 8.4 0.8 2.8 5.5 0.4 Stomach 58.8 79.2 38.5 35.8 52.7 21.4 Colon and rectum 53.1 63.8 42.5 31.9 42.6 23.0 Liver 31.9 47.5 16.2 19.4 31.4 8.6 Gallbladderb) 11.0 11.2 10.8 6.2 7.4 5.2 Pancreas 11.7 12.6 10.9 6.7 8.4 5.4 Larynx 2.2 4.1 0.2 1.3 2.7 0.1 Lung 47.3 66.0 28.7 27.2 43.7 14.9 Breast 36.2 0.3 72.1 24.0 0.2 47.7 Cervix uteri 6.9 - 13.8 4.6 -
留言 (0)