
記住我


Sodium–glucose cotransporter 2 inhibitors (SGLT2i) inhibit the absorption of glucose from the proximal tubule of the kidney and, hence, cause glycosuria. They were initially developed for the treatment of diabetes. In addition to improving glycemic control, beneficial effects of these agents on cardiovascular and renal outcomes have been reported in large randomized clinical trials1-6.
SGLT2i are also reported to increase hemoglobin levels in multiple clinical trials7-11. The beneficial effects of SGLT2i on cardiovascular events seem to be at least partially mediated by their improvement of anemia12. However, participants in the clinical trials were relatively stable patients with good adherence. Additionally, these clinical trials excluded patients with active malignancies or advanced chronic kidney disease7-11. It is unknown whether SGLT2i improve anemia in real clinical practice in diabetes patients with various comorbidities and reduced kidney function.
In the present study, we investigated the association between the use of SGLT2i and hemoglobin levels or anemia in a cross-sectional study and a case–control study among all diabetes patients in an outpatient setting.
MATERIALS AND METHODS Participants Inclusion criteriaThose with diabetes who visited the outpatient clinic of the Department of Endocrinology and Diabetes or Department of Nephrology at Nagoya City University Hospital from 1 January 2019 to 31 August 2020 were included in the study. Diabetes was defined as either taking glucose-lowering agents or a hemoglobin A1c  6.5%.
6.5%.
Those without data for estimated glomerular filtration rate (eGFR) or hemoglobin levels during the study period were excluded.
Study designThe present study was a retrospective observational study. The study protocol and waiver of consent were approved by Nagoya City University Graduate School of Medical Sciences and Nagoya City University Hospital Institutional Review Board, and the study was carried out in accordance with the Helsinki Declaration. Age, sex, smoking status, laboratory data and prescriptions were automatically extracted from electronic medical records. Other demographic details were obtained by chart review.
Exposure of interestThe exposure of interest was the use of SGLT2i. The SGLT2i available during the study period at Nagoya City University Hospital were ipragliflozin, empagliflozin, canagliflozin, dapagliflozin, tofogliflozin and luseogliflozin. Of note, during the study period, SGLT2i were not approved for patients without diabetes in Japan.
OutcomesOutcomes were the patient’s hemoglobin level or anemic status, defined as hemoglobin <120 g/L for men and <110 g/L for women or the use of erythropoiesis-stimulating agents (ESAs). The ESAs available at Nagoya City University Hospital during the study period were darbepoetin and epoetin β pegol. Of note, during the study period, hypoxia-inducible factor-prolyl hydroxylase (HIF-PH) inhibitors were not approved for patients with non-dialysis-dependent chronic kidney disease (CKD) in Japan. When a patient visited our clinics multiple times during the study period, the data on the last visit were used for the cross-sectional analyses, and the data on the last visit were used to define cases versus controls for the case–control study.
Statistical analysisThe data are shown as the number (%) or median (interquartile range). Categorical variables were compared using the χ2-test, and continuous variables were compared using the Mann-Whitney U-test. Glycated albumin levels were converted to hemoglobin A1c using the following formula13: hemoglobin A1c (%) = 0.216 × glycated albumin (%) + 2.978. The eGFR was calculated by the formula developed for the Japanese population14. For the cross-sectional analyses, non-linear or logistic regression models were fitted with restricted cubic splines to investigate the association between hemoglobin levels or the probability of anemia and eGFR among users and non-users of SGLT2i. The data were adjusted for age, sex, history of smoking, types of diabetes (type 1 or type 2), hospitalization during a study period, diagnosis of malignancy, and the use of angiotensin converting enzyme inhibitors and or angiotensin receptor blockers, dosage of iron supplementation, average monthly dose of darbepoetin or epoetin β pegol, mean corpuscular volume (MCV), mean corpuscular hemoglobin (MCH), mean corpuscular hemoglobin concentration (MCHC), red cell distribution width (RDW), platelet counts and white blood cell counts. The data for ferritin and transferrin saturation were available for only a small portion of participants, so MCV, MCHC, MCH and RDW were used instead as assessments of iron status. Additional adjustment for duration of diabetes, the presence of retinopathy, dipstick proteinuria levels as a categorical variable and C-reactive protein levels (log-transformed) were also carried out. C-reactive protein levels and urine dipstick proteinuria levels were included in a separate model as the number of participants with both data were small. For the case–control study, cases (with anemia as defined above) and controls were matched 1:1 by age within 5 years, sex and eGFR within 1 mL/min/1.73 m2. Associations between the use of SGLT2i until the last visit and cases (anemia) were analyzed using conditional logistic regression. The data were further adjusted for the duration of diabetes, body mass index, history of smoking (missing data were treated as a separate category), comorbidities (including active or previous malignancy), medications and hemoglobin A1c level nearest the SGLT2i start time. Active malignancy was defined as treatment for malignancy (including surgery, radiation and chemotherapy) within 3 months or the presence of malignancy (before treatment, under observation or under best supportive care). Previous malignancy was defined as the presence of malignancy at any time before the last visit (those with active malignancy were also included). Missing values for body mass index and CRP were imputed by multiple imputation by a chained equation using predictive mean matching. Five imputed datasets were created. The variables included in the model were age, sex, history of smoking, cardiovascular morbidities, active and previous malignancy, the use of chemotherapy, antihypertensives, antidiabetic medications, statins, aspirin, white blood cell counts, hemoglobin levels, and platelet counts.
The following analyses were also carried out. Changes in hemoglobin levels after initiation of SGLT2i were compared with temporary changes in hemoglobin levels among non-users who were followed up more than a year. Propensity scores for SGLT2i use were estimated by a logistic regression model. Variables included in the model were age, sex, an interaction term for age and sex, baseline eGFR, baseline hemoglobin levels, MCV, MCHC, MCH, platelet counts, RDW, history of smoking, the use of antidiabetic medications and the average dose of ESA. SGLT2i users and non-users were matched on the logit of propensity scores (±0.25 SD). Baseline eGFR and hemoglobin levels were defined as those before and closest to the initiation of the SGLT2i for SGLT2i users and the first measurements of these values during the study period for SGLT2i non-users. Adjusted mean values and adjusted mean differences in hemoglobin levels at 3, 6 and 12 months were estimated by analysis of covariance with baseline hemoglobin levels as a covariate. In addition, among SGLT2i users, variables associated with an increase in hemoglobin levels, defined as an increase in hemoglobin more than the mean change in hemoglobin at 6 months after initiation of SGLT2i, were examined by logistic regression analysis. Association between increase in hemoglobin at 6 months and baseline hemoglobin levels were examined by restricted cubic spline analyses. Statistical analyses were carried out using Stata version 15 (StataCorp, College Station, TX, USA).
RESULTS Patient characteristicsAmong 5,111 patients who visited the Department of Nephrology or the Department of Endocrinology and Diabetes at Nagoya City University Hospital during the study period, 2,063 patients had diabetes after exclusion of 158 with missing data for eGFR or hemoglobin (Figure S1). Among those with diabetes, 723 were taking an SGLT2i, and 581 had anemia. The most commonly used SGLT2i was canagliflozin followed by dapagliflozin and tofogliflozin (Figure S2). The demographics of patients with diabetes are shown in Table 1. SGLT2i users were significantly younger. The proportion of men was significantly higher, and the proportion of patients taking darbepoetin was significantly lower among SGLT2i users. The estimated GFR, proportion of patients with a history of smoking and proportion of patients taking iron supplementation were not significantly different between SGLT2i users and non-users. MCV, MCH and RDW were significantly lower among SGLT2i users.
Table 1. Demographics of patientsNo SGLT2 inhibitors
(n = 1,340)
SGLT2 inhibitors
(n = 723)
P Age (years) 72.0 (61.5–79.0) 64.0 (52.0–74.0) <0.001 Male sex 769 (57.4) 460 (63.6) 0.006 Duration of diabetes (years)10 (2–19)
n = 1,164
10 (4–17)
n = 644
0.24 Type 2 diabetes 1,228 (91.6) 701 (97.0) <0.001 Retinopathy286 (36.9)
n = 776
202 (39.0)
n = 518
0.44 Malignancy 612 (54.7) 245 (33.9) <0.001 Hospitalization during a study period 811 (60.5) 413 (57.1) 0.13 Smoking145 (33.8)
n = 429
89 (39.6)
n = 225
0.32 eGFR (mL/min/1.73 m2) 63.1 (44.6–80.3) 63.7 (41.5–81.7) 0.98 eGFR >60 735 (54.8) 401 (55.5) eGFR >30 and ≤60 434 (32.4) 220 (30.4) eGFR >15 and ≤30 72 (5.4) 66 (9.1) eGFR ≤15 99 (7.4) 36 (5.0) Dipstick proteinuria Negative 367 (51.8) 281 (57.8) 0.01 (+/−) 138 (19.5) 63 (13.0) (+) 100 (14.1) 52 (10.7) (2+) 67 (9.4) 60 (12.3) (3+) 37 (5.2) 30 (6.2) n = 709 n = 486 Use of iron supplementation 82 (6.1) 53 (7.3) 0.33 Use of epoetin β pegol 47 (3.5) 38 (5.3) 0.07 Use of darbepoetin 35 (2.6) 4 (0.6) 0.003 Use of ACE-I/ARB 426 (31.8) 358 (49.5) <0.001 MCV (fL) 93.3 (89.8–96.8) 92.3 (89.2–95.7) <0.001 MCHC (%) 33.3 (32.8–33.7) 33.2 (32.8–33.7) 0.82 MCH (pg) 31.0 (29.8–32.2) 30.8 (29.6–32.0) 0.001 RDW (%) 46.4 (43.8–50.3) 45.3 (42.9–48.1) <0.001 Platelet (×109/L) 224 (178–270) 223 (183–274) 0.60 White blood cell (×109/L) 6.2 (5.0–7.9) 6.5 (5.0–7.9) 0.02 C-reactive protein (mg/L)2.6 (0.7–13.7)
n = 686
1.6 (0.6–7.0)
n = 279
0.003 Ferritin (μg/L)135 (79–236)
n = 104
120 (62–202)
n = 81
0.23 Transferrin saturation (%)28 (21–36)
n = 81
28.5 (21.5–35.5)
n = 84
0.60 HbA1c (mmol/mol) (%)53 (47–62)
[7.1 (6.5–7.9)]
( n = 1,239)
56 (48–65)
[7.3 (6.6–8.1)]
(n = 705)
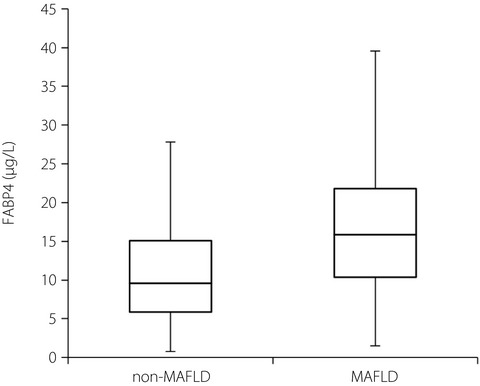
0.01 Data are shown as n (%) or median (interquartile range). P-values were by the χ2-test or Mann-Whitney U-test. When some of the data are missing, the numbers of available data are shown in parentheses. ACE-I, angiotensin-converting enzyme inhibitors; ARB, angiotensin receptor blockers; eGFR, estimated glomerular filtration rate; HbA1c, hemoglobin A1c; MCH, mean corpuscular hemoglobin; MCHC, mean corpuscular hemoglobin concentration; MCV, mean corpuscular volume; RDW, red cell distribution width; SGLT2, sodium–glucose cotransporter 2. Cross-sectional analysisHemoglobin levels and the probability of anemia estimated by restricted cubic spline analysis for SGLT2i users and non-users are shown in Figure 1. The hemoglobin levels of SGLT2i users were higher at an eGFR above approximately 15 mL/min/1.73 m2, and the probability of anemia was lower at an eGFR above approximately 30 mL/min/1.73 m2. Subgroup analyses showed that the use of SGLT2i was associated with higher hemoglobin levels irrespective of the history of malignancy (P for interaction 0.67) or recent hospitalization (P for interaction 0.48; Figures S3 and S4). Further adjustment for duration of diabetes, the presence of retinopathy, proteinuria or C-reactive protein levels did not change the results significantly (Figure S5).

Relationship between (a) estimated glomerular filtration rate (eGFR) and hemoglobin levels and (b) probability of anemia modeled by restricted cubic splines (cross-sectional analyses). The data were adjusted for age, sex, history of smoking, types of diabetes (type 1 or type 2), history of hospitalization during a study period, diagnosis of malignancy, use of angiotensin converting enzyme inhibitors and/or angiotensin receptor blockers, use of iron supplementation, average monthly dose of erythropoiesis stimulating agents, mean corpuscular volume, mean corpuscular hemoglobin concentration, mean corpuscular hemoglobin, red cell distribution width, white blood cell counts, and platelet counts. Anemia was defined as hemoglobin <120 g/L for men and hemoglobin <110 g/L for women or the use of erythropoiesis-stimulating agents. SGLT2i, sodium-glucose cotransporter 2 inhibitors.
Case–control studyA total of 197 cases and 197 controls were matched by age, sex and eGFR. The demographics of cases and controls are shown in Table S1. Age, sex and eGFR were well matched. Body mass index was significantly lower among cases. The proportion of patients with previous or active malignancy or who were on chemotherapy or diuretics was significantly higher among cases. The proportion of patients taking SGLT2i, biguanides, glucagon-like peptide-1 agonists or statins was significantly lower among cases. The duration of diabetes, the number of cardiovascular comorbidities and the use of other antihypertensives or glucose-lowering agents were not significantly different. The use of an SGLT2i was associated with a significantly lower incidence of anemia (odds ratio 0.35, 95% confidence interval [CI] 0.21–0.58; Table 2) in univariate analysis. There might be potential indication biases. For example, those with malignancy and poor appetite were unlikely to be prescribed an SGLT2i, and they were more likely to have anemia. In contrast, obese patients were more likely to be prescribed an SGLT2i for weight loss, and they were more likely to have obstructive sleep apnea and high hemoglobin levels.
Table 2. Association between the use of sodium–glucose cotransporter 2 inhibitors and anemia (case–control analyses) Odds ratio (95% confidence interval) Univariate 0.35 (0.21–0.58) Model 1 0.28 (0.10–0.81) Model 2 0.22 (0.05–0.94) Analysis limited to those with eGFR <60 mL/min/1.73 m2 0.28 (0.14–0.56) Analysis limited to those with eGFR <45 mL/min/1.73 m2 0.30 (0.12–0.74) The data were analyzed using conditional logistic regression. Anemia was defined as hemoglobin <120 g/L for men and <110 g/L for women or the use of erythropoiesis stimulating agents. Model 1: the data were adjusted for duration of diabetes, body mass index, smoking, hypertension, congestive heart failure, coronary artery disease, cerebrovascular disease, peripheral arterial disease, history of malignancy, active malignancy, chemotherapy, angiotensin converting enzyme inhibitors, angiotensin receptor blockers, β-blockers, diuretics, calcium channel blockers, statin, aspirin, dipeptidyl peptidase-4 inhibitor, biguanides, glucagon-like peptide-1 agonist, sulfonylurea, α-glucosidase inhibitors, thiazolidinediones, glinides and insulin. Model 2: the data were adjusted for variables in model 1, mean corpuscular volume, mean corpuscular hemoglobin concentration, mean corpuscular hemoglobin, red cell distribution width, white blood cell counts and platelet counts. eGFR, estimated glomerular filtration rate.Adjusting for potential confounders, including malignancy and body mass index, did not substantially change the results (odds ratio 0.28, 95% CI 0.10–0.81; Table 2). Further adjustment for MCV, MCHC, MCH, RDW, white blood cell counts and platelet counts did not change the results substantially (Table 2). Limiting the analysis to those with eGFR <60 mL/min/1.73 m2 or eGFR <45 mL/min/1.73 m2 yielded similar results (Table 2). Further adjustment for CRP levels (log-transformed) in the imputed datasets did not change the effect size of SGLT2i use significantly (data not shown).
Propensity score-matched analysesThere were 688 participants (262 users and 426 non-users of SGLT2i) who were followed up more than a year and who had data on hemoglobin levels before and after the initiation of the SGLT2i (for SGLT2i users) or underwent hemoglobin measurements more than once (for SGLT2i nonusers). Among them, 98 users and 98 nonusers of SGLT2i were matched by propensity score. The baseline characteristics for the propensity score-matched cohort were well matched (Table S2). The changes in hemoglobin levels among the propensity score-matched cohort are shown in Table 3. Hemoglobin levels gradually declined among non-users of SGLT2i, whereas hemoglobin levels gradually increased among users of SGLT2i and plateaued at 6 months. The adjusted mean differences in hemoglobin levels were 5.0 (95% CI 1.0–8.0), 7.0 (95% CI 3.0–10.0) and 7.0 (95% CI 4.0–11.0) g/L at 3, 6 and 12 months, respectively (Table 3). Changes in hemoglobin levels for those with eGFR ≤60 mL/min/1.73 m2 and >60 mL/min/1.73 m2 are also shown in Table 3.
Table 3. Comparison of changes in hemoglobin levels on users and non-users of sodium–glucose cotransporter 2 inhibitors among propensity-matched cohort (propensity score-matched analyses) Mean hemoglobin levels (95% confidence interval) (g/L)† Adjusted mean difference (95% confidence interval) No SGLT2i SGLT2i Total Baseline‡135 (131–140)
(n = 98)
135 (131–139)
(n = 98)
3 months§132 (129–134)
(n = 81)
136 (134–139)
(n = 73)
5.0 (1.0–8.0) 6 months§131 (129–134)
(n = 76)
138 (135–140)
(n = 80)
7.0 (3.0–10.0) 12 months§130 (128–132)
(n = 84)
137 (135–140)
(n = 69)
7.0 (4.0–11.0) Those with estimated glomerular filtration rate ≤60 mL/min/1.73 m2 Baseline‡131 (124–138)
(n = 41)
134 (127–141)
(n = 39)
3 months§128 (124–132)
(n = 36)
138 (132–140)
(n = 32)
7.6 (2.0–13.2) 6 months§128 (124–132)
(n = 34)
138 (134–142)
(n = 33)
10.2 (4.1–16.3) 12 months§127 (123–131)
(n = 34)
136 (132–141)
(n = 31)
8.9 (2.6–15.2) Those with estimated glomerular filtration rate >60 mL/min/1.73 m2 Baseline‡139 (133–144)
(n = 57)
135 (130–141)
(n = 59)
3 months§135 (131–138)
(n = 45)
137 (133–140)
(n = 41)
2.2 (−3.0 to 7.3) 6 months§134 (130–137)
(n = 42)
138 (134–141)
(n = 47)
3.8 (−0.9 to 8.5) 12 months§132 (130–135)
(n = 50)
138 (135–141)
(n = 38)
5.6 (1.5–9.7) The number of available data are shown in parenthesis. † The data at 3, 6, and 12 months were adjusted for baseline hemoglobin levels. ‡ For users of sodium–glucose cotransporter 2 inhibitors (SGLT2i), hemoglobin levels before and the closest to the initiation of SGLT2i were used, and for non-users of SGLT2i, the first measurement of hemoglobin levels during the study period were used. § For users of SGLT2i, the time from initiation of SGLT2i was used and for non-users of SGLT2i, the time from the first measurement of hemoglobin levels was used. The data within 1 month were allowed. Variables associated with an increase in hemoglobin levels among SGLT2i usersAmong SGLT2i users, 196 participants had hemoglobin measurements at 6 months after initiation of SGLT2i. The mean increase in hemoglobin levels at 6 months was 3.0 g/L from baseline. Six months after initiation of SGLT2i, the increase in hemoglobin seemed to plateau. Associations between variables and an increase in hemoglobin >3.0 g/L at 6 months after initiation of SGLT2i are shown in Table 4. Older age, higher baseline hemoglobin levels and eGFR ≤15 mL/min/1.73 m2 compared with eGFR >60 mL/min/1.73 m2 were associated with a lower incidence of increased hemoglobin. Serum albumin levels, CRP levels and RDW were not associated with an increase in hemoglobin after initiation of SGLT2i. There were no significant differences in the odds of an increase in hemoglobin levels between different SGLT2 inhibitors. The association between baseline hemoglobin and increase in hemoglobin levels at 6 months is shown in Figure S6.
Table 4. Variables associated with the increase in hemoglobin levels (increase in hemoglobin levels >3.0 g/L) at 6 months after initiation of sodium–glucose cotransporter 2 inhibitors Odds ratio (95 % confidence interval) Age (per year) 0.94 (0.89–0.98) Sex (male vs female) 1.51 (0.56–4.09) Baseline hemoglobin (per 10 g/L) 0.58 (0.43–0.77) Serum albumin (per 10 g/L) 1.05 (0.48–2.28) CRP, log-transformed (per 10 mg/L) 0.96 (0.71–1.31) Estimated glomerular filtration rate >60 mL/min/1.73 m2 1 (Reference) >30 and ≤60 mL/min/1.73 m2 1.21 (0.46–3.16) >15 and ≤30 mL/min/1.73 m2 0.84 (0.14–4.92) ≤15 mL/min/1.73 m2 0.04 (0.00–0.93) Canagliflozin 1 (Reference) Empagliflozin 1.59 (0.20–12.55) Dapagliflozin 0.38 (0.13–1.16) Tofogliflozin 0.39 (0.09–1.71) Others 1.06 (0.29–3.95) Red cell distribution width (%) 1.06 (0.96–1.16) The bold values indicate variables with significant association with increase in hemoglobin. CRP, C-reactive protein; SGLT2 inhibitors, sodium-glucose cotransporter 2 inhibitors. DISCUSSIONIn the present study, we showed that the use of SGLT2i was associated with higher hemoglobin at an eGFR above approximately 15 mL/min/1.73 m2, and was also associated with a lower prevalence of anemia in real clinical practice. The novelty of this study is twofold: (i) the use of SGLT2i was associated with higher hemoglobin among those with advanced kidney diseases; and (ii) the use of SGLT2i was associated with a lower prevalence of anemia in real clinical practice, including in patients with active malignancy or acute illness.
The present study showed that the use of SGLT2i was associated with higher hemoglobin among diabetes patients with advanced CKD. Although multiple previous clinical trials have shown that the use of SGLT2i increases hemoglobin levels7-11, most of these studies excluded patients with eGFR <30 mL/min/1.73 m2. One study of stage 3–4 CKD15 included just 12 patients with eGFR <30 mL/min/1.73 m2. SGLT2i were shown to increase hemoglobin levels by increasing erythropoietin synthesis16, 17. Another study showed that after dapagliflozin treatment, hepcidin and ferritin levels, and transferrin saturation were reduced17, suggesting that SGLT2i might improve iron utilization. However, these studies were of patients with preserved renal function. In advanced kidney diseases, erythropoietin synthesis is impaired, and hepcidin levels are elevated due to chronic inflammation. It is unknown whether SGLT2i have any effect on hemoglobin among those with advanced kidney disease. The present study suggests that SGLT2i still improve anemia among those with an eGFR of 15–30 mL/min/1.73 m2. However, hemoglobin levels were less likely to increase among those with eGFR ≤15 mL/min/1.73 m2 than those with eGFR >60 mL/min/1.73 m2. This might be due to severely impaired erythropoietin synthesis. Additionally, lower MCV and MCH among SGLT2i users might suggest improved iron utilization. The results of the present study raise the possibility that SGLT2i might be used to treat anemia in CKD and might decrease the dose or use of ESAs. This might help reduce the cost for ESAs.
The present study also showed that the use of SGLT2i was associated with a lower prevalence of anemia among those with various comorbidities, including malignancy and acute illness. Clinical studies showing an increase in hemoglobin levels by SGLT2i excluded those with active malignancy within 5 years or recent cardiac events
留言 (0)