
記住我


Adolescence is often associated with profound changes. Besides sexual and physical maturation, adolescence also involves alterations in the home, school, and social environment as an individual moves toward autonomy and adult responsibilities. Profound changes in these multiple contexts concurrently give rise to an increased load of potential stressors in adolescence, such as conflicts with parents, trying to fit in with peers, managing romantic relationships, and augmented academic demands (1, 2). Although normal for this developmental period, this increase in stressors has been linked to a similar increase in internalizing as well as externalizing problems of psychosocial adjustment (e.g. 3, 4). In fact, stressors – including everyday stressors – have been implicated in the development of several behavioral and emotional disorders as well as psychosomatic problems (e.g. 3, 5-7). As such, stressor experience is an important topic of research concerning adolescent psychopathology and its development. However, to conduct such studies, good measures of common and contemporary stressors in adolescence and adolescents’ experience of these are needed.
A common critique in the literature on the measurement of stressors and stressor experience in adolescence is that the items included are often derived from similar measures in adults, raising the question of their relevance for the specific developmental period (4). Another critique is that many measures are specific to the types of stressors that the researcher is interested in (e.g., abuse and family conflict) and as such do not reflect the broader array of everyday stressors in adolescence (8). One instrument that was originally developed and more recently updated as a response to these criticisms is the Adolescent Stress Questionnaire (ASQ; 9) and, its more recent revision, the Adolescent Stress Questionnaire 2 (ASQ-2; 8).
The ASQ was developed to assess exposure to common stressors in the everyday life of adolescents in three main areas: school, family, and personal life (9). The items were derived from structured focus groups involving teachers, parents, and adolescents, to make sure that the items chosen were relevant with regard to the developmental period. In line with the reasoning of Byrne and Mazanov (10), the ASQ was recently updated to account for proposed changes in social contexts and expressive language over time that can affect its future construct validity. The latest version of the ASQ (ASQ-2) has been found to possess good test-retest reliability and concurrent validity regarding anxiety, depressive symptoms, and self-esteem in Australian adolescents (8).
More recently, the ASQ-2 has also been evaluated in several samples of European adolescents, overall indicating adequate psychometric properties (11-14). The original factor structure has by and large been confirmed in these samples (11-14), and concurrent validity regarding emotional symptoms and self-esteem has been replicated in a sample of Norwegian adolescents (13). Overall, these studies suggest that the ASQ-2 may be a viable measure of adolescent stressor experience in European as well as Australian samples. However, the latest version of the ASQ-2 is, with its 58 items, quite extensive. This may render its use in large cohort studies, where several aspects of adolescent health are being investigated, inconvenient and problematic. The length and coverage of the questionnaire might also reduce the utility of the instrument in contexts where time and resources are limited, such as the school or health care systems.
Thus, the aim of this study was to evaluate a shortened version of the ASQ-2 (ASQ-S) regarding factor structure and psychometric properties in a large sample of Swedish adolescents. More specifically, we investigated the factor structure with Exploratory and Confirmatory Factor Analysis (EFA and CFA). We also analyzed concurrent validity by investigating the relationship of ASQ-S with anxiety, depressive symptoms, and self-esteem, and its predictive validity by investigating whether stressor experience measured by the ASQ-S predicted depressive symptoms, anxiety, and worry one year later. Worry was chosen because it has been suggested to be an important mechanism in the development of stress-related ill-health (15, 16). Lastly, sex differences in the ASQ and its different subscales have been reported in all of the previously mentioned studies (e.g. 8, 11, 12, 13), with girls in general reporting more stress than boys. However, no study has to our knowledge looked at whether the ASQ possesses measurement invariance across sexes, measuring the same constructs in both sexes. This is important because potential sex differences in item interpretation or use of the response scales may make mean differences between groups hard to interpret at best or at worst misleading (17, 18). Therefore, we also investigated measurement invariance across sexes for the ASQ-S before looking at mean level differences between sexes.
MethodsThis study is part of a larger prospective study – the Three Cities Study. The aim of the Three Cities Study is to investigate risk and protective factors important in the development of comorbid mental health problems during the adolescent years. A comprehensive questionnaire covering a range of questions about mental health and family and social relationships is administered to the selected cohort on a yearly basis since 2014. For this study, only data about subjective stressor load, anxiety, depressive symptoms, worry, and self-esteem from the first and second wave were used.
Participants and procedureThe target sample included adolescents in 7th and 8th grade enrolled in public secondary schools in three Swedish communities (N = 3336). All public secondary schools within the catchment areas of the three communities were included, recording a total of 18 schools. The study used active consent from students and passive consent from parents to reduce sampling bias (19), which was approved by the regional ethics board of Uppsala (ref. number 2013/384). The longitudinal data collection was carried out in accordance with the ethical principles of the Declaration of Helsinki. All parents of eligible children (N = 3336) received a letter informing them about the study. If they did not want their child to participate, they were urged to return a notification of this included in the letter using a prepaid return envelope. Parents did not consent to participation of their child in the study in 122 cases (3.6%). A total of 446 students (13.4%) either declined to participate or were absent the day of the data collection, leaving a total sample at baseline of 2768 (47.5% female) students, with a mean age of 13.65 (standard deviation = 0.65; range, 12 to 16) years. Most participants were born in Sweden (88.6%), and 32.6% had at least one parent born outside of Sweden. Most participants (71%) lived with both of their parents, 14.3% alternated between living with their mother or father, 10.9% lived with one of their parents only, and 1.2% lived with someone else than their parents.
Data were collected in classrooms during school hours, and participants were informed that their participation was voluntary. Teachers were asked to leave the classroom for confidentiality, and trained questionnaire administrators informed each class about the study, administered the questionnaires, and answered questions when necessary. Each class received 300 SEK for their class fundraising. Data collection took 90 minutes per class.
A second assessment took place one year later following the same procedure. The retention rate was very good, with 91.1% of the baseline sample also participating at follow up. The good retention rate was likely a result of the inclusion of all public schools in the catchment areas of the communities in the study, reducing the risk of attrition owing to transition between schools. Participants who did not complete the follow-up assessment (8.9%, n = 236) reported more depressive symptoms (B = 0.03, SE = 0.01, odds ratio = 1.03) and were more likely to not have been born in Sweden (B = 0.76, SE = 0.01, odds ratio = 2.14). However, they did not differ from participants who completed both assessments in terms of sex, reported level of stressor experience, anxiety, or worry (Ps > 0.10). Although the overall model was significant (χ2(7) = 29.83, P < 0.01), owing to low Nagelkerke R2 (0.04), we expected depressive symptoms and place of birth to have a minimal effect on attrition.
MeasuresData from the baseline assessment were used in all analyses, except when examining predictive validity (anxiety, depressive symptoms, and worry). For these analyses, data from both baseline (T1) and follow up (T2) were used for the measures of anxiety, depressive symptoms, and worry.
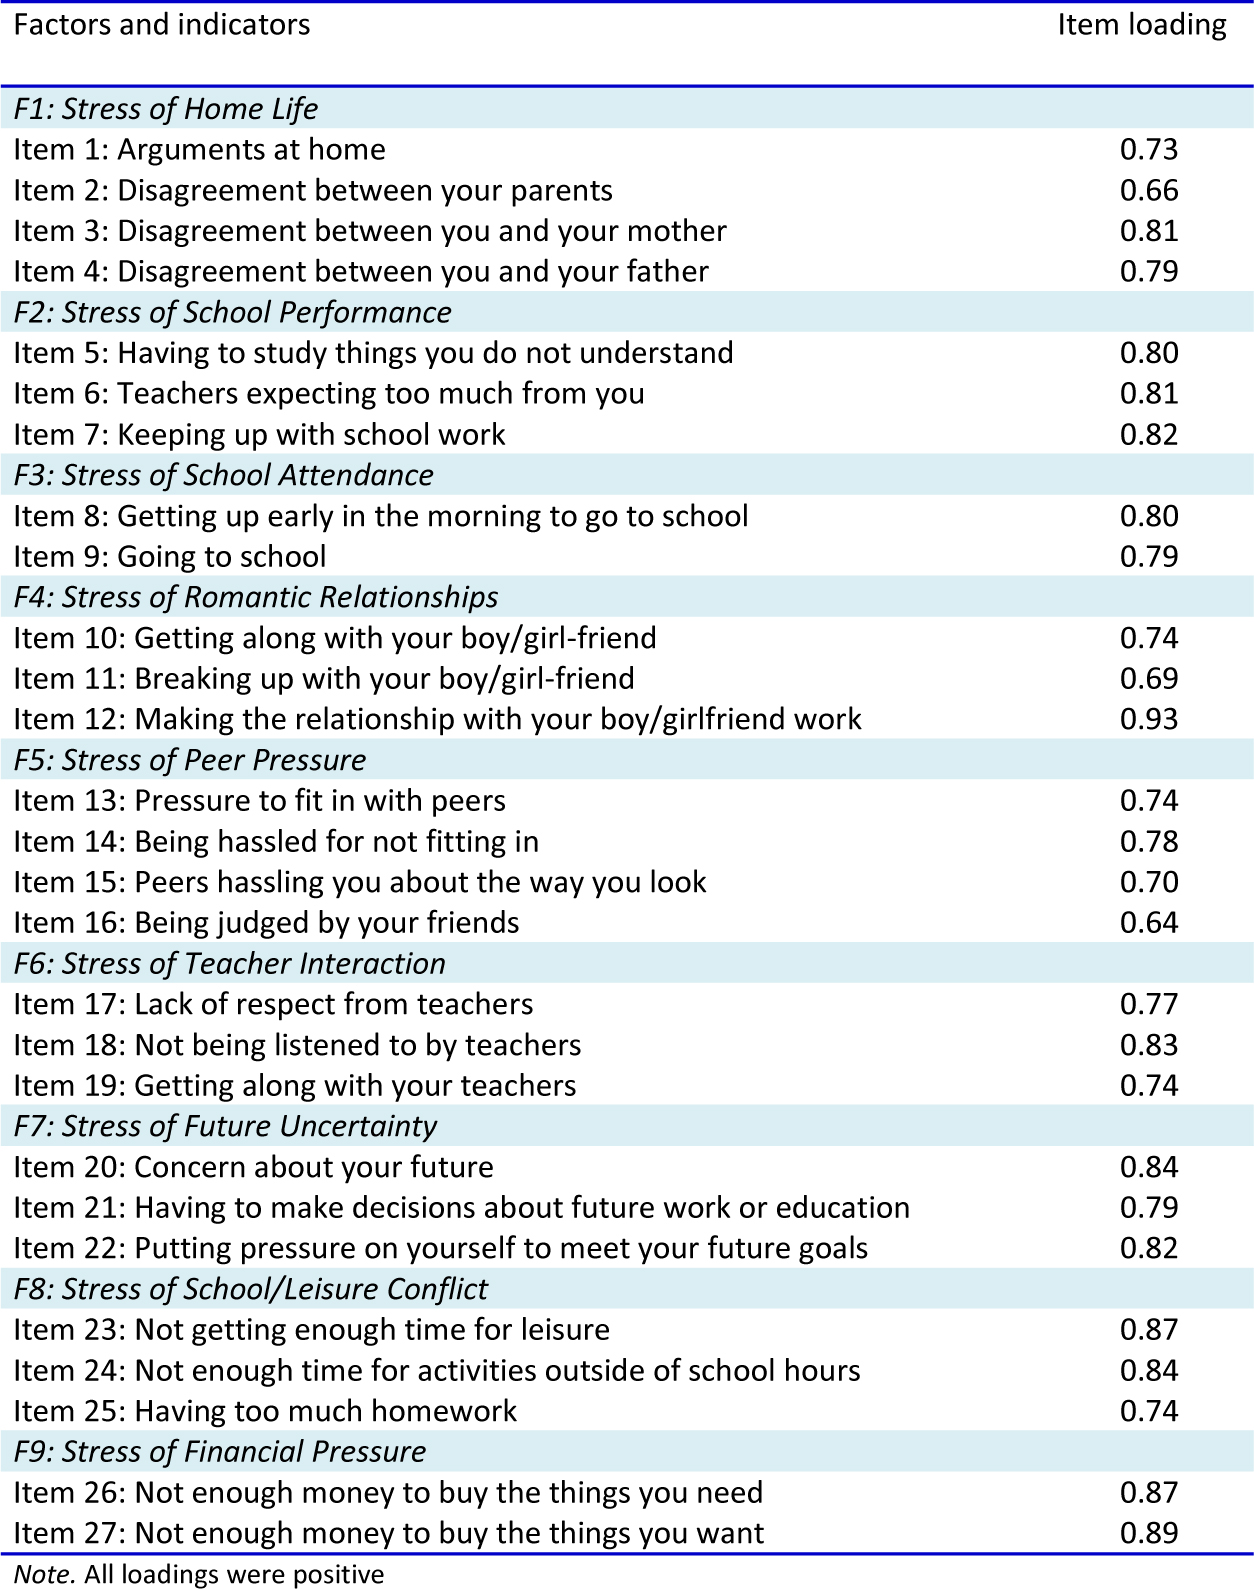
Adolescent stressTo measure adolescent stress or experience, 27 of the 58 items from the Adolescent Stress Questionnaire (ASQ; 8) were used. The ASQ asks respondents to indicate how stressful the situations in each item have been for them during the past year. For this study, the time period was changed from the past year to the past 6 months. Each item is rated on a five-point Likert scale: 1 = not at all stressful (or has not happened), 2 = a little stressful, 3 = moderately stressful, 4 = quite stressful, and 5 = very stressful. The two to four items (depending on the original number of items per factor) with the highest factor loadings from each factor were selected. This strategy of selecting items based on factor loadings is a common method in the creation of short versions within psychology (20). An examination of the factor structure of the latest Australian version of the ASQ resulted in 10 factors reflecting stress of home life, school performance, school attendance, romantic relationships, peer pressure, teacher interaction, future uncertainty, school/leisure conflict, financial pressure, and emerging adult responsibility (8). Cronbach’s alphas for the scales ranged from 0.62 (emerging adult responsibility) to 0.92. (home life) (8). Items from the “Stress of emerging adult responsibility” subscale were removed owing to the items being concerned with work and employers, which did not seem relevant for a significant proportion of our sample (the legal age for working in Sweden is 14). The remaining 27 items were back and forth translated by two independent bilingual translators. The items were then piloted on a subsample of Swedish adolescents in the 6th to 10th grade (N = 508) in schools not participating in the main study, to make sure that the wording was culturally suitable and understandable for the age group. The Cronbach’s alpha for the complete ASQ-S was 0.93. The corrected item-total correlation ranged from 0.33 to 0.70, with items 10 (“Getting along with your boyfriend/girlfriend”) and 11 (“Breaking up with your boyfriend/girlfriend”) having values < 0.40. Items were given in the same order in the questionnaire as presented in Table 1.
TABLE 1.Cronbach’s alfa and factor structure of the Adolescent Stress Questionnaire- Shortened version (ASQ-S); standardized loadings
 Self-esteem
Self-esteem was assessed using the Rosenberg Self-Esteem Scale (RSE; 21) which is a 10-item self-rating questionnaire. Items are rated on a four-point Likert scale ranging from 0 = strongly disagree, 1 = disagree, 2 = agree, to 3 = strongly agree. The Rosenberg Self-Esteem Scale measures global self-esteem, with a higher score indicating a higher self-esteem, and has been found to be a valid and reliable measure in adults as well as adolescents (22, 23). The Cronbach’s alpha in this study was 0.93. The corrected item-total correlation ranged from 0.66 to 0.77.
DepressionTo assess depressive symptoms, The Center for Epidemiology Studies Depression Scale for Children (CES-DC; 24) was used. CES-DC is a 20-item self-rating questionnaire. The response scale varies from 0 to 3, with verbal descriptors being 0 = not at all, 1 = a little, 2 = some, and 3 = a lot. The scale has a maximum score of 60, where a higher score indicates more severe symptoms of depression. The CES-DC has been found to be a reliable and valid measure of depressive symptoms in Swedish adolescents (25). The Cronbach’s alpha for the CES-DC at baseline was 0.95 and corrected item-total correlations ranged from 0.54 to 0.81. At follow up, the Cronbach’s alpha was 0.92, and corrected item-total correlations ranged from 0.28 to 0.78, with two of the reversed items (“I felt like I was just as good as other kids” and “I felt like something good was going to happen”) having values < 0.40.
AnxietyFor the assessment of anxiety, the Overall Anxiety and Impairment Scale (OASIS; 26) was used. The OASIS is a five-item self-report measure of severity and impairment of anxiety symptoms. Responses are given on a five-point scale, ranging from 0 to 4 with different wording on the response options, but with a higher score indicating more severe anxiety or impairment. The OASIS has been found to demonstrate sound psychometric properties with non-clinical as well as clinical samples (26, 27). In the current study, the abbreviated version by Norman et al (26) was used. In our sample, the Cronbach’s alpha was 0.88 at baseline, and corrected item-total correlations ranged from 0.66 to 0.77. At follow up, the Cronbach’s alpha was 0.88, and corrected item-total correlations ranged from 0.66 to 0.79.
WorryFor the assessment of worry, the Penn State Worry Questionnaire for Children was used (PSWQ-C; 28). The PSWQ-C is a 14-item self-report scale that assesses trait worry. Answers are given on a four-point scale, indicating how often the statements apply to the responder (0 = Never, 1 = Sometimes, 2 = Often, and 3 = Always) and has a maximum score of 42, where a higher score indicates higher levels of trait worry. The PSWQ-C has demonstrated good psychometric properties in non-clinical as well as clinical samples of children and adolescents (28-30). In the current sample, the Cronbach’s alpha was 0.90 at baseline, and corrected item-total correlations ranged from 0.29 to 0.76, with item 7 (“I find it easy to stop worrying when I want”) and item 11 (“I notice that I have been worrying about things”) having values < 0.40. At follow up, the Cronbach’s alpha was 0.92, and corrected item-total correlations ranged from 0.34 to 0.81, with item 11 having a value < 0.40.
Statistical analysesThe analyses were performed in Mplus version 7 (31) and SPSS version 23 (SPSS Inc.). Initially, measures were summarized with descriptive statistics for the full sample and for boys and girls separately. For factor analyses, we did a random split of the sample and performed an EFA, specifying one to nine factors on half of the sample (N = 1384), as the 10th factor (stress of emerging adult responsibilities) from the ASQ-2 was not included. As we expected the factors to be correlated, the Geomin rotation was used. Internal attrition at the item level for the ASQ was low, ranging from 1.6% (item 8) to 3.7% (item 11), thus the full information maximum likelihood estimation method was used to handle missing data. Owing to some non-normality in the data, Maximum Likelihood Estimation with Robust standard errors (MLR estimation) was used. Eigenvalues, factor structure, loadings, and model fit were investigated to decide on which model to move forward with in the CFA. Satorra-Bentler Scaled chi-square difference tests (32), adjusting for the MLR estimation, were used for comparison of nested models. For comparison of non-nested models, the Bayesian Information Criterion was used, with lower values indicating better fit. We then used the other half of the sample (N = 1384) to confirm the best factor solution derived from the EFA with a CFA. Model fit was examined according to recommendations provided by Hu and Bentler (33) and Yu (34) where values of the Comparative Fit Index (CFI) > 0.95 are indicative of a good model fit and the root-mean-square error of approximation (RMSEA) is recommended to be < 0.06.
After deciding on the optimal model, we examined measurement invariance across sexes, testing for configural, metric, and scalar invariances using multiple group analysis. For these analyses, we used the full sample. The invariance testing was carried out in a hierarchical manner, where each model was compared with the previous, as constraints were added to the model in every step. First, the same overall factor structure was fitted to both groups to establish that the pattern was similar across groups and evaluating model fit according to the aforementioned fit indices. Next, a stricter model where factor loadings were constrained to be equal across groups was compared with the configural invariance model. Last, both loadings and intercepts were constrained to be equal across groups. We used the change in the CFI for model comparison as recommended by Cheung and Rensvold (35). At each step, the change in CFI should not exceed 0.01 for the assumption of invariance to be considered reasonable.
Pearson’s correlation was calculated to assess concurrent validity, and t-tests were calculated to assess sex differences. For these analyses, we did a Bonferroni correction to reduce the false discovery rate. A p-value below 0.005 was considered significant. These analyses were carried out using SPSS version 23. For the analyses in SPSS, Multiple Imputation was used to handle missing data. In line with Kärnä, Voeten (36), a two-step procedure was followed, where the quark function in R was first used to create principal components, which were then used as auxiliary variables in the mice function in R to impute 100 data sets (see 37). The average or modal imputed values were then calculated and imputed in the original data set.
Finally, to investigate predictive validity, we ran three separate multiple regression analyses with manifest variables in Mplus. In these analyses, anxiety, depressive symptoms, and worry at follow up (T2) was used as outcome variables correspondingly, and the baseline (T1) measures of the stressors domains identified in the CFA were used as predictors. Age, sex, and baseline symptoms (T1) were controlled for to be able to explore whether the stress subscales showed unique predictive validity beyond variance explained by previous ratings of symptoms. For depressive symptoms, anxiety, and worry, the total scores for the respective scales were used. For the stressor domains, we used the latent variable factor scores obtained from CFA on the full sample. As with the factor analyses, the MLR estimator was used.
Results Descriptive statisticsIn Table 2, the means and standard deviations for all measures are presented for the full sample and for boys and girls separately.
TABLE 2.Descriptive statistics for the total sample and for boys and girls separately
 Exploratory factor analysis
Based on the Kaiser criterion (eigen > 1), the eigenvalues obtained by the EFA indicated up to seven factors, with an eigenvalue of 9.82 for the first factor and 2.18 to 1.02 for the remaining six factors. However, as can be seen in Table 3, fit indices indicated that the optimal fit to the data was obtained by a nine-factor solution. Inspection of the structure showed that for the seven-factor solution, items measuring stress due to “school performance,” “school attendance,” and “school/leisure conflict” were incorporated under a common “school” factor. In the eight-factor solution, an additional factor of stress of “school/leisure conflict” emerged, and in the nine-factor solution, the common “school” factor separated into three school-related factors. Model comparison with the Satorra-Bentler Scaled Chi-Square difference test showed that the eight-factor model improved model fit significantly compared with the seven-factor model (χ2(20) = 354, P < 0.01) and that nine factors in turn improved model fit compared with eight factors (χ2(19) = 235, P < 0.01). Thus, taking into account fit indices, factor structure, and loadings, the nine-factor solution was deemed as the most optimal model.
TABLE 3.Exploratory Factor Analysis of the Adolescent Stress Questionnaire-Shortened version (ASQ-S) with one to nine factors
 Confirmatory factor analysis
The CFA model with nine factors showed an acceptable model fit: χ2 (288, N = 1361) = 693 (scaling correction, 1.5612), p < 0.001; CFI = 0.97; RMSEA = 0.03 [95% confidence interval: (0.03-0.04)]. As can be seen in Table 1, factor loadings were in general high. The Cronbach’s alpha for the full scale was 0.93 and ranged from 0.77 to 0.87 for the nine subscales (mean = 0.83). Correlations between factors in the CFA model ranged from r = 0.28 (p < 0.01) to r = 0.72 (p < 0.01), with the factor “Stress of romantic relationships” having the smallest correlation with the other scales. The factors of stress of “School Performance,” “School Attendance,” “School/Leisure Conflict,” and “Future Uncertainty” showed the highest portion of shared variance, with correlations ranging from r = 0.60 (p < 0.01) (“Future Uncertainty” with “School Attendance”) to r = 0.72 (p < 0.01) (“School Performance” with “School Attendance”).
Measurement invariance across sexAs can be seen in Table 4, the ASQ-S nine-factor solution had an acceptable model fit in both sexes separately. The configural invariance model, where the same overall factor structure was fitted to both groups simultaneously, also fitted the data well, and we proceeded to test for metric invariance. Again, the stricter model of metric invariance had an acceptable fit, and the change in the CFI was well below 0.01, supporting the case that both groups conceptualized the construct similarly. Finally, adding the constraint of the intercepts to be equal across sexes, resulted in a CFI change of 0.005 (0.004 from the configural model). Model fit indices were also acceptable, χ2 (612, N = 1296/1420) = 1610, p < 0.001; CFI = 0.95; RMSEA = 0.04 [95% confidence interval: (0.03-0.04)], lending support to the ASQ-S being scalar invariant across sexes. This indicates that differences found between boys and girls are not simply owing to them construing the items or response scale differently, but can be indicative of true mean-level differences (17).
TABLE 4.The nine factored solution of the Adolescent Stress Questionnaire- Shortened version (ASQ-S) for girls and boys separately and measurement invariance across sex
 Concurrent validity
All nine subscales correlated significantly with emotional distress in the expected direction (ranging from r = 0.17 to r = 0.57,). Similarly, they correlated significantly and negatively with self-esteem (ranging from r = −0.22 to r = −0.48), indicating adequate concurrent validity.
SexIn Table 5, the means and standard deviations for each ASQ-S subscale are presented for girls and boys separately. As expected, sex differences were found in eight of nine scales, with girls reporting significantly more stressor experience than boys.
TABLE 5. Predictive validity
For predictive validity, three separate multiple regression models using the nine ASQ-S subscales as predictors of levels of depressive symptoms, anxiety, or worry one year later were tested. Age, sex, and baseline levels of depressive symptoms, anxiety, or worry were controlled for in the respective models. As can be seen in Table 6, subjective stressor load related to romantic relationships at baseline significantly predicted depressive symptoms one year later above and beyond age, sex, and baseline depressive symptoms. As for anxiety, stressors related to home life and peer pressure predicted anxiety one year later. Furthermore, the subscale of stressors related to peer pressure predicted reported worry one year later. Stress of teacher interaction also predicted levels of worry over time; however, somewhat surprisingly the relationship was negative. Higher levels of reported stress relating to teacher interaction predicted lower levels of reported worry one year later. Ad hoc analyses, where teacher interaction was added without the other subscales, revealed a significant positive relationship with worry (b = 0.04, p < 0.05). When the scales were added simultaneously, this resulted in a shift in the direction of the effect. Adding the other scales in differential orders indicated that the subscales of stress owing to school attendance and future uncertainty seemed to suppress the effect of teacher interaction.
TABLE 6.Results from three separate multiple regression analyses with the ASQ-S subscales as predictor variables and depressive symptoms (CES-DC), anxiety (OASIS) or worry (PSWQ-C) one year later (T2) as dependent variables. Baseline (T1) symptoms were controlled for
 Discussion
The aim of this study was to evaluate a shortened version of the Adolescent Stress Questionnaire (ASQ-S) in a large sample of Swedish adolescents in terms of factor structure, sex invariance, and concurrent and predictive validity. Our results suggest that the original factor structure was retained in the shortened version and that that the shortened version works similarly across sexes. The results further suggest that, although much shortened, the ASQ-S seems to perform similarly as the full ASQ-2 in terms of concurrent validity. A few of the subscales were also able to predict levels of depressive symptoms, anxiety, or worry over a one-year period.
In line with the original factor structure of the ASQ-2, the EFA supported a nine-factor solution. Although ten component scales were retained in the full ASQ-2 (8), a nine-factor solution was expected, as items belonging to the component of stress of “emerging adult responsibilities” were removed in the construction of the shortened version. The nine-factor CFA also showed a statistically acceptable fit to the observed data in the Swedish sample. Both factor loadings and internal consistency were in line with what has been reported for the full ASQ-2 in both Australian and European samples (8, 11, 13). Factor correlations indicated that the factors were statistically related, but their item content indicated that they reflected thematically separate constructs. The higher overlap between the scales of stress of “School Performance,” “School Attendance,” “School/Leisure Conflict,” and “Future Uncertainty” is not surprising, as three of the scales concern school-related issues whereas the fourth is related to worries about future education and goals. Moreover, the shared variance of these scales ranged from 36% to 52%, indicating that they have considerable unique variance not accounted for by the other factors. Overall, the nine-factor CFA supported the construct validity of the ASQ-S and the equivalence between the ASQ-S and the full instrument.
The current study makes a unique contribution to the literature on stressor measurement in adolescence as our results indicate that the ASQ-S is scalar invariant across sexes, meaning that the ASQ-S measures the same constructs – as reflected in shortened scale scores – across sexes. This is important as girls in general report higher levels of stressor exposure and higher levels of perceived stressor effect across a greater number of stressor domains than do boys (8, 13, 38, 39). However, establishing measurement invariance is essential before interpreting such findings. This has, to our knowledge, often been overlooked and has not previously been investigated for the ASQ-2. As our results supported invariance across sexes, the mean-level differences found between boys and girls in our sample indicate a clear difference between sexes in subjective stressor load. That is, girls in our sample reported significantly more stress within all stressor domains except for stressors related to romantic relationships. This fits with a wealth of existing evidence on sex differences in the experience of adolescent stress (e.g. 8, 39, 40), and indeed with a good deal of evidence from adult studies on the experience more broadly of emotional distress (e.g. 41, 42). The strength and consistency of this finding adds further weight to the argument that such sex differences are real and not an artifact of biased reporting.
Besides establishing invariance across sexes, our results also supported the ASQ-S to possess adequate concurrent criterion validity, as the nine subscales were found to correlate positively with reported depressive symptoms, anxiety, and the tendency to worry, whereas a negative relationship was found with self-esteem. Correlations were of similar sizes to previous reports of the full ASQ-2 (8, 13), indicating that the shortened version seems to be as valid as the full version in terms of concurrent validity. Adding to this, the current study also investigated the potential of the ASQ-S’s subscales to predict depressive symptoms, anxiety, and worry over time. Given the vast amount of research that has consistently linked the experience of stress to the development of emotional symptoms and cognitive vulnerabilities and vice versa (3, 5, 43-47), we expected the ASQ-S to be related to subsequent levels of emotional symptoms and worry. Our results show that a subset of the scales seems to be significant predictors for emotional symptoms and worry over time. The subscale of stress of peer pressure predicted both subsequent levels of worry and anxiety, whereas stress of romantic relationship was the only scale that predicted depressive symptoms over time. Anxiety was also predicted by stress of home life. However, it should be noted that the effect-sizes were small, and clinical significance cannot be inferred. Nevertheless, considering that we made use of a sample from the normal population and controlled for both baseline symptoms and sex (factors that are commonly found to be related to both subjective stressor load and emotional distress), a small effect size is not surprising. Thus, four of the nine scales showed evidence of predictive validity in relation to emotional symptoms, and they seem to be related to a specific problem such as depressive symptoms or anxiety and worry rather than emotional problems in general. This suggests a certain level of specificity, and it might be that other subscales are related to other types of problems.
An unexpected finding was that the subscales of stress relating to teacher interaction statistically predicted worry, but in the opposite direction than was hypothesized. That is, lower levels of reported stress owing to teacher interaction predicted higher levels of worry. Ad hoc testing indicated that the subscales of school performance and future uncertainty seemed to act as suppressors of the teacher interaction scale. A possible explanation for this may be that when entered simultaneously, stress related to teacher interaction as opposed to stress related to school performance and future uncertainty, which might represent a more pure measure of conflict with teachers, and as such it may relate more to some attribute of personality, for example trait anger. Conflict with teachers may then be more salient for adolescents with externalizing problems than for adolescents with internalizing problems, which could explain the non-significant relation to measures of emotional distress and the negative relationship to worry. However, these interpretations must remain speculative for the time being and will need further exploration in subsequent studies.
To summarize, our results show that the ASQ-S has an adequate concurrent validity and that some of the subscales also have predictive validity for self-reported emotional distress; however, the effect sizes were small. These results are in line with previous studies of criterion validity of the ASQ-2 with similar constructs (8, 12, 13). However, the influence of the stressor subscales differed depending on outcome. Thus, examining specificity and generalizability of different stressor contexts in adolescence in relation to internalizing as well as externalizing problems will mark an important area for future investigation.
Finally, although this study has considerable strengths such as a large sample from both urban and rural areas as well as the longitudinal design, it also has some limitations. First, the time span of one year between baseline and follow-up measurement was quite long, and it would have been informative to know what happens in between the measurement points. We cannot exclude the possibility of other potentially important factors being at play, and thus, we cannot make claims of causality. Second, adolescents who reported more depressive symptoms and adolescents who were born outside of Sweden were more likely to be absent at follow up. It is likely that a significant proportion of adolescents born outside Sweden – who might also possibly be refugees – may have reported an overload of stressors at baseline and (if they had stayed in the study) at follow up. This raises the possibility of selective bias in the follow-up sample. However, our attrition analyses indicated that the effect of depressive symptoms and place of birth on attrition at follow up was minimal. Third, as all constructs were measured with the same method, there is a risk that part of the variance is attributable to the measurement method rather than the constructs the measures are intended to capture, that is, common method variance (48). Common method variance can have several causes (e.g., mood state, social desirability, and common scale formats) and can lead to common method bias by for example inflating correlations within or between constructs. In an effort to mitigate some of these problems, we randomized order effects. Specifically, the full questionnaire was divided in two parts, with a random half of the respondents in our sample starting with part 1 and the other half with part 2. Although measures included in the present study did have similar response scales (Likert scales), their location was spread out in the full questionnaire, and the full questionnaire contained a range of different types of response scale formats and anchors. However, we cannot fully exclude the possibility of common method bias possibly inflating some of the covariance between our constructs.
Last, it is important to consider that shorter instruments with fewer items can result in a reduction in precision of the constructs the measure intends to capture. Although our results indicate that the shortened version of the ASQ-2 shows equivalent psychometric properties to the full version, the full version might be more adequate to administer when a thorough understanding of a person’s subjective stressor load is required, such as within treatment or counseling. The ASQ-S may instead be a preferable option in contexts where brevity is a necessity, such as within epidemiological studies or screening procedures within the school and health care systems.
Clinical significance and conclusionsTo conclude, the ASQ-S seems to be a valid and reliable measure of adolescent stressor experience among Swedish adolescents. Although much shortened, it seems to possess similar psychometric properties as the full instrument, indicating that the ASQ-S could be a valid option both in research and in clinical settings where resources and time are limited. In addition, some of the ASQ-S scales also seem to be valid predictors of emotional distress over time as well as of cognitive processes suggested important in the development of stress-related ill-health, such as worry. Thus, the ASQ-S could be a valid instrument in assessing at-risk adolescents in preventive work. However, further research is needed to investigate which stressor areas are most relevant for what outcomes, and if the measure acts differently in different populations, such as adolescents with clinical problems.
留言 (0)