
記住我
Host defence peptides (HDPs) are molecules secreted as part of the non-specific response of the innate immune system.1 Having been identified in all species of organisms, from bacteria to vertebrate animals, HDPs form a highly conserved part of the immune response.2-5 HDPs are particularly abundant in amphibians; of the 3257 antimicrobial peptides in the APD3 database (http://aps.unmc.edu/AP/main.php), 1120 were isolated from amphibians.6
The continuous emergence of antimicrobial resistance to conventional small-molecule drugs has reinvigorated interest in HDPs, which can be used without the development of resistance. HDPs have been identified with biological activity against various pathogens: Gram-positive and Gram-negative bacteria, fungi and parasites.7 HDPs have also been found with anticancer, antiviral and spermicidal activities.8 HDPs are suitable for use both in combination with conventional drugs, and as standalone substitutes.
HDPs are typically short, with a primary sequence length between 10-50 amino acid residues, although biologically active peptides as short as two residues have been identified. These peptides usually do not possess a secondary structure in water, unless they are highly conformationally restrained by a number of disulfide bonds. Instead, these peptides adopt a defined secondary structure in a hydrophobic environment, such as upon contact with a bacterial membrane or in a non-polar solvent. Peptides can be classified on the basis of their secondary structures. Most of the peptides identified possess an α-helical structure. Other observed structures include β-sheet, mixed α-β structures and extended structures.
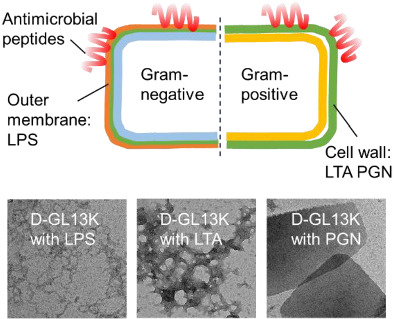
HDPs are typically characterised by their amphipathic nature and an overall positive charge. In contrast, prokaryotic cell membranes are rich in anionic molecules; Gram-negative bacterial membranes contain negatively charged lipopolysaccharides (LPS), while Gram-positive bacterial membranes contain phospholipids and acidic polysaccharides (teichoic acids).9, 10 This contrast facilitates the electrostatically driven interaction between peptide and prokaryotic cell membrane. Consequently, up to a point, increasing the peptide's positive charge results in a higher antibacterial activity.11, 12 Similarly, anticancer peptides are also electrostatically attracted to the cell membranes of cancerous cells, which are enriched in negative charge relative to non-cancerous cell membranes. Despite the apparent importance of positive charge for antibacterial activity, antimicrobial peptides with an overall negative charge have also been identified. Maximin H5, which has an overall negative charge, relies primarily on its high hydrophobicity for interaction with the cell membrane.13
HDPs typically kill bacteria through disruption of the cell membrane. Three main mechanisms of action have been identified. All three mechanisms begin with the peptides' binding to the cell membrane surface. The difference between the mechanisms of action begins once the peptides' concentration on the membrane surface reaches a threshold concentration. In the carpet model, the bilayer curvature is disrupted and the membrane disintegrates. The barrel-stave model involves the peptides forming a pore, where the hydrophobic residues face outward towards the bilayer's lipid core region, while the hydrophilic residues form the pore's lumen. The toroidal pore model, meanwhile, requires that the peptides bend the membrane from the outer leaflet towards the inner leaflet, resulting in the formation of a toroidal pore consisting of the lipid head groups and the peptides.14, 15 All three models of action result in the leakage of cellular components and the dissipation of the cross-membrane electrical potential. The HDP's relatively non-specific membranolytic mechanism of action is the reason why few cases of bacterial resistance to HDPs exist.16, 17
Structural studies of various amphibian HDPs have been studied in our laboratory, including brevinin-1BYa18 and its analogues,19 maximin 3,20 palustrin-Ca,21 XT-7,22 ranatuerin-2CSa23 and alyteserin-1c.24 Maximin 1 (GIGTKILGGVKTALKGALKELASTYAN) is a 27 amino acid residue HDP first isolated from the skin secretions25 and later the brain of the Chinese red belly toad Bombina maxima.26 Maximin 1 is biologically interesting, as it possesses little haemolytic activity, and exhibits potent antimicrobial, anticancer, antiviral, anticancer and spermicidal activity.25 In this work, the structural properties of maximin 1 are explored using NMR spectroscopy, and maximin 1 and its designed, more cationic analogue [E20A]maximin 1 analogue are studied using molecular dynamics simulations.
2 MATERIALS AND METHODS 2.1 Materials and NMR sample preparation3-trimethylsilyl propionic acid (TSP) and 2,2,2-trifluoroethanol (TFE-d3) of analytical grade were obtained from Sigma-Aldrich (Ireland).
The peptide maximin 1 (MW = 2676 g mol−1, purity >95%) was purchased from ProteoGenix (Paris). Peptide (4.5 mg) was dissolved in 0.6 ml of a solution 50% (v/v) TFE-d3/H2O, resulting in a peptide concentration of 2.80 mM. TFE-water is a standard solvent mixture used in the elucidation of peptide structures.27 A 50% concentration has previously been found to be appropriate for peptide structure elucidation studies, as low concentrations result in poor amide chemical shift dispersion.28
2.2 NMR spectroscopyOne-dimensional proton, 2D phase-sensitive total correlation spectroscopy (TOCSY),29 nuclear Overhauser effect spectroscopy (NOESY)30 and natural abundance 1H-13C and 1H-15N heteronuclear single quantum coherence spectroscopy (1H-13C-HSQC) and 1H-15N-HSQC31 NMR experiments were performed at 298 K on a Bruker Avance 600 NMR spectrometer with a 5 mm inverse probe head at a 1H resonance frequency of 600.13 MHz. Spectra were acquired with relaxation delays of 2.5, 2.0, 1.5, 1.0, and 2.0 s, respectively, acquisition times of 3.4 s, 340 ms, 280 ms, 170 ms and 100 ms, respectively. Mixing times of 60 ms and 200 ms were used for the TOCSY and NOESY, respectively.
The 1H spectral width was 6.0, 7.2, 6.0, and 9.6 kHz for the TOCSY, NOESY, 1H-13C-HSQC and 1H-15N-HSQC, respectively. The 13C spectral width was 21.1 kHz and the 15N spectral width was 10.9 kHz.
The spectra were acquired with 4, 16, 32, and 64 transients for each of the 1024, 2048, 256, and 128 t1 increments for the TOCSY, NOESY, 1H-13C-HSQC and 1H-15N-HSQC, respectively. The sine squared window function was applied for processing in all 2D spectra and the 1H signal of TSP was used as a chemical shift reference. Spectra were processed with the Bruker TopSpin programme, version 4.0.6 (Bruker BioSpin, Germany).
2.3 Structure calculationThe acquired NMR spectra were analysed and the NOESY peaks were integrated using NMRFAM-SPARKY, version 3.131.32 The CALIBA33 programme was used to calibrate the NOE cross-peak intensities, and derive upper distance restraints from the peak volume integrals. Protons that could not be stereospecifically assigned were labelled as pseudoatoms. The obtained distance restraints were used as input to CYANA.34 Distance restraints involving fixed distances and inviolable were disregarded.
Distance restraints were weighted using 1 kJ mol−1 Å−2 as the force constant (kNOE). One hundred structures were generated using the CYANA programme.35 These model structures were further subjected to 20,000 steps of simulated annealing and 20,000 steps of conjugated gradient minimization. The 20 structures with the lowest target function values were selected, and subjected to a final step which involved 2,000 steps of conjugate gradient energy minimization, while restraining backbone atoms. The CHARMM22 force field36 in NAMD, version 2.1237 were used for the energy minimization. The energy-minimized structures were analysed using VMD (visual molecular dynamics), version 1.9.3.38 PROCHECK39 and wwPDB40 were used to determine the stereochemical quality and the structural statistics of the twenty final structural models.
2.4 Molecular dynamics simulationSDS micelle coordinates were obtained from Jakobtorweihen et al,41 and used in the construction of an SDS micelle-peptide system. The system was constructed by aligning the centres of mass of the maximin 1 medoid structure and the SDS micelle using VMD, version 1.9.3.38 The medoid structure is the one most similar to other models in the ensemble. To ensure that the system is neutral, chloride ions were added. The system was solvated with TIP3P water.
The CHARMM22 all-atom forcefield36, 42 and NAMD version 2.1237 were used to energy-minimize and equilibrate the system. The NPT ensemble, the Langevin piston Nose-Hoover method43, 44 and periodic boundary conditions were used for all calculations. The SHAKE algorithm45 was used to constrain all bonds to hydrogen atoms. Long-range non-bonded interactions were calculated up to a switching distance of 8.5 Å, beyond which a smooth switching function truncated the energy to a cut-off of 11 Å. Long-range electrostatic interactions were computed for every step by the PME method.46 The non-bonded interaction list was updated every step. A 2 fs timestep was employed.
The peptide-micelle in water system was minimized for 2,000 conjugate gradient steps with peptide backbone atoms fixed, and a further 2,000 steps with α-carbons restrained, so that the micelle environment doesn't excessively disrupt the protein structure during subsequent heating and equilibration. The system was heated to 310 K over 6,000 steps and then the volume equilibrated with the Langevin piston at 1 atm for 24,000 steps, followed by another 24,000 steps without restraints. Finally, the system was simulated for a further 55 ns without constraints.
3 RESULTS AND DISCUSSION 3.1 Conformational analysis by NMRTwo-dimensional NMR spectroscopy was used to determine the structure of maximin 1 in 50:50 TFE-d3/water, a standard solvent mixture used in the elucidation of peptide structures.27 The effects of TFE on the structure of peptides have been studied for approximately six decades.47, 48
Peptides that are not structurally restrained by disulfide bonds generally do not possess a defined secondary structure in aqueous solution,49-52 as sterically bulky residues and cationic residues can prevent α-helical self-aggregation. Similarly, the formation of β-sheets can be precluded by the sequence being lysine-rich. Consequently, the majority of linear cationic AMPs are disordered in aqueous solution.53, 54
The addition of TFE, however, is known to induce the formation of secondary structure by enhancing α-helical character in peptides.55 This has been observed in studies that systematically increase TFE concentration.18, 19, 49, 56
The mechanism that underlies this phenomenon is understood to be initiated by the preferential aggregation of TFE molecules around the peptide, facilitated by hydrophobic interaction between the trifluoromethyl group and hydrophobic sidechains. This causes TFE molecules to replace the peptide's hydration shell, thereby removing alternative hydrogen-bonding partners, a process driven by apolar interaction and the favourable enthalpy of dehydration. The low dielectric environment favours the formation of intrapeptide hydrogen bonds between the peptide's backbone amide groups.57, 58 This low dielectric environment is comparable to that experienced by peptides in biological membranes.
NMR structural studies of magainin 2 found that in the absence of TFE, magainin 2 possesses an extended random coil structure.59 Likewise, maximin 4, with which maximin 1 shares 56% sequence identity, does not appear to exhibit a well-defined structure in water.60 A 50% concentration has previously been found to be appropriate for peptide structure elucidation studies, as low concentrations result in poor amide chemical shift dispersion, which is indicative of a lack of defined secondary structure.61
Well-dispersed peaks are observed in the obtained spectra in TFE, indicating the presence of an ordered secondary structure. TOCSY, 1H-13C HSQC and 1H-15N HSQC spectra were used for the identification of individual residue spin systems. The HN-HN and the HN-Hα regions of the NOESY spectrum were used for carrying out sequence-specific resonance assignments, beginning with the unique residues Val10, Glu20, Tyr25 and Asn27 (Figure 1). The chemical shift of the Gly1 amide proton could not be determined due to chemical exchange. The backbone walk in the amide-amide region is incomplete, as the Lys15/Gly16, Tyr25/Ala26 and Ala26/Asn27cross-peaks are in the diagonal. The sequential assignment of these residues was completed in the NH-αH region (Figure 2).

Amide region of the 200 ms NOESY spectrum of maximin 1 in a 50% TFE-d3-H2O mixed solvent system with dNN(i,i+1) connectivities labelled

Fingerprint region of the 200 ms NOESY spectrum of maximin 1 in a 50% TFE-d3-H2O mixed solvent system with backbone connectivities labelled
Table 1 details all the identified 1H chemical shifts of maximin 1. The peptide's interresidue NOE connectivities are clearly identified in Figure 3, where the thickness of each line is proportional to the NOE intensity. There are many dαN(i, i+3), dαβ(i, i+3), dαN(i, i+4) and dαβ(i, i+4) connectivities throughout, which are typical of an α-helical secondary structure, and some dαN(i, i+2) connectivities in the N-terminal tail region, which may be suggestive of a tighter helix.
TABLE 1. 1H chemical shifts (ppm) identified for every residue of maximin 1 in 50% TFE-d3/H2O Amino acid NH Hα Hβ Other protons Gly1 4.049, 4.021 Ile2 8.591 4.167 1.936 γ1 1.554, 1.340; γ2 1.017; δ 0.951 Gly3 8.531 3.958, 3.918 Thr4 7.785 4.295 4.085 γ 1.325 Lys5 7.832 4.224 2.008 γ 1.589, 1.495; δ 1.774; ϵ 3.021 Ile6 8.172 4.204 1.818 γ1 1.658; γ2 0.918; δ 0.898 Leu7 7.945 3.950 2.002 γ 1.691; δ 1.240, 0.959 Gly8 8.172 3.981, 3.908 Gly9 8.115 3.993 Val10 8.236 3.779 2.270 γ 1.112, 1.002 Lys11 8.385 4.024 2.003, 1.942 γ 1.485; δ 1.736; ϵ 2.990 Thr12 7.887 4.414 3.968 γ 1.318 Ala13 8.112 4.205 1.584 Leu14 8.552 4.192 1.857 γ 1.670; δ 1.017 Lys15 8.091 4.039 2.024, 1.979 γ 1.507; δ 1.738; ϵ 3.010 Gly16 8.078 3.924 Ala17 8.116 4.248 1.580 Leu18 7.991 4.080 2.030, 1.610 γ 1.502; δ 0.919 Lys19 8.378 4.175 1.916 γ 1.617; δ 1.729; Glu20 8.041 4.157 2.308, 2.266 γ 2.557, 2.528 Leu21 8.467 4.182 1.915, 1.758 γ 1.820; δ 0.963 Ala22 8.503 4.203 1.547 Ser23 7.925 4.397 4.088, 4.045 Thr24 7.781 4.230 4.198 γ 1.142 Tyr25 7.827 4.586 3.188, 3.002 δ 7.198; ϵ 6.837 Ala26 7.812 4.390 1.438 Asn27 7.806 4.692 2.877, 2.813
Short- and medium-range connectivities for maximin 1 in 50% TFE-d3-H2O
3.2 Molecular modellingThe NOE cross-peak volumes were converted into distance restraints, from which one hundred structures were obtained. The 20 structures with the lowest target function values were further energy-minimized. The structural statistics of the calculated models are summarised in Table 2. As illustrated in Figure 4, maximin 1 is predominantly α-helical, with the majority of the ensemble's model structures being α-helical between residues Ile2-Ala26, as defined by STRIDE.62 A minority of structures are not α-helical at Gly16, suggesting that this region is somewhat more flexible than a fully rigid α-helix.
TABLE 2. Average structural statistics of the twenty structural models of maximin 1. The peptide structure has been deposited in the PDB with deposition code 7OVC NOEs1 Intraresidue 115 Interresidue, sequential 93 Interresidue, nonsequential 127 Ensemble RMSD values, Å, SA±SDa Backbone All residues 0.819 ± 0.256 Segment I (G1-K15) 0.754 ± 0.224 Segment II (A17-A26) 0.832 ± 0.340 Heavy atoms All residues 1.411 ± 0.366 Segment I (G1-K15) 1.393 ± 0.558 Segment II (G16-A26) 1.328 ± 0.330 Ramachandran plot analysisb Residues in most favoured regions 89.51% Residues in additionally allowed regions 10.49% Residues in generously allowed regions 0% Residues in disallowed regions 0% Average energies (kcal/mol) Ebond 16.770 Eangle 68.338 Edihed 78.294 Eimprp 3.867 EVdW −59.548 Eelec −192.326 Etotal −87.364 a RMSD values from VMD b Based on PROCHECK
Ribbon representation of the medoid solution structure of maximin 1 in 50% TFE-d3-H2O, depicting the amphipathic helical motif. Nonpolar residues are coloured purple, while polar residues are coloured yellow
3.3 Molecular dynamicsA molecular dynamics simulation of the maximin 1 medoid structure in SDS micelles was carried out to model its behaviour in the bacterial membrane-mimicking environment. During the simulation, the peptide's position evolved from the initial position at the micelle centre, to a position at the micelle-water boundary, with the peptide lying parallel to the micelle surface (Figure 5). The peptide's amphipathicity is clearly observed; the hydrophobic sidechains, coloured purple, are clearly interacting with the micelle's hydrophobic core. The peptide's hydrophilic residues are solvent-facing, and the positively charged lysine residues are seen to be electrostatically attracted to the sulfate groups. The peptide, which was found to be α-helical between residues Ile2 and Ala26 by NMR spectroscopy, was found to adopt a similarly α-helical conformation in the SDS micelle medium. The ordered secondary structure exhibited by the peptide can be attributed to its electrostatic interactions with the SDS complementing the hydrophobic forces, which are also present in the TFE-water solvent mixture used for NMR spectroscopy.63

Final pose of maximin 1 in a simulated SDS micelle. Lysine residue side chains are shown interacting with the negatively charged sulfate headgroups. Polar residues are coloured in yellow, non-polar residues are coloured in purple. The SDS aliphatic chains are coloured green, the SDS sulfate headgroups are coloured red and orange, and are additionally highlighted with dotted spheres
Although the peptide maintains an α-helical conformation, it does exhibit a marked flexibility around the Gly16 residue, as can be observed in Figure 6, which allows it to adapt to the curvature of the micelle, and is also likely responsible for the peptide's low haemolytic activity. Previous studies of antimicrobial peptides have found that substituting a glycine residue with an alanine, thereby inducing a more rigid α-helical structure and reducing flexibility, can potentially result in an increase in toxicity against eukaryotic cells.64

Root-mean-square fluctuation (RMSF) calculated for the backbone atoms of each residue of maximin 1 over the course of the simulation. It is apparent that a region of flexibility exists near Gly16. Moreover, it can be clearly observed that the peptide's termini are less rigid than the rest of the peptide structure
Previously, increasing a peptide's positive charge has been found to be correlated with an enhanced antibacterial activity,16, 65-68 and increased haemolytic activity.69, 70 To study the effect of an increased overall charge on the peptide's interactions with the SDS micelle, and to understand the importance of the negatively charge Glu20 residue on the peptide's membrane interactions, a more cationic analogue peptide structure, was computationally designed by substituting the Glu20 residue with an alanine residue. Indeed, prediction of the native and mutant peptide's haemolytic activity with our neural network HAPPENN suggests that the mutant peptide is more haemolytic, with a haemolytic probability of 0.605, compared to the native peptide's 0.016.71 The mutant [E20A]maximin 1 peptide's interactions with the SDS micelle were simulated according to the same protocol as the native peptide. The peptide behaves similarly to the native peptide; it adopts a position parallel to the micelle surface, while maintaining an α-helical structure with glycine-centred flexibility (Figure 7). The interactions of both the native and mutant peptides with the micelle's hydrophobic core were assessed by means of the radial distribution function g(r), was calculated between the native and mutant peptides' carbon atoms and the micelle's aliphatic chain, and is plotted against the radius r, as shown in Figure 8. It is apparent from the radial distribution function plots that substituting the Glu20 with alanine results in the peptide being more strongly associated with micelle. This stronger association is most pronounced for the C-terminal residues.

Final pose of [E20A]maximin 1 in a simulated SDS micelle. Lysine and histidine side residues are shown interacting with the negatively charged sulfate headgroups. Polar residues are coloured in yellow, non-polar residues are coloured in purple. The SDS aliphatic chains are coloured green, the SDS sulfate headgroups are coloured red and orange, and are additionally highlighted with dotted spheres

Radial distribution function (RDF) g(r) plotted between the residues' carbon atoms and the sodium dodecyl sulfate (SDS) micelle aliphatic chain. The native peptide's RDF is coloured in blue, while the [E20A] analogue is coloured in red
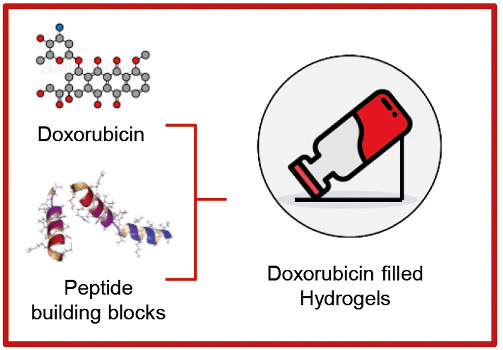
4 CONCLUSIONA large number of peptides have been isolated from the skin secretions and brain of Bombina maxima and characterised. Peptides belonging to the maximin family possess potent antimicrobial activity, and are incredibly exciting candidates for drug development. To date, only maximin 3 and maximin 4 have had their three-dimensional structures determined.20, 60, 72 Interestingly, the latter has been incorporated into hydrogel matrices for the prevention of medical device infection.73
Like most peptides in the maximin family, maximin 1 is 27 residues long, of whi
留言 (0)