
記住我
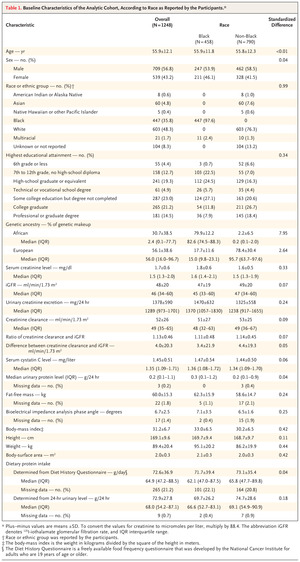
Participants were enrolled in the Chronic Renal Insufficiency Cohort (CRIC) study, a multicenter, prospective, observational study of racially and ethnically diverse patients with CKD in the United States. In this study, which began in 2003, the initial cohort of 3939 patients included a purposive sample of adults with a broad range of types and severities of CKD.17-19 In order to be representative of key components of the U.S. population with CKD, the protocol specified that the cohort should be composed of approximately 40% of participants who identified as Black, approximately 50% women, approximately 50% persons with diabetes, and approximately 15% who identified as Hispanic. We randomly selected a subgroup of 1423 participants from the CRIC study to undergo direct measurement of GFR through urinary 125I-iothalamate clearance. This approach involved stratified sampling to ensure representation across strata of diabetes status, stages of CKD, age, sex, race, and participating clinical centers.17-19 Our analytic sample included 1248 of these participants for whom the following data had also been collected: race as reported by the participant, genetic ancestry markers, and serum creatinine, serum cystatin C, and 24-hour urinary creatinine levels (Fig. S1 in the Supplementary Appendix, available with the full text of this article at NEJM.org). The CRIC study was approved by the institutional review boards at the participating sites. All the participants provided written informed consent, which included consent to participate in secondary analyses such as the current study.
Study Design and OversightThe overall goals of our study were to determine whether we could accurately estimate GFR without including race. We considered three alternatives (Fig. S2). First, we examined whether we could replace race with a quantitative measure of genetic ancestry in GFR estimation. Second, we evaluated whether we could replace race in GFR estimation by accounting for determinants of serum creatinine that are unrelated to GFR and that vary according to race. Third, we assessed whether we could eliminate the need to consider race — and genetic ancestry, given findings from our first set of analyses — in GFR estimation by replacing the use of serum creatinine with serum cystatin C as the glomerular filtration marker.
The manuscript was written by the CRIC study investigators without external assistance. The study was designed by the CRIC steering committee. Data were collected by the seven CRIC clinical centers, and data analysis was performed at the Kaiser Permanente Northern California–University of California, San Francisco CRIC Clinical Center and the CRIC Scientific and Data Coordinating Center at the University of Pennsylvania. The decision to submit the manuscript for publication was made by all the authors and approved by the CRIC publication executive committee and steering committee. The authors had complete access to the data.
Study VariablesVariables that were used in this analysis included race reported by the participant, demographic characteristics, the percentage of genetic African ancestry, body-composition metrics (body-mass index [BMI], height, weight, body-surface area, bioelectrical impedance analysis phase angle, and bioelectrical impedance analysis–quantified fat-free mass), reported and calculated daily dietary protein intake, 24-hour urinary excretion of creatinine, estimates of tubular secretion of creatinine calculated from the creatinine clearance and measured GFR, serum creatinine level, serum cystatin C level, and measured GFR level. Specific assays and collection methods for all measurements, including a detailed description of assignment of genetic ancestry, are provided in Table S1 and the Supplementary Methods section in the Supplementary Appendix.
Statistical AnalysisAll analyses were conducted with the use of SAS software, version 9.4 (SAS Institute) at Kaiser Permanente Northern California (Oakland) and independently replicated at the University of Pennsylvania (Philadelphia). We used standardized differences (Cohen’s D statistic for continuous and binary variables and Cramér’s V statistic for categorical variables) to compare distributions of African or European ancestry and other characteristics among participants who identified as Black or non-Black. We then conducted a series of analyses to address the three alternatives to estimate GFR without including race. Measured GFR was log-transformed when it was the outcome of the model; therefore, coefficients for race or ancestry were exponentiated and reported as percent changes for interpretability on the original scale of the outcome. In addition, the serum creatinine level and the cystatin C level were log-transformed in all models.
First, to examine the potential usefulness of genetic ancestry in GFR estimation, we used random sampling to categorize the data into development (67%) and validation (33%) data sets within each race or ethnic group category as reported by the participants (Black, White, or other race or ethnic group). We then combined the data sets to form one final development data set and one validation data set with equal distributions of race or ethnic group as reported by the participants. For our analyses, we combined the White and “other race or ethnic group” categories into a “non-Black” category because of the relatively small number of participants with other race or ethnic group. As a sensitivity analysis, we also performed the analyses using 10-fold cross-validation of the full sample. We first used the development data set to derive GFR estimating equations with linear regression for measured GFR with the serum creatinine level, age, and sex (i.e., the variables in the widely used Chronic Kidney Disease Epidemiology Collaboration [CKD-EPI]10 and Modification of Diet in Renal Disease [MDRD] study equations11). Race and African ancestry were then added individually in separate models. We then applied all derived equations to the validation data set to estimate GFR, and we compared performance using the root-mean-square error (RMSE) calculated in the original GFR scale, the difference between measured and estimated GFR (i.e., statistical bias) and its interquartile range (i.e., precision), and the proportion of estimated GFRs within 10% of measured GFR (termed P10) and within 30% of measured GFR (termed P30) (i.e., accuracy). We constructed 95% confidence intervals using the 2.5th and 97.5th percentiles from 1000 bootstrapped samples of the validation data set. We also explored the possible added value of interaction terms between race or African ancestry and the serum creatinine level.
Second, to assess whether non-GFR determinants of serum creatinine were independently associated with race or genetic ancestry, we used the full sample to perform multivariable linear regression to separately examine the association of race or African ancestry with measures of body composition, dietary protein intake, 24-hour urinary excretion of creatinine, and tubular secretion of creatinine, with adjustment for age, sex, and measured GFR level. Models of tubular secretion of creatinine were not adjusted for measured GFR because estimates of secretion relied on measured GFR in their calculation. We then assessed whether any of these non-GFR determinants of serum creatinine that differed according to race or ancestry could replace Black race or African ancestry in estimating GFR. We did this by evaluating the degree to which these factors attenuated the strength of association of the Black race or African ancestry coefficient in linear models for measured GFR that included the serum creatinine level, Black race or African ancestry, age, and sex. We evaluated individually each non-GFR determinant of serum creatinine that differed according to race as reported by the participants, and we also evaluated all possible combinations to obtain a final model that maximized the attenuation of the Black race or African ancestry coefficient.
Third, we repeated analyses using serum cystatin C as an alternative marker of glomerular filtration. We first used the full sample to examine the independent associations of Black race and African ancestry with serum cystatin C, after adjustment for age, sex, and measured GFR. Next, we used the same development and validation data sets described above first to derive (in the development data set) GFR estimating equations with cystatin C, age, sex, and either a term for Black race or African ancestry and then to evaluate model performance (in the validation data set).
留言 (0)