
記住我

More than 50 million people live with dementia worldwide, and it is estimated that this figure will reach 152 million by 2050 [1]. Alzheimer's disease (AD) is the most common cause of dementia and is characterized by impairment of learning and memory. Neuropathologically, the intracellular accumulation of hyperphosphorylated tau protein (pTau) as neurofibrillary tangles (NFT) and neuropil threads, together with the extracellular accumulation of amyloid-β (Aβ) in the core of the neuritic plaque, are considered the molecular and morphologic signatures of AD [2, 3]. Currently, the NIA-AA criteria, which include the Thal phase, Braak neurofibrillary stage, and CERAD plaque score are used for the neuropathological diagnosis of AD [3]. Although the Thal phase [4] and CERAD plaque score [5] apply to the presence and distribution of Aβ deposits, the Braak neurofibrillary stage [] refers to the hierarchical progression of neurofibrillary tau pathology (NFP).
AD belongs to the group of tauopathies which are diseases characterized by abnormal aggregation of the microtubule-associated protein tau (MAPT) in neurons and/or glial cells [7]. In neurons, tau plays an essential role in stabilizing microtubules, but it is also implicated in other cellular functions such as signal transduction, interaction with the actin cytoskeleton, neuronal activity, and synaptic plasticity [8]. Tauopathies are classified according to the predominant tau isoform pattern. There are six known isoforms of tau protein expressed in the adult human brain. There are equal amounts of tau isoforms with three or four repetitive (3R or 4R) domains in the normal brain, while the ratio is altered in neurodegeneration [7, 9]. For example, AD belongs to Class I (tau lesions contain equal amounts of 3R and 4R isoforms), progressive supranuclear palsy (PSP), and corticobasal degeneration (CBD) belongs to Class II (tau lesions mainly composed of 4R isoforms), and, finally, Pick's disease (PiD) belongs to Class III (tau lesions mainly composed of 3R isoforms) [7]. While AD only shows pTau inclusions in neurons [9, 10], other tauopathies, such as PiD, PSP and CBD, display both neuronal and extensive glial pTau inclusions [9]. From a clinical point of view, these diseases can present as frontotemporal dementias or atypical parkinsonisms [7].
Although still under debate, different evidences support the idea that Aβ deposition is a major event in AD pathogenesis, inducing or intensifying the generation of NFT, neuronal loss, vascular damage, and neuroinflammation [11]. The Aβ peptide is the product of the processing of the amyloid precursor protein (APP) by β- and γ-secretases, which gives rise mainly to the Aβ40 and Aβ42 peptides. Some of the evidence supporting the “amyloid cascade hypothesis” is the early occurrence of pathology in individuals carrying autosomal-dominant mutations in genes encoding APP or the γ-secretase complex proteins presenilin 1/2 (PSEN1/2) and a high AD prevalence in individuals with Down syndrome, an event attributed to the triplication and overexpression of the APP gene located on chromosome 21 [11]. However, Aβ aggregation and accumulation correlate poorly with cognitive symptoms and neurodegeneration [12-15]. The assessment of amyloid and tau by PET imaging suggests that the rate of amyloid deposition predicts the onset of tau accumulation, whereas the degree of tau deposition is related to cognitive impairment [16, 17]. Indeed, different studies have shown that cognitive decline in AD starts when tau spreads from the entorhinal cortex into the neocortex [18, 19], and the stage of tau pathology strongly correlates with the progression of cognitive impairment [14, 15, 20]. Taken together, these findings suggest that neurodegeneration and cognitive impairment in AD might be driven by the onset and spread of tau pathology.
Through genome-wide association studies (GWAS), different susceptibility loci have been identified for AD, including variants in the CD2AP gene [21-26], which encodes the CD2-associated protein (CD2AP). CD2AP is a scaffold protein that controls actin dynamics and is expressed in neurons [27] and endothelial cells of blood–brain vessels [28-30]. A link between defects in CD2AP and glomerular pathology has been described [31]; however, little is known about the function of CD2AP in the brain. In particular, beyond the association of several CD2AP polymorphisms with AD risk in both early onset (rs9473117 [32] and rs9381563 [33]) and late onset AD (rs9349407 [23, 34, 35], rs10948363 [25, 36, 37] rs9296559 [23, 38] and rs9349407 [39]) the precise role of the CD2AP protein in this disease is still undiscovered. In this regard, the main goal of the present study was to analyze CD2AP distribution in the AD brain and the potential association of CD2AP with tau aggregation, Aβ deposition, and localization in AD, as well as in other tauopathies.
2 MATERIAL AND METHODS 2.1 Selection of patientsBrain tissue samples were obtained from 81 autopsies carried out at the Pathology Department of Vall d’Hebron University Hospital (HUVH, Barcelona) (Cohort A) and the Center for Research in Neurological Diseases (CIEN Foundation, Madrid) (Cohort B). This series of patients included 45 with AD neuropathological change (≥B1) and 21 with a tauopathy other than AD (seven cases of PiD, nine cases of PSP, and five cases of CBD); 15 cases without pTau deposition were included as control cases. All patient characteristics are presented in Table 1. Patients included in this study, or their relatives, expressed their willingness to donate brain tissue for research purposes and were donors to the Neurological Tissue Bank of the HUVH or to the CIEN Foundation Brain Bank. The project was approved by the Clinical Research Ethics Committee of the Vall d’Hebron University Hospital, Barcelona, Spain (PR (IR) 173/2019).
TABLE 1. Demographic characteristics of Cohort A (Vall d’Hebron University Hospital), Cohort B (CIEN Foundation) and the compilation of the two cohorts (total cohort) Cohort Alzheimer's disease Control PSP CBD PiD p-value A B Total A B Total B B B N 17 28 45 6 9 15 9 5 7 Age 77.8 ± 8.3 79.6 ± 12.2 78.9 ± 10.8*** 59.2 ± 12.4 62.9 ± 8.6 61.4 ± 10.0 74.2 ± 9.1 * 72.4 ± 8.6 75.1 ± 9.7* <0.001 Sex (females) 10 (58.8%) 18 (64.3%) 28 (62.2%) 2 (33.3%) 5 (55.6%) 7 (46.7%) 4 (44.4%) 2 (40.0%) 3 (42.9%) 0.580 Note Statistical differences were analyzed among total cohorts between disease groups. Bold numbers indicate statistically significant differences. *** p < 0.001 vs the control group. * p < 0.05 vs the control group.For specific comparative purposes, patients with other neurodegenerative diseases were analyzed, all the brain donors to one of the two biobanks. Two cases of Parkinson disease (PD), two cases of Multisystem atrophy (MSA), one case of Amyotrophic lateral sclerosis (ALS) without cognitive impairment, one case of Frontotemporal lobar degeneration-ALS with C9orf72 mutation and p62 positive inclusions in the cerebellar granular layer (FTLD-ALS), and two cases of primary age-related tauopathy (PART) with a Braak III neurofibrillary stage (B2). Clinic-pathologic data of these patients are summarized in Table S1.
2.2 pTau and Aβ assessment in AD cases and controlsAll samples were obtained 2–20 hours after death and fixed in 10% buffered formalin from 4 to 10 weeks. Macroscopic examination of the brain was then performed, and 27 cortical and subcortical areas, including the brainstem and cerebellum, were selected for routine histologic diagnosis. The paraffin blocks were cut into 3 µm sections and stained with hematoxylin and eosin. From each case, sections from the frontal, temporal, parietal, and occipital lobes and the hippocampus, amygdala, brain stem, and cerebellum were analyzed by immunohistochemistry using a mouse anti-Amyloid-β antibody (Clone 6F/3D 1: 500, Dako, Glostrup, Denmark) and a mouse anti-Tau antibody (Clone AT8 1:20, Thermo Scientific, Rockford, USA).
For the AD patients, AD neuropathologic changes were evaluated and staged according to the NIA-AA criteria [3]. Accordingly, cases with Braak I or II neurofibrillary stages were reclassified as B1, Braak III or IV as B2, and Braak V or VI as B3. Aβ deposits initially scored from 0 to 5 (Thal phases [4] were reclassified as A0 [Thal 0], A1 [Thal 1 or 2], A2 [Thal 3], or A3 [Thal 4 or 5]). CERAD plaque score A to C were transformed into C1 (CERAD A), C2 (CERAD B), or C3 (CERAD C) [5]. The combination of these three grading systems gives an “ABC score” that indicates a low, intermediate, or high probability that dementia was caused by AD changes or that there were no AD-related changes [3].
2.3 pTau assessment in other tauopathiesTwenty-one cases of sporadic tauopathies other than AD were included in the study: seven cases of PiD, nine cases of PSP, and five cases of CBD. PiD, PSP, and CBD cases were diagnosed when characteristic pathologic changes were found. PiD is a 3R tauopathy histologically defined by the presence of round neuronal argyrophilic inclusions known as Pick bodies. Thorn-shaped and ramified astrocytes and small globular oligodendroglial inclusions may be found. PSP and CBD are 4R tauopathies with different topographies and pathologic changes, although some overlap in regional distribution may exist. PSP pathology is predominant in the hindbrain, and its characteristic findings include neuronal (globose tangles) and astrocytic pTau inclusions (tufted astrocytes). CBD pathology predominates in the forebrain and is characterized mainly by astrocytic pTau positivity (astrocytic plaques). PSP and CBD both exhibit pretangles in neurons and coiled bodies in oligodendroglial cells [9]. In these cases, pTau immunohistochemistry was performed as described in Section 2.2.
2.4 CD2AP ImmunohistochemistryFour brain regions were selected to evaluate CD2AP immunostaining in AD and control cases: the anterior hippocampus, posterior hippocampus, temporal lobe, and occipital lobe. In PiD, PSP, and CBD cases, different brain regions were selected: the frontal and parietal lobes for all cases and areas with a strong load of pathology: midbrain for CBD, midbrain, basal ganglia, and pons for PSP, and posterior hippocampus for PiD cases. We selected substantia nigra from PD cases, cerebellum from MSA, the spinal cord from ALS cases, and cerebellar cortex from the FTLD-ALS with C9orf72 mutation case and posterior hippocampus from PART cases. Paraffin blocks of the selected areas were cut into 3 µm sections and stained with the rabbit anti-CD2AP antibody (Clone HPA003326, 1:200, Sigma-Aldrich, St. Louis, USA) using the Benchmark XT staining module with the ultraView Universal DAB Detection Kit (Ventana Medical Systems). Deparaffinization was carried out using EZ PrepTM solution. The primary antibody was incubated for 40 min at a 1/200 dilution and localized by a secondary antibody HRP Multimer containing a cocktail of HRP-labeled antibodies (mouse and rabbit antibodies to IgG and IgM). The resulting complex was then visualized using DAB Chromogen and finally counterstained with Hematoxylin and Bluing Reagent. The positivity of the staining was confirmed by the absence of signal when the primary antibody was omitted (negative controls). CD2AP expression was evaluated in vascular walls (meningeal and cortical arteries and capillaries), neurons, astrocytes, oligodendrocytes, endothelium, and parenchymal deposits in all samples. In these cases, CD2AP evaluation was performed blinded to the specific disease.
To study the possible association of neuronal CD2AP deposition with pTau protein, the “B” score of the NIA-AA guidelines [3, 6] was used to grade CD2AP deposits in AD and control cases. Thus, the score CD2AP-0 was given to cases without any CD2AP deposits, CD2AP-1 was given to cases with Braak Stage I-analog (NFP of at least low density in the transentorhinal region) or Braak Stage II-analog (NFP of at least moderate density in the outer layers of the entorhinal region and at least low density in the inner layers of the entorhinal region) CD2AP distribution, CD2AP-2 was given to cases with Braak Stage III-analog (NFP of at least moderate density in the superficial and deep layers of the occipitotemporal gyrus, even in a small region of the occipitotemporal gyrus adjoining the transentorhinal region) or Braak Stage IV-analog (NFP of at least moderate density in the superficial and/or deep layers of the middle temporal gyrus) CD2AP distribution, and finally, CD2AP-3 was given to cases with Braak Stage V-analog (NFP of at least moderate density in the superficial and deep layers of the peristriate and often also the parastriate area) or Braak Stage VI-analog (NFP of at least moderate density in layer V of the striate area) CD2AP distribution. All cases were evaluated blinded to Braak neurofibrillary stage.
2.5 ImmunofluorescenceThe presence of CD2AP and pTau was evaluated by immunofluorescence in 3-µm-thick paraffin-embedded human brain slides. Brain sections were deparaffinized, hydrated, and incubated with citrate buffer for 30 min at 95°C to improve antigen exposure. The sections were blocked for 1 h at room temperature (RT) and incubated overnight with mouse anti-Tau AT8 antibody (5 μg/ml, Thermo Fisher) or mouse anti-AT100 antibody (2 µg/ml, Thermo Fisher) and rabbit anti-CD2AP antibody (1 μg/ml, Sigma-Aldrich). After rinsing, the samples were incubated with Alexa Fluor-568 anti-mouse IgG and Alexa Fluor-488 anti-rabbit IgG secondary antibodies (Life Technologies) diluted 1:500 in blocking solution for 1 h at room temperature. To reduce brain tissue autofluorescence, brain sections were then incubated with 0.3% Sudan Black B (Sigma-Aldrich) for 10 min. Finally, samples were dehydrated and mounted on coverslips using Vectashield with 4′,6-diamidino-2-phenylindole (DAPI, Vector Laboratories). Double immunofluorescence images were captured with a Zeiss LSM980 confocal microscope. The percentage of CD2AP immunoreactivity was evaluated as the total number of CD2AP positive neuronal inclusions in pTau-AT8 positive NFT in five fields (20x magnification).
2.6 Next generation immunohistochemistryNext generation immunohistochemistry (NGI) was used for coexpression analyses. Briefly, NGI consists of sequential immunohistochemical stainings on the same tissue section by destaining the alcohol-soluble chromogen between the stainings, digitalization, and alignment of the images to finally obtain the information of different biomarkers in the same cells (virtually assigning colors for each antibody). This methodology is already validated and used for different panels [40, 41]. Antibodies and protocols used in this study are as follows: mouse anti-3R-TAU antibody (Clone 05-803, 1:50, Sigma–Aldrich, St. Louis, USA), mouse anti-4R-TAU antibody (Clone 05-804, 1:50, Sigma-Aldrich, St. Louis, USA), and rabbit anti-CD2AP antibody (Clone HPA003326, 1:200, Sigma-Aldrich, St. Louis, USA).
2.7 Statistical analysisAll statistical analyses were conducted using SPSS Statistics, version 21 (IBM Corporation). The association of categorical variables was analyzed using contingency tables and a chi-squared test with the Pearson p-value. The distribution of age was tested using the Kolmogorov–Smirnov test. When the data were normally distributed, variables were expressed as the mean ± standard deviation (SD), and an ANOVA test with a Bonferroni correction for multivariate analysis was applied. When the data were not normally distributed, variables were expressed as the median (interquartile range), and a Mann–Whitney U test was applied. Univariate associations of the CD2AP score with categorical variables were also determined using contingency tables and a chi-squared test. In this case, the Pearson p-value was used for sex, whereas the Linear-by-Linear Association p-value was used for Thal phase, Braak neurofibrillary stage, CERAD plaque score, and AD risk. The association of the CD2AP score with the continuous variable age was tested by applying a Kruskal–Wallis test. Regression analysis of categorical data (CATREG) was performed using only the significant variables of the univariate analysis. The standardized coefficients beta with the corresponding estimate of standard error (SE) and p-value were obtained and displayed. A p-value below 0.05 was considered statistically significant.
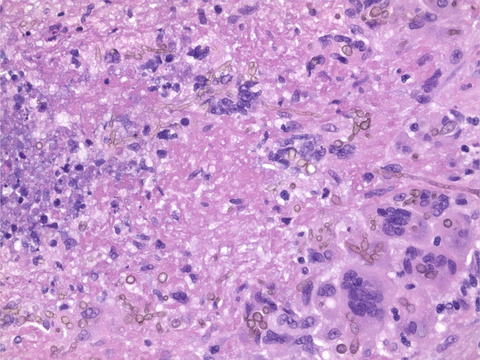
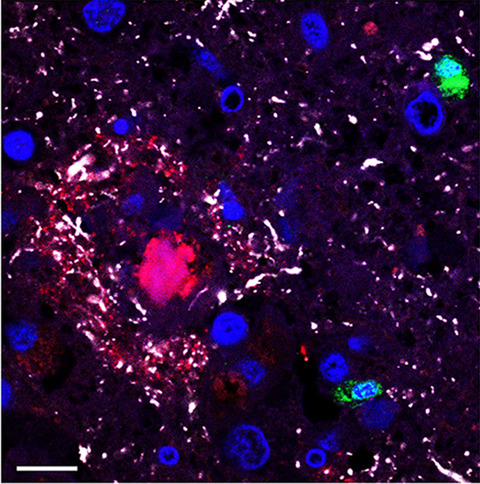
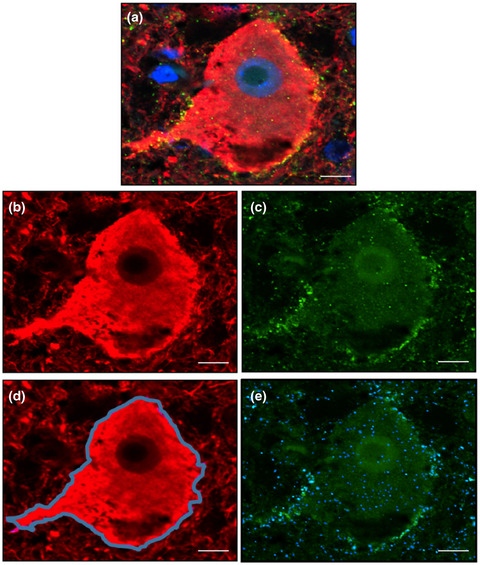
3 RESULTS 3.1 CD2AP immunopositivity in AD casesThe distribution of CD2AP immunoreactivity and its potential association with pTau and Aβ pathology were analyzed in cortical areas of postmortem AD brain samples from Cohort A. CD2AP neuronal deposits resembling neurofibrillary tangles and occasional tortuous fibers resembling neuropil threads were found in cases with AD pathology in regions showing pTau pathology, as depicted in consecutive sections of the entorhinal region in Figure 1A,B. However, no evident CD2AP-positive dystrophic neurites were found (Figure 1C,D). No vascular wall or parenchymal CD2AP deposits were identified in areas with parenchymal and vascular Aβ deposition (as shown in consecutive cortical levels in Figure 1E–H). However, in all cases, mild granular endothelial and red blood cells CD2AP positivity was detected. To further study the association found, immunofluorescence double staining of CD2AP and pTau-AT8 was performed in AD cortical sections (Figure 2). The results confirmed that CD2AP colocalized with pTau-AT8 (Ser202/Thr305), as shown by cytoplasmic intraneuronal deposits in pyramidal neurons and occasional neuropil thread-like structures (Figure 2A,B). In AD cases, no CD2AP immunoreactivity was found independent of pTau-AT8 and the percentage of CD2AP positivity in pTau-AT8 deposits was 76 ± 6%. At a higher magnification, this colocalization with pTau was shown to be incomplete, and CD2AP expression displayed a discontinuous granular pattern (Figure 2B). Furthermore, double immunofluorescence staining of CD2AP and pTau-AT100 indicated that CD2AP also co-localized with pTau (Thr212/Ser214) in AD sections (Figure 2C).

Representative images of consecutive sections from AD brains (A–B, C–D, E–F and G–H). (A and C) pTau-AT8 was detected in neurofibrillary tangles in pyramidal neurons and neuropil threads in dendrites (red and green arrows, respectively) and dystrophic neurites (red asterisks). (B and D). CD2AP-positive inclusions were present in pyramidal neurons (red arrows) and occasional neuropil thread-like deposits (green arrows), and granular CD2AP positivity was detected in endothelial cells (black arrowheads). No dystrophic neurites of neuritic plaques were stained with CD2AP. (E, G) Aβ immunostaining demonstrated parenchymal and vascular deposits. (F, H) CD2AP immunohistochemistry showed no parenchymal or vascular positivity in those areas. Only endothelial and red blood cells were positive for CD2AP (black and green arrowheads, respectively). C, D, G, and H: Scale bars = 20 µm. A, B, E, and F: Scale bars = 50 µm

Confocal evaluation of CD2AP/pTau-AT8 (A and B) and CD2AP/pTau-AT100 (C) distribution in cortical brain sections from AD patients. Representative confocal images showing the colocalization of pTau (red) and CD2AP (green) in the neuronal cytoplasm and neuropil threads in a case with B3 and CD2AP-3 scores. Merged images show the colocalization of pTau and CD2AP (yellow). Scale bars = 10 μm
The next step was to confirm the association between pTau and CD2AP distribution in AD cases and controls. For this purpose, we enlarged the series of patients by adding a second cohort of AD and non-AD patients (Cohort B, Table 1). Equal numbers of cases from different Braak neurofibrillary stages were included in the total cohort (N = 60). No significant differences regarding age or sex were found between cohorts. Considering the two cohorts together, AD patients were significantly older than control patients (78.9 ± 10.8 vs 61.4 ± 10, p < 0.001), but no differences were found regarding sex (Table 1). Braak neurofibrillary stage evaluation with Thal phase and CERAD plaque score allowed the assignment of “ABC scores” and an AD risk evaluation [3]. The two cohorts were neuropathologically equivalent, as no significant differences were found in the frequency of cases classified according to Thal phase, Braak neurofibrillary stage, or CERAD plaque score, considering AD cases and controls separately (Table 2). Based on these evaluations, 48.4% of total cases (29/60) fulfilled the criteria for intermediate (16/60) or high (13/60) levels of AD neuropathologic changes.
TABLE 2. Demographic and pathologic description of Alzheimer's diseases (AD) cases and controls from Cohort A (Vall d’Hebron University Hospital) and Cohort B (CIEN Foundation). Alzheimer's disease Controls p-value (AD vs Controls) Cohort A Cohort B p-value Total Cohort A Cohort B p-value Total N 17 28 45 6 9 15 Braak 0.910 N/A <0.001 B0 — — — 6 (100%) 9 (100%) 15 (100%) B1 6 (35.3%) 9 (32.1%) 15 (33.3%) — — — B2 6 (35.3%) 9 (32.1%) 15 (33.3%) — — — B3 5 (29.4%) 10 (35.7%) 15 (33.3%) — — — Thal 0.068 0.205 <0.001 A0 4 (23.5%) 3 (10.7%) 7 (15.6%) 5 (83.3%) 9 (100%) 14 (93.3%) A1 1 (5.9%) 5 (17.9%) 6 (13.3%) 1 (16.7%) — 1 (6.7%) A2 7 (41.2%) 4 (14.3%) 11 (24.4%) — — — A3 5 (29.4%) 16 (57.1%) 21 (46.7%) — — — CERAD 0.123 0.205 <0.001 C0 4 (23.5%) 10 (35.7%) 14 (31.1%) 5 (83.3%) 9 (100%) 14 (93.3%) C1 6 (35.3%) 2 (7.1%) 8 (17.8%) — — — C2 2 (11.8%) 4 (14.3%) 6 (13.3%) 1 (16.7%) — 1 (6.7%) C3 5 (29.4%) 12 (42.9%) 17 (37.8%) — — — AD risk 0.254 0.205 <0.001 Nonrelated 5 (29.4%) 3 (10.7%) 8 (17.8%) 5 (83.3%) 9 (100%) 14 (93.3%) Low 2 (11.8%) 6 (21.4%) 8 (17.8%) 1 (16.7%) — — Moderate 7 (41.2%) 9 (32.1%) 16 (35.6%) — — — High 3 (17.6%) 10 (35.7%) 13 (28.9%) — — — CD2AP 0.422 N/A <0.001 0 4 (23.5%) 6 (21.4%) 10 (22.2%) 6 (100%) 9 (100%) 15 (100%) 1 9 (52.9%) 12 (42.9%) 21 (46.7%) — — — 2 3 (17.6%) 3 (10.7%) 6 (13.3%) — — — 3 1 (5.9%) 7 (25.0%) 8 (17.8%) — —
留言 (0)