
記住我
Testosterone, a steroid hormone synthesized mainly in Leydig cells of the testis, is essential for various physiological processes, including the development of secondary sexual characteristics in males, the maintenance of muscle strength and growth, sexual function, metabolic and cardiovascular health, and bone mineral density (Iliescu and Reckelhoff, 2006; Dimopoulou et al., 2018; Mohamad et al., 2016; Griggs et al., 1989; Killinger, 1970). Low serum testosterone levels in men can result in dysfunction across multiple organ systems. Low testosterone is associated with decreased libido, erectile dysfunction, and muscle weakness (Rastrelli et al., 2018; O'Connell and Wu, 2014). Furthermore, it can contribute to or worsen metabolic diseases, including metabolic syndrome and osteoporosis (Kupelian et al., 2006; Walsh and Eastell, 2013). Men exhibiting symptoms of testosterone deficiency are at an increased risk for developing coronary artery disease, type 2 diabetes, and hypertension (Colangelo et al., 2009; Ruige et al., 2011). Testosterone deficiency is prevalent, impacting approximately 30% of men between the ages of 40 and 79. Its occurrence escalates with advancing age and is associated with various medical conditions, including obesity, diabetes, and hypertension (Traish et al., 2011). This is projected to rise in the coming decades due to increasing life expectancy (Halpern and Brannigan, 2019). Testosterone deficiency is increasingly recognized as a global issue.
AIP was introduced by Dobiasova and Frohlich in 2001 as a biomarker for plasma atherosclerosis (Dobiásová and Frohlich, 2001). It integrates triglycerides (TG) and high-density lipoprotein cholesterol (HDL-C) levels, reflecting both the particle size of lipoproteins and the log (TG/HDL-C). This ratio serves as a more precise indicator of the specificity and pathogenicity of dyslipidemia (Fernández-Macías et al., 2019). Numerous studies indicate that elevated AIP is significantly linked to cardiovascular disease (CVD) mortality, overall mortality, and hypertensive populations (Qin and Chen, 2024; Duiyimuhan and Maimaiti, 2023). Additionally, AIP serves as a reliable predictor of cardiovascular events and mortality resulting from these events (Onat et al., 2010; Dobiásová, 2006).
Numerous clinical studies have demonstrated a biological link between lipids and sex hormones, revealing an association between TG and HDL-C with TT: Heller identified a consistently positive correlation between HDL-C and TT concentration in a sample of 295 middle-aged men (Heller et al., 1983); Sook et al. reported that among 8,606 Korean male workers, those with low testosterone levels exhibited a higher likelihood of hypertriglyceridemia (Sung et al., 2019); a meta-analysis confirmed a significant association between low testosterone levels and hypertriglyceridemia (Brand et al., 2014); Chung et al. examined 1,055 Korean men aged 45 years and older, revealing a negative correlation between the TG/HDL ratio and TT levels (Chung et al., 2020).
Nonetheless, the existing research presents certain limitations. The current studies are restricted to specific elderly or regional populations, leaving the relationship with the overall male population ambiguous. No studies effectively combine TG and HDL-C to examine their relationship with testosterone. Despite extensive research on the relationship between AIP and CVD, there is a lack of data specifically examining the association between AIP and testosterone levels. The relationship between lipid metabolism and sex hormones suggests a correlation between AIP and testosterone.
This study addresses knowledge gaps by utilizing a comprehensive NHANES dataset and conducting a cross-sectional survey to evaluate the relationship between AIP and TT and TD in adult men in the US. We postulated that there would be a negative and positive correlation, respectively, between AIP and TT and the occurrence of TD.
2 Methods2.1 Database and survey populationsData were utilized from the 2011–2016 cycles of the NHANES. The National Center for Health Statistics of the Centers for Disease Control and Prevention conducts the NHANES, which employs a multistage, complex summary, stratified probability sampling design to select representative samples of adults and children from the noninstitutionalized U.S. population for the assessment of their nutritional status. 29,902 participants were included in these cycles. The selected cycles are based on the availability of data regarding total testosterone levels, which is limited to the period from 2011 to 2016. The analysis excluded 15,151 female subjects, 4,127 subjects with incomplete total testosterone data, 6,331 subjects lacking data necessary for AIP calculation, and 1,721 subjects with missing covariate data. Ultimately, 2,572 subjects were included in the final analysis (Figure 1).
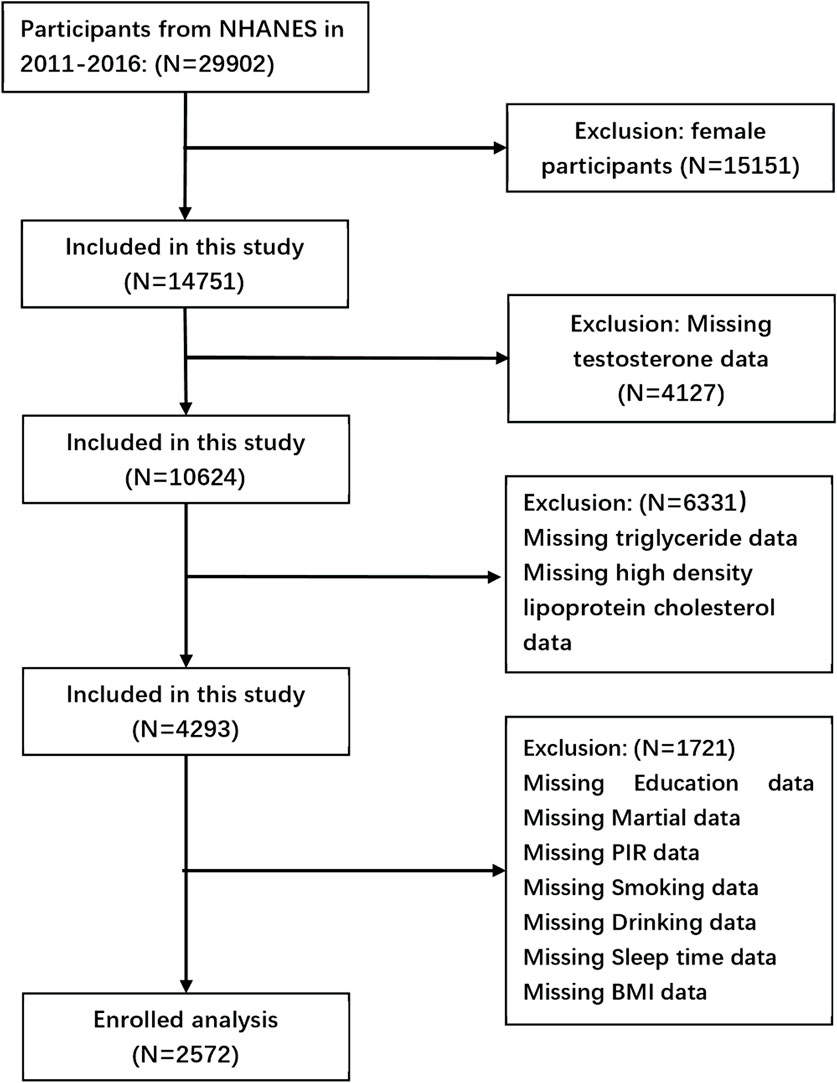
Figure 1. Flow chart of the screening process for the selection of eligible participants.
2.2 Informed consentNHANES is a dataset that is accessible to the public. Before starting any official inquiry, all participants must give both written and verbal agreement to take part in the research. The study has undergone evaluation and received approval from the ethical review committee of the National Centre for Health Statistics (NCHS). The NCHS IRB/ERB protocol number for 2011–2016 was #2011–17. The website (https://www.cdc.gov/nchs/nhanes/) provides access to all pertinent data.
2.3 AIP evaluationAIP was defined as a LOG10 (TG/HDL-C) ratio (Onat et al., 2010).
2.4 Assessment of outcome—TT and TDAccording to American Urological Association guidelines, TD are characterized by serum testosterone levels <300 ng/dL (Mulhall et al., 2018). The Centres for Disease Control and Prevention (CDC) developed an isotope dilution liquid chromatography tandem mass spectrometry (ID-LC-MS/MS) technique to measure the levels of total testosterone in serum for routine examination. This method has been particularly designed for samples with a high rate of flow, and has consistently shown a high level of accuracy and precision over a long period of time. The technique has received certification from the CDC Hormone Standardisation Programme (HoSt) and can be traced back to certified reference material acquired from the Australian National Measurement Institute (ANMI) M914 for testosterone. For a comprehensive examination of quality control and quality assurance in the NHANES laboratory and medical technical personnel manual of procedure (LPM), please refer to the following link: https://wwwn.cdc.gov/nchs/data/nhanes/2013-2014/labmethods/TST_H_MET_Tota L_Estradiol_and_Total_Testosterone.
2.5 Definition of other variablesThe multivariate model considered potential variables that may confound the association between AIP and testosterone, as indicated by prior studies (Cao et al., 2024; Guo et al., 2024; He et al., 2024; Hernández-Pérez et al., 2024). The covariates were age, BMI (≤24.9, 25–29.9, ≥30 kg/m2), race (non-Hispanic white, non-Hispanic black, Mexican American, other Hispanic, other races), marital status, family income to poverty ratio (PIR), smoking status, drinking status, education status (below high school, completed high school, high school above), hypertension, diabetes, physical activity, and sleep time (<7 h, 7–9 h, >9 h). Smoking status was classified as never, former, or current smoker according to “at least 100 cigarettes in your lifetime” and “are you a current smoker”. Alcohol consumption was determined according to “at least 12 alcoholic beverages per year?”, “At least 12 alcoholic drinks in your lifetime? “And” frequency of alcohol consumption in the past 12 months “to classify as never, former, and current drinking”.
Hypertension is diagnosed based on several factors, including a history of previous diagnosis of the condition, current use of medication to lower blood pressure, or exhibited systolic or diastolic blood pressure ≥140/90 mmHg. Participants were classified as having diabetes if they received a diagnosis from a physician, exhibited a fasting plasma glucose level of ≥126 mg/dL, utilized insulin or medication for glycemic management, or had a glycated hemoglobin level of ≥6.5. Physical activity was classified into vigorous, moderate, and inactive, based on the subjects’ engagement in activities that induced profuse sweating or a significant increase in breathing or heart rate, as well as those that led to slight sweating or a moderate increase in heart rate. We considered vigorous physical activity if participant reported to do any activity that caused heavy sweating or large increases in breathing or heart rate (e.g., swimming, aerobics, or fast cycling). Moderate physical activity included activities that caused light sweating or a moderate increase in the heart rate, such as playing golf, dancing, bicycling for pleasure, or walking.
2.6 Statistical analysesAs recommended by the NHANES Guidelines (Chen et al., 2018; Chen et al., 2020), appropriate weighting techniques were used to address the intricacies of the sample design to ensure that the obtained data were representative at the national level. All data analyses in this study were weighted appropriately, following the rigorous methodology outlined in the official NHANES documentation (https://wwwn.cdc.gov/nchs/nhanes/tutorials/weighting.aspx).
In this study, continuous data were represented as weighted means ± standard deviations, whilst categorical variables were represented as weighted proportions. The comprehensive AIP data were segmented into quartiles (Qs): Q1 (<−0.234), Q2 (−0.234, −0.012), Q3 (−0.012, 0.221), Q4 (>0.221), with Q1 designated as the minimum value. Disparities among various AIP groups (quartiles) were assessed utilizing chi-square tests for categorical variables and t-tests for continuous ones. Weighted linear regression and logistic regression studies were conducted to evaluate the relationship between AIP and the continuous values of TT levels and TD. Three models were employed in the study to account for covariates: Model 1 was unadjusted, Model 2 was adjusted for age, race, education, PIR, and marital status, while Model 3 included adjustments for BMI, diabetes, hypertension, physical activity, and sleep time, in addition to the adjustments made in Model 2. Subsequently, limited cubic spline curves derived from regression model 3 were employed to investigate any nonlinear association between AIP and testosterone. Furthermore, stratified analyses were conducted based on distinct age categories (20–39, 40–59, ≥60 years), including the history of chronic diseases (hypertension and diabetes), BMI, and physical activity, with their interactions evaluated by log-likelihood ratio tests. Sensitivity tests utilizing unweighted data were conducted to verify the robustness of the weighted estimates. Statistical analyses were conducted using R (http://www.R-project.org, The R Foundation) and Free Statistics software version 1.3. Statistical differences were established with two-tailed p values < 0.05.
3 Results3.1 Demographic and clinical characteristics of study participantsA total of 2,572 individuals participated in the study. Table 1 presents the baseline characteristics of each group. The weighted sample of 85, 70, 426 participants across the three survey cycles accurately represents the uninstitutionalized U.S. population, predominantly consisting of non-Hispanic whites (69.81%). The average age of the respondents was 46.66 ± 16.31 years, and the average TT level was 455.06 ± 187.74 ng/dL. Participants in Q4 exhibited the lowest testosterone level of 387.19 ± 158.05 ng/dL. They had a higher propensity for obesity (51.66%) and physical inactivity (52.43%). Statistically significant variations were seen in TT, TG, HDL-C levels, BMI, race, smoking status, diabetes, hypertension, and physical activity among the four groups of AIP patients (P < 0.05). As the AIP level rises, the prevalence of patients with diabetes and hypertension escalates.
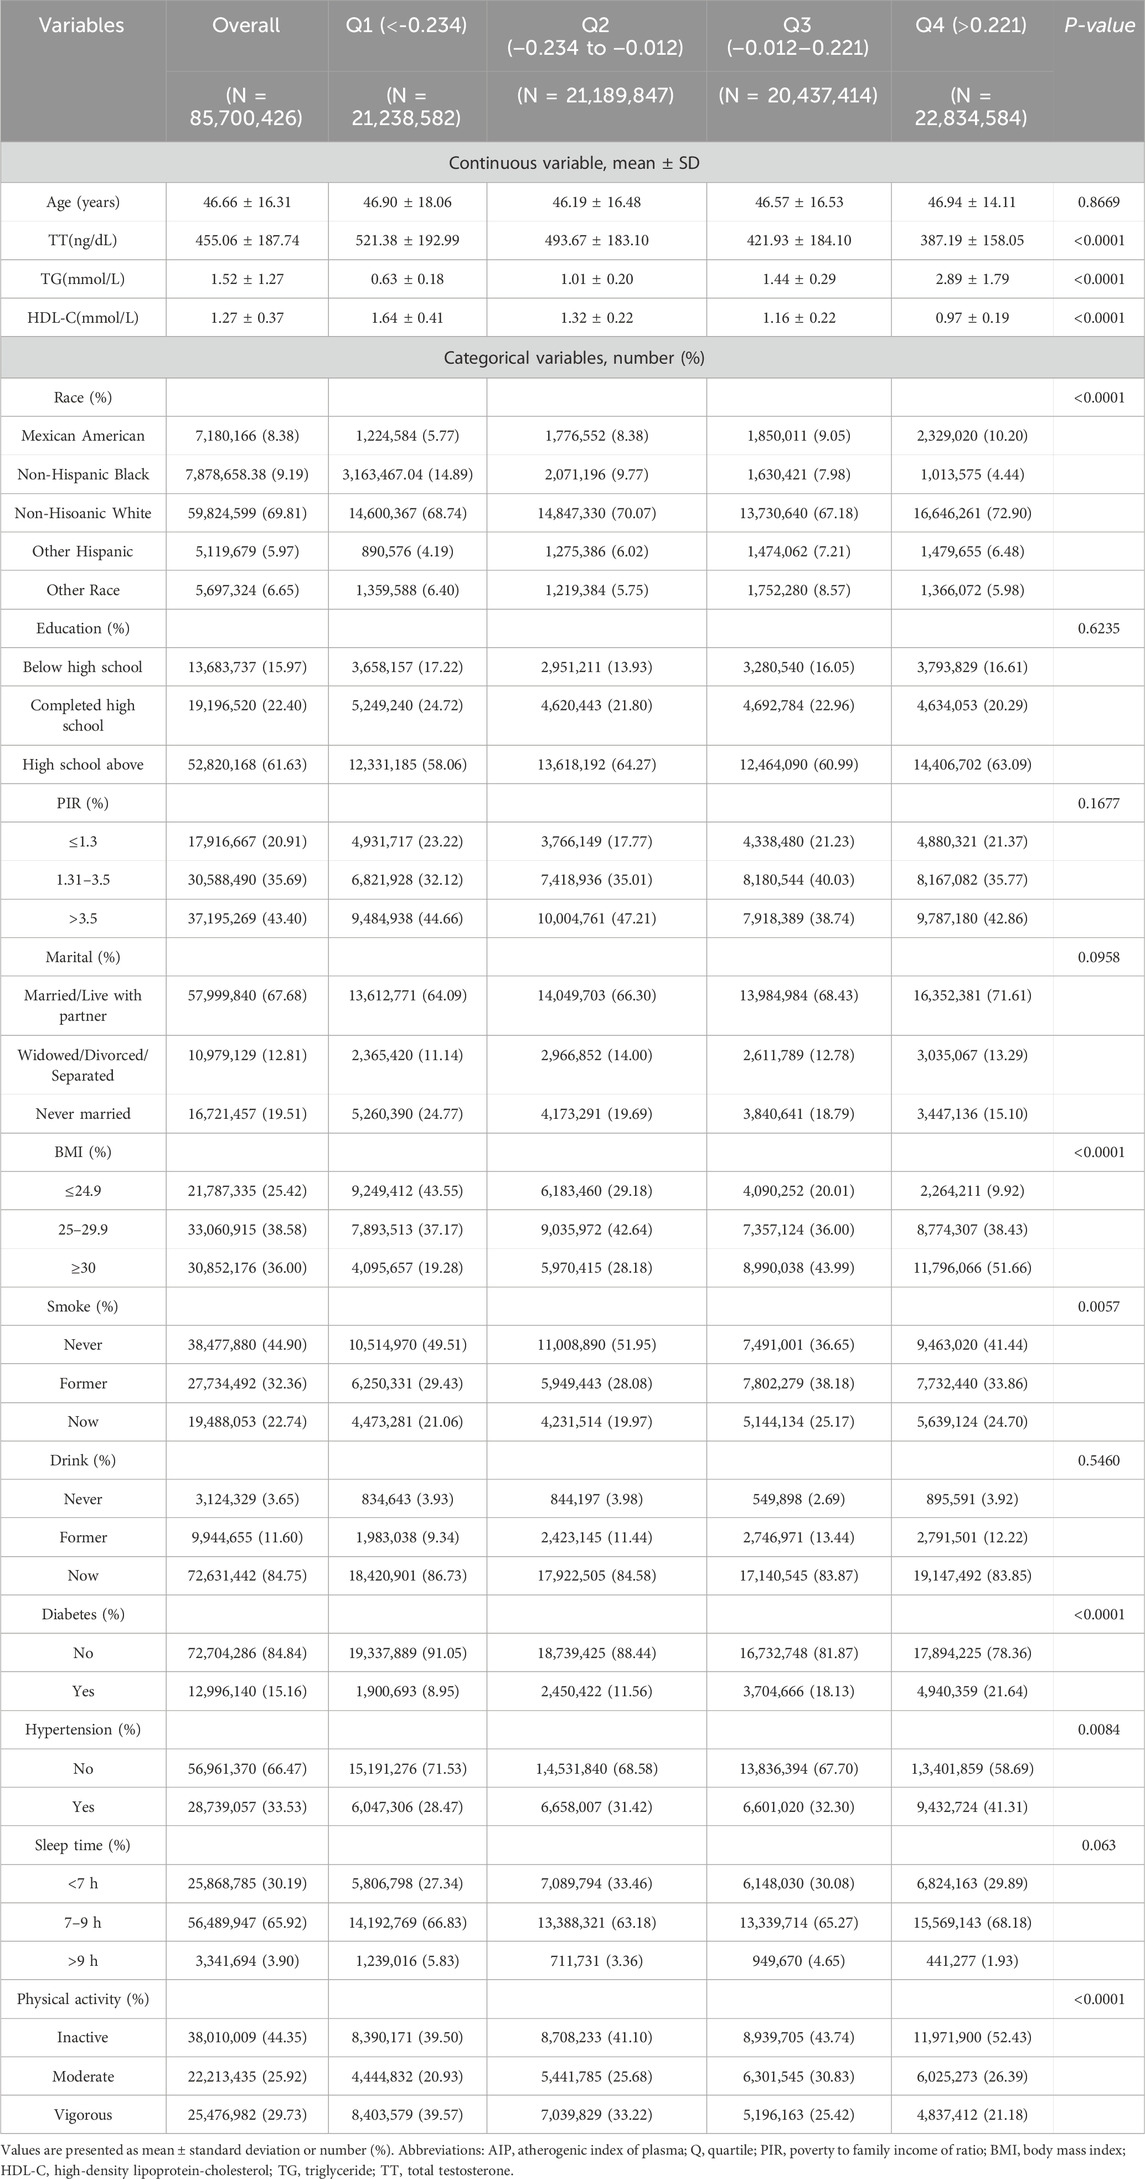
Table 1. Weighted demographic and clinical characteristics in accordance with the AIP level.
3.2 The association between AIP and TT, TDTable 2 shows the 95% confidence intervals of β and OR for the association between AIP and TT and TD in the three regression models.
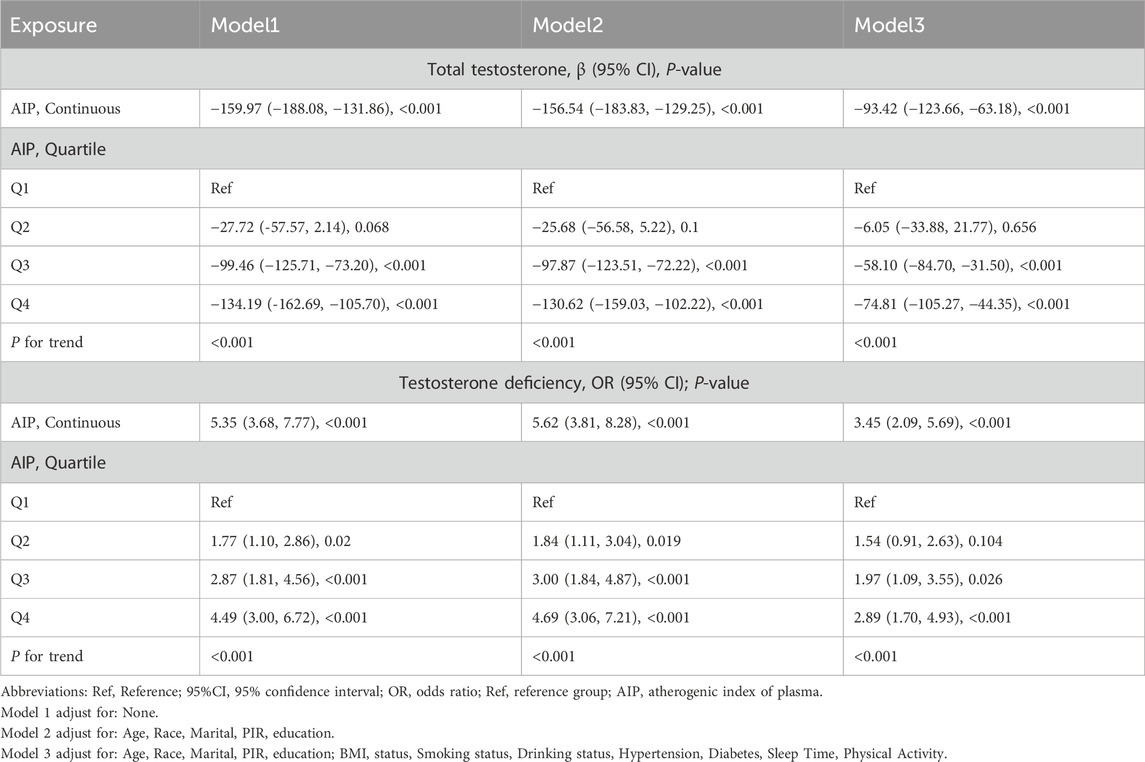
Table 2. Association between AIP and TT and TD, weighted.
The findings indicated a significant independent negative correlation between AIP and TT across various adjusted models (model 1, β = −159.97, 95% CI: −188.08, −131.86; model 2, β = −156.54, 95% CI: −183.83, −129.25). Similar results were noted in model 3 after comprehensive adjustment for confounding factors (β = −93.42, 95%CI: −123.66, −63.18; All p < 0.05). In models 1, 2, and 3, the β values for groups Q2, Q3, and Q4 were significantly different from those of Q1 (all p < 0.05). The two highest AIP groups (Q3 and Q4) exhibited significantly elevated testosterone levels compared to the lowest AIP group (Q1).
A weighted multivariate logistic regression model was employed to examine the association between AIP and TD. After full adjustment for all covariates, the analysis of continuous variables indicated that the risk of testosterone deficiency increased by 109% (OR = 3.45, 95% CI: 2.09, 5.69) for each unit increase in AIP. The analysis of categorical variables indicated that the risk of testosterone deficiency increased progressively, peaking at Q4 (OR = 2.89, 95%CI: 1.70, 4.93). In the other models lacking full covariate adjustment, the odds ratios for Q3 and Q4 were significantly different from Q1 (all p < 0.05), with all trend p values also below 0.05.
3.3 Linear relationship between AIP and TT, TDThe restricted spline regression model depicted in Figure 2 demonstrated a linear inverse relationship between AIP and TT in the adult male population (p for overall:<0.001), without adjusting for any covariates (Figure 2A). Upon controlling for all confounding factors (Figure 2B), AIP remained inversely associated with TT (p for overall: <0.001). RCS analysis indicated a consistent linear relationship between AIP and TD (Figures 2A1, B1).
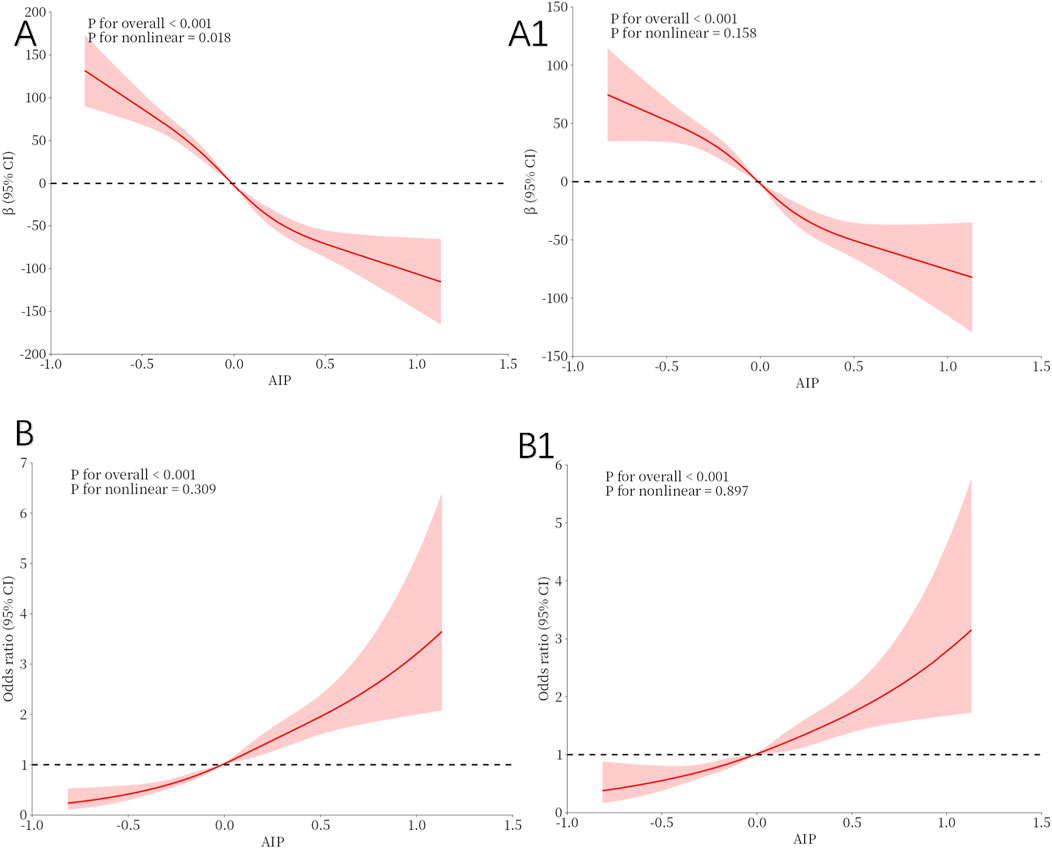
Figure 2. Restricted cubic spline fitting for the association between AIP with testosterone levels. (A, A1) illustrate the nonlinear association between the AIP and TT, while (B, B1) depict the nonlinear relationship between the AIP and TD. (A, B): No adjustment. (A1, B1): Adjust for Age, Race, Marital, PIR, Education, BMI status, Smoking status, Drinking status, Hypertension, Diabetes, Sleep Time and Physical Activity.
3.4 Subgroup analysisOur study investigated the relationship between AIP and dTT and TD across various subgroups. The analysis was adjusted for categorical Age, BMI, Diabetes, Hypertension, and Physical activity.The findings indicated that the correlation between AIP and TT levels, as well as TD, was consistent across all subgroups except for those with diabetes (all p < 0.001). No significant interaction was detected (p > 0.05). The comprehensive findings of the analysis are displayed in Tables 3, 4.
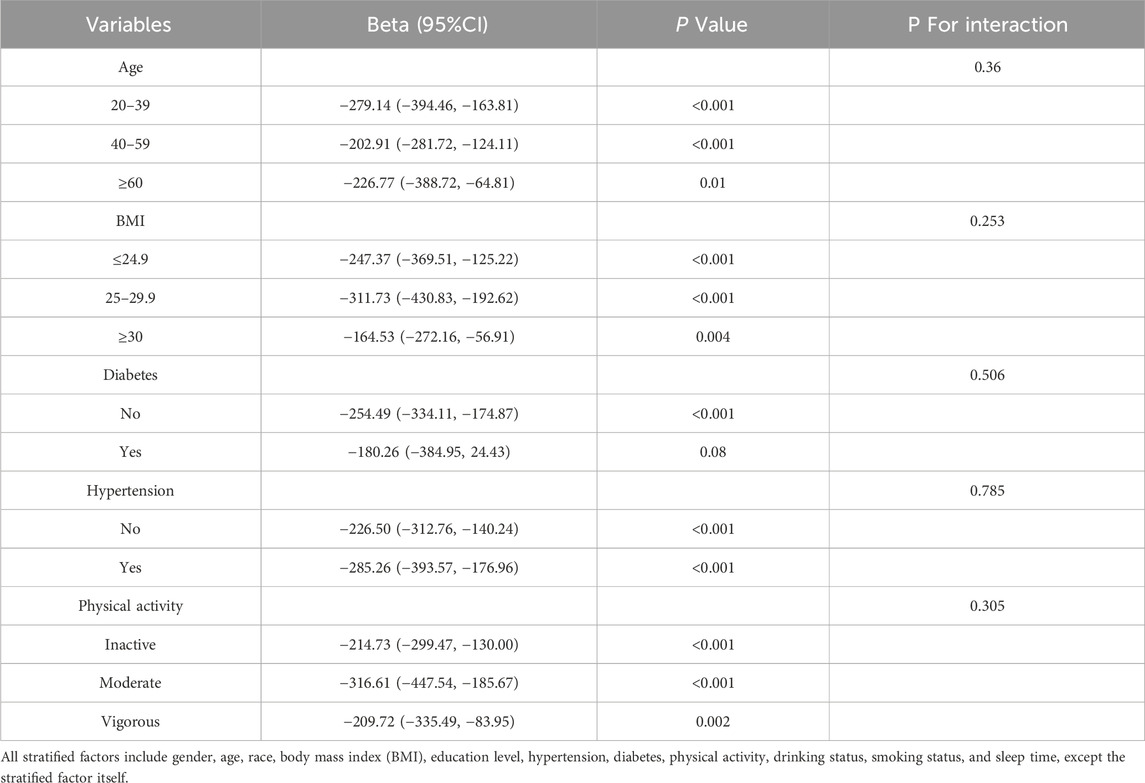
Table 3. Subgroup analysis for the association between AIP and TT, weighted.
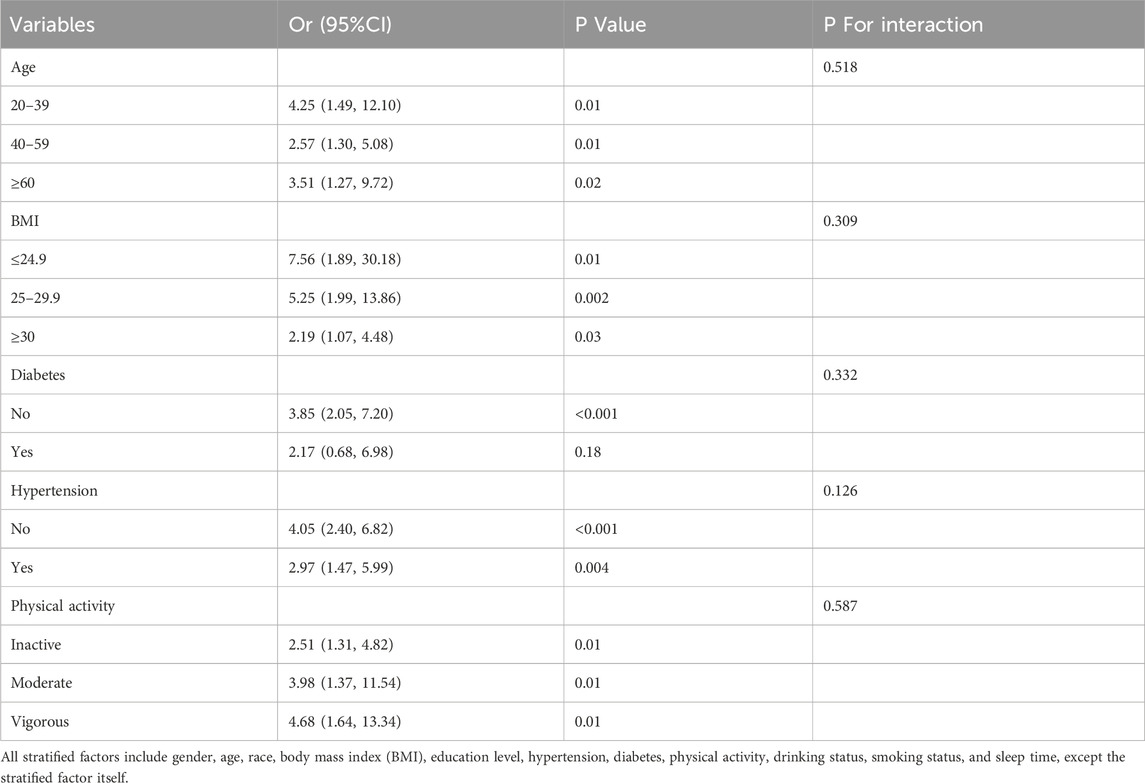
Table 4. Subgroup analysis for the association between AIP and TD, weighted.
3.5 Sensitivity analysesTable 5 illustrates that the correlation between AIP and TT persisted when the analysis was conducted with unweighted data (β = −155.81, p < 0.001) and remained steady in model 2 after adjusting for all covariates (β = −101.74, p < 0.001). Comparable outcomes were noted in the examination of AIP and TD (Model 2: OR = 3.01, p < 0.001).
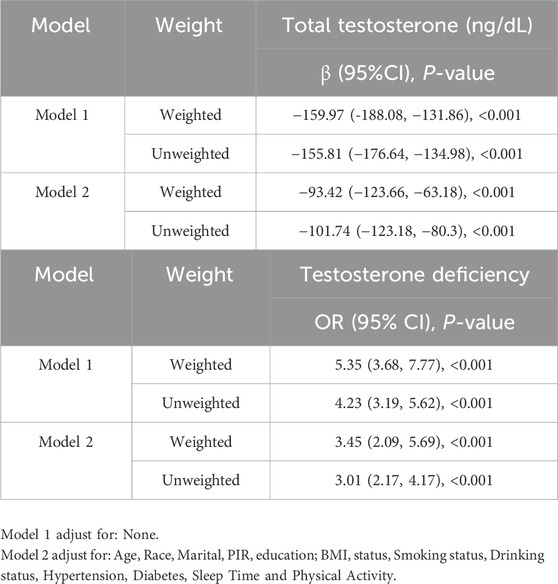
Table 5. The comparison between weighted and unweighted analysis for detection of sensitivity.
4 DiscussionThis study utilizes a large-scale US population survey to demonstrate, for the first time, an epidemiological relationship between AIP levels and testosterone. This study comprised 2,572 participants, with the sample size representing serum testosterone levels in 857,004 adult men. The study’s results indicate that as AIP increases, total testosterone levels significantly decline, leading to a heightened risk of testosterone deficiency. Sensitivity analysis was conducted to assess the robustness of our findings.
Numerous prior investigations have been conducted regarding lipids and testosterone. Andrade et al. examined the correlation between lipid levels and testicular function in a cohort of 278 infertile men. Their findings indicated that triglycerides (TG) serve as a sensitive marker for male reproductive dysfunction, with elevated serum TG levels correlating with decreased serum total testosterone levels (Andrade et al., 2023). Hamalainen et al. assessed serum sex hormone levels and blood lipids in 30 healthy Finnish men with comparable dietary habits, revealing a positive correlation between serum total testosterone and free testosterone levels and HDL-C (Hämäläinen et al., 1986). Semmens et al. found a significant inverse relationship between testosterone levels and HDL-C in male vegetarian participants, after adjusting for other variables (Semmens et al., 1983). Chung et al. identified an inverse correlation between the TG/HDL ratio and TT in middle-aged and elderly Korean men (Chung et al., 2020). As for AIP, A study involving 280 male patients with type 2 diabetes and 50 control subjects demonstrated a clear inverse relationship between TT levels and the cardiovascular disease risk predictor AIP (Rovira-Llopis et al., 2017).
The findings of our study align with those of prior research. This study utilizes the NHANES database with a large sample population to investigate the association between AIP and testosterone in adult men in the United States. AIP, which integrates both TG and HDL-C, is employed for this analysis. These findings suggest that AIP is linked to testosterone levels in adult males across various races and ages. We hypothesize that AIP may be utilized for the effective management of TT and the prevention of TD. Consequently, further studies on AIP and TT or TD across diverse populations with larger sample sizes are essential to strengthen the evidence base.
The mechanisms contributing to the reduction of AIP and serum total testosterone levels remain unclear; however, several explanations exist. The abnormal AIP index typically indicates dyslipidemia, characterized by elevated triglycerides and reduced HDL-C levels. Abnormal lipid metabolism influences the synthesis and secretion of reproductive hormones. Research involving animal models indicates that a high-fat diet elevates body weight in mice, particularly increasing serum triglyceride levels, which subsequently reduces testosterone levels and contributes to infertility in male mice (Erdemir et al., 2012). A clinical study indicated that alterations in lipid levels influence the secretion of reproductive hormones, specifically testosterone, follicle-stimulating hormone, and luteinizing hormone, with testosterone exhibiting the most significant impact (Yang and Wang, 2016). Bi et al. examined the correlation between lipid levels and serum reproductive hormones in a sample of 885 men, revealing that serum testosterone levels were significantly reduced in hyperlipidemic men compared to those with normal lipid levels (Bi et al., 2024).
AIP, on the other hand, is an indicator utilized to evaluate lipid metabolism and was initially employed to forecast atherosclerosis and CVD risk (Fernández-Macías et al., 2019). Recent studies have demonstrated that AIP serves as a significant biomarker for predicting unfavorable metabolic conditions, including diabetes and insulin resistance (Yin et al., 2023; Zheng et al., 2023), metabolic syndrome (Li et al., 2021), and Visceral Adiposity (Zhou et al., 2018; Shen et al., 2018). A significant quantity of aromatase enzymes present in visceral adipose tissue (VAT) can catalyze the conversion of testosterone to estradiol, leading to increased estradiol levels that activate hypothalamic estrogen receptors, subsequently inhibiting the Hypothalamic-pituitary-gonadal (HPG) axis and influencing testosterone release (Su et al., 2023). Moreover, hyperglycemia can directly induce a reduction in testosterone production by activating the Toll like receptor-4 (TLR-4) mediated oxidative stress pathway (Karpova et al., 2020). The association between testosterone levels and chronic diseases, as well as metabolic disorders, is bidirectional: reduced TT levels result in heightened lipoprotein lipase expression and VAT buildup. The buildup of VAT results in the secretion of proinflammatory cytokines (TNF-α, IL-1β) and leptin, which directly suppresses the HPG axis and Leydig cells in the testes. This leads to reduced serum testosterone synthesis (Pivonello et al., 2019). The accumulation of VAT results in heightened aromatase levels, contributing to insulin resistance and augmenting the risk of type 2 diabetes (Singh et al., 2003). Furthermore, TD has been linked to the development of MetS and to endothelial and mitochondrial dysfunction (Traish and Zitzmann, 2015). Numerous epidemiological studies have established a strong correlation between low serum testosterone levels and detrimental metabolic risk factors, including insulin resistance (Zolla, 2022; Tishova et al., 2024; Minooee et al., 2019), diabetes (Grossmann et al., 2010; Grossmann, 2011), dyslipidemia (Newman, 2023), and metabolic syndrome (Fernández-Miró et al., 2016), through the reciprocal promotion of bidirectional pathophysiological pathways involving various shared biochemical factors, such as proinflammatory pathways and cytokines. Consequently, it may be helpful to explain the mechanism of AIP and testosterone, nevertheless, additional investigations are required to elucidate the further molecular mechanisms of between them.
This study utilized NHANES data to examine the correlation between AIP and testosterone in a large sample of the US population. The chosen index AIP is both straightforward to compute and readily accessible. Furthermore, we included the appropriate sampling weights and design into our statistical analysis to enhance the precision of our representation of the general population. While this constitutes a strength of the study, it also has several limits. Initially, it was a cross-sectional study, indicating that causation couldn't be examined. Due to the numerous factors influencing AIP or testosterone, we may not consider all confounding variables that could impact the relationship between AIP and testosterone levels. Moreover, the absence of sex hormone-binding globulin and free testosterone levels constitutes limitations of our investigation. It is essential to recognize that the NHANES database exclusively represents the US population. The persistence of the relationship between AIP and TT and TD in individuals from various countries warrants investigation.
5 ConclusionThis study is, to our knowledge, the inaugural inquiry examining the relationship between AIP and serum testosterone. In the weighted multivariate regression analysis, AIP exhibited a negative correlation with TT and a positive correlation with the risk of TD. Our findings require validation through additional research.
Data availability statementThe original contributions presented in the study are included in the article/Supplementary Material, further inquiries can be directed to the corresponding author.
Author contributionsTL: Conceptualization, Data curation, Formal Analysis, Funding acquisition, Investigation, Methodology, Project administration, Resources, Software, Supervision, Validation, Visualization, Writing–original draft, Writing–review and editing. LC: Writing–original draft, Writing–review and editing, Formal Analysis. XL: Conceptualization, Data curation, Writing–review and editing. XYL: Conceptualization, Data curation, Writing–review and editing. YL: Conceptualization, Data curation, Writing–review and editing. YH: Conceptualization, Data curation, Writing–review and editing. YW: Conceptualization, Data curation, Supervision, Writing–review and editing.
FundingThe author(s) declare that no financial support was received for the research, authorship, and/or publication of this article.
Conflict of interestThe authors declare that the research was conducted in the absence of any commercial or financial relationships that could be construed as a potential conflict of interest.
Generative AI statementThe author(s) declare that no Generative AI was used in the creation of this manuscript.
Publisher’s noteAll claims expressed in this article are solely those of the authors and do not necessarily represent those of their affiliated organizations, or those of the publisher, the editors and the reviewers. Any product that may be evaluated in this article, or claim that may be made by its manufacturer, is not guaranteed or endorsed by the publisher.
Supplementary materialThe Supplementary Material for this article can be found online at: https://www.frontiersin.org/articles/10.3389/fphys.2025.1504778/full#supplementary-material
ReferencesAndrade G., Iori I., Hsieh M. K., Milani G., Zandoná P. C. E., Teixeira T. A., et al. (2023). Serum lipid profile levels and semen quality: new insights and clinical perspectives for male infertility and men's health. Int. Urol. Nephrol. 55, 2397–2404. doi:10.1007/s11255-023-03688-w
PubMed Abstract | CrossRef Full Text | Google Scholar
Bi J., Ma J., Yang C., Li Y., Liu X., Tie Y., et al. (2024). Hyperlipidemia is not related to semen quality, but to serum testosterone levels. Andrologia 2024, 6166698. doi:10.1155/2024/6166698
CrossRef Full Text | Google Scholar
Brand J. S., Rovers M. M., Yeap B. B., Schneider H. J., Tuomainen T. P., Haring R., et al. (2014). Testosterone, sex hormone-binding globulin and the metabolic syndrome in men: an individual participant data meta-analysis of observational studies. PLoS One 9, e100409. doi:10.1371/journal.pone.0100409
PubMed Abstract | CrossRef Full Text | Google Scholar
Cao S., Meng L., Bai H., Yang W., Hu X., Li X. (2024). The association between ethylene oxide and testosterone in the United States population: a cross-sectional study based on the National Health and Nutrition Examination Survey (NHANES) 2013-2016. Endocrine 86, 850–859. doi:10.1007/s12020-024-03979-x
PubMed Abstract | CrossRef Full Text | Google Scholar
Chen T. C., Clark J., Riddles M. K., Mohadjer L. K., Fakhouri T. H. I. (2020). National health and nutrition examination survey, 2015-2018: sample design and estimation procedures. Vital Health Stat. 2, 1–35.
PubMed Abstract | Google Scholar
Chen T. C., Parker J. D., Clark J., Shin H. C., Rammon J. R., Burt V. L. (2018). National health and nutrition examination survey: estimation procedures, 2011-2014. Vital Health Stat. 2, 1–26.
Chung T. H., Kwon Y. J., Lee Y. J. (2020). High triglyceride to HDL cholesterol ratio is associated with low testosterone and sex hormone-binding globulin levels in Middle-aged and elderly men. Aging Male 23, 93–97. doi:10.1080/13685538.2018.1501015
PubMed Abstract | CrossRef Full Text | Google Scholar
Colangelo L. A., Ouyang P., Liu K., Kopp P., Golden S. H., Dobs A. S., et al. (2009). Association of endogenous sex hormones with diabetes and impaired fasting glucose in men: multi-ethnic study of atherosclerosis. Diabetes Care 32, 1049–1051. doi:10.2337/dc08-2216
PubMed Abstract | CrossRef Full Text | Google Scholar
Dimopoulou C., Goulis D. G., Corona G., Maggi M. (2018). The complex association between metabolic syndrome and male hypogonadism. Metabolism 86, 61–68. doi:10.1016/j.metabol.2018.03.024
PubMed Abstract | CrossRef Full Text | Google Scholar
DobiáSOVá M. (2006). AIP--atherogenic index of plasma as a significant predictor of cardiovascular risk: from research to practice. Vnitr Lek. 52, 64–71.
PubMed Abstract | Google Scholar
DobiáSOVá M., Frohlich J. (2001). The plasma parameter log (TG/HDL-C) as an atherogenic index: correlation with lipoprotein particle size and esterification rate in apoB-lipoprotein-depleted plasma (FER(HDL)). Clin. Biochem. 34, 583–588. doi:10.1016/s0009-9120(01)00263-6
PubMed Abstract | CrossRef Full Text | Google Scholar
Duiyimuhan G., Maimaiti N. (2023). The association between atherogenic index of plasma and all-cause mortality and cardiovascular disease-specific mortality in hypertension patients: a retrospective cohort study of NHANES. BMC Cardiovasc Disord. 23, 452. doi:10.1186/s12872-023-03451-0
PubMed Abstract | CrossRef Full Text | Google Scholar
Erdemir F., Atilgan D., Markoc F., Boztepe O., Suha-Parlaktas B., Sahin S. (2012). The effect of diet induced obesity on testicular tissue and serum oxidative stress parameters. Actas Urol. Esp. 36, 153–159. doi:10.1016/j.acuro.2011.06.019
PubMed Abstract | CrossRef Full Text | Google Scholar
Fernández-Macías J. C., Ochoa-Martínez A. C., Varela-Silva J. A., PéREZ-Maldonado I. N. (2019). Atherogenic index of plasma: novel predictive biomarker for cardiovascular illnesses. Arch. Med. Res. 50, 285–294. doi:10.1016/j.arcmed.2019.08.009
PubMed Abstract | CrossRef Full Text | Google Scholar
Fernández-Miró M., ChillaróN J. J., Pedro-Botet J. (2016). Testosterone deficiency, metabolic syndrome and diabetes mellitus. Med. Clin. Barc. 146, 69–73. doi:10.1016/j.medcli.2015.06.020
PubMed Abstract | CrossRef Full Text | Google Scholar
Griggs R. C., Kingston W., Jozefowicz R. F., Herr B. E., Forbes G., Halliday D. (1989). Effect of testosterone on muscle mass and muscle protein synthesis. J. Appl. Physiol. 66, 498–503. doi:10.1152/jappl.1989.66.1.498
PubMed Abstract | CrossRef Full Text | Google Scholar
Guo L., Nan Y., Yao L. (2024). Association between atherogenic indexes and erectile dysfunction: a cross-sectional analysis of the National Health and Nutrition Examination Survey 2001-2004. Int. Urol. Nephrol. 56, 2877–2885. doi:10.1007/s11255-024-04050-4
PubMed Abstract | CrossRef Full Text | Google Scholar
Hämäläinen E., Adlercreutz H., Ehnholm C., Puska P. (1986). Relationships of serum lipoproteins and apoproteins to sex hormones and to the binding capacity of sex hormone binding globulin in healthy Finnish men. Metabolism 35, 535–541. doi:10.1016/0026-0495(86)90011-9
PubMed Abstract | CrossRef Full Text | Google Scholar
Heller R. F., Wheeler M. J., Micallef J., Miller N. E., Lewis B. (1983). Relationship of high density lipoprotein cholesterol with total and free testosterone and sex hormone binding globulin. Acta Endocrinol. (Copenh) 104, 253–256. doi:10.1530/acta.0.1040253
PubMed Abstract | CrossRef Full Text | Google Scholar
He Q., Chen B., Liang F., Zhang Z. (2024). Association between the atherogenic index of plasma and bone mineral density among adult women: NHANES (2011-2018). Front. Endocrinol. (Lausanne) 15, 1363889. doi:10.3389/fendo.2024.1363889
PubMed Abstract | CrossRef Full Text | Google Scholar
Hernández-Pérez J. G., Taha S., Torres-SáNCHEZ L. E., Villasante-Tezanos A., Milani S. A., Baillargeon J., et al. (2024). Association of sleep duration and quality with serum testosterone concentrations among men and women: NHANES 2011-2016. Andrology 12, 518–526. doi:10.1111/andr.13496
PubMed Abstract | CrossRef Full Text | Google Scholar
Karpova T., De Oliveira A. A., Naas H., Priviero F., Nunes K. P. (2020). Blockade of Toll-like receptor 4 (TLR4) reduces oxidative stress and restores phospho-ERK1/2 levels in Leydig cells exposed to high glucose. Life Sci. 245, 117365. doi:10.1016/j.lfs.2020.117365
PubMed Abstract | CrossRef Full Text | Google Scholar
Kupelian V., Page S. T., Araujo A. B., Travison T. G., Bremner W. J., Mckinlay J. B. (2006). Low sex hormone-binding globulin, total testosterone, and symptomatic androgen deficiency are associated with development of the metabolic syndrome in nonobese men. J. Clin. Endocrinol. Metab. 91, 843–850. doi:10.1210/jc.2005-1326
PubMed Abstract | CrossRef Full Text | Google Scholar
Li Y. W., Kao T. W., Chang P. K., Chen W. L., Wu L. W. (2021). Atherogenic index of plasma as predictors for metabolic syndrome, hypertension and diabetes mellitus in Taiwan citizens: a 9-year longitudinal study. Sci. Rep. 11, 9900. doi:10.1038/s41598-021-89307-z
PubMed Abstract | CrossRef Full Text | Google Scholar
Minooee S., Ramezani Tehrani F., Rahmati M., Amanollahi Soudmand S., Tohidi M., Sabet Z., et al. (2019). The association between serum total testosterone and progression of hyperglycemia: a 15-year prospective cohort study. Andrology 7, 148–155. doi:10.1111/andr.12568
PubMed Abstract | CrossRef Full Text | Google Scholar
Mulhall J. P., Trost L. W., Brannigan R. E., Kurtz E. G., Redmon J. B., Chiles K. A., et al. (2018). Evaluation and management of testosterone deficiency: AUA guideline. J. Urol. 200, 423–432. doi:10.1016/j.juro.2018.03.115
PubMed Abstract | CrossRef Full Text | Google Scholar
O'Connell M. D., Wu F. C. (2014). Androgen effects on skeletal muscle: implications for the development and management of frailty. Asian J. Androl. 16, 203–212. doi:10.4103/1008-682X.122581
PubMed Abstract | CrossRef Full Text | Google Scholar
Onat A., Can G., Kaya H., Hergenç G. (2010). Atherogenic index of plasma (log10 triglyceride/high-density lipoprotein-cholesterol) predicts high blood pressure, diabetes, and vascular events. J. Clin. Lipidol. 4, 89–98. doi:10.1016/j.jacl.2010.02.005
PubMed Abstract | CrossRef Full Text | Google Scholar
Pivonello R., Menafra D., Riccio E., Garifalos F., Mazzella M., De Angelis C., et al. (2019). Metabolic disorders and male hypogonadotropic hypogonadism. Front. Endocrinol. (Lausanne) 10, 345. doi:10.3389/fendo.2019.00345
PubMed Abstract | CrossRef Full Text | Google Scholar
Qin M., Chen B. (2024). Association of atherogenic index of plasma with cardiovascular disease mortality and all-cause mortality in the general US adult population: results from NHANES 2005-2018. Cardiovasc Diabetol. 23, 255. doi:10.1186/s12933-024-02359-z
PubMed Abstract | CrossRef Full Text | Google Scholar
Rovira-Llopis S., BañULS C., De MarañON A. M., Diaz-Morales N., Jover A., Garzon S., et al. (2017). Low testosterone levels are related to oxidative stress, mitochondrial dysfunction and altered subclinical atherosclerotic markers in type 2 diabetic male patients. Free Radic. Biol. Med. 108, 155–162. doi:10.1016/j.freeradbiomed.2017.03.029
PubMed Abstract | CrossRef Full Text | Google Scholar
Ruige J. B., Mahmoud A. M., De Bacquer D., Kaufman J. M. (2011). Endogenous testosterone and cardiovascular disease in healthy men: a meta-analysis. Heart 97, 870–875. doi:10.1136/hrt.2010.210757
PubMed Abstract | CrossRef Full Text | Google Scholar
Semmens J., Rouse I., Beilin L. J., Masarei J. R. (1983). Relationship of plasma HDL-cholesterol to testosterone, estradiol, and sex-hormone-binding globulin levels in men and women. Metabolism 32, 428–432. doi:10.1016/0026-0495(83)90002-1
PubMed Abstract | CrossRef Full Text | Google Scholar
Shen S. W., Lu Y., Li F., Yang C. J., Feng Y. B., Li H. W., et al. (2018). Atherogenic index of plasma is an effective index for estimating abdominal obesity. Lipids Health Dis. 17, 11. doi:10.1186/s12944-018-0656-1
PubMed Abstract | CrossRef Full Text | Google Scholar
Singh R., Artaza J. N., Taylor W. E., Gonzalez-Cadavid N. F., Bhasin S. (2003). Androgens stimulate myogenic differentiation and inhibit adipogenesis in C3H 10T1/2 pluripotent cells through an androgen receptor-mediated pathway. Endocrinology 144, 5081–5088. doi:10.1210/en.2003-0741
留言 (0)