
記住我
Staphylococcus aureus, which can encode penicillin binding protein 2a (PBP2a) and cannot be inactivated by β-lactam antibiotics, is called methicillin-resistant Staphylococcus aureus (MRSA) (Peacock and Paterson, 2015). Since its first discovery in the United Kingdom in 1961, MRSA has spread to various parts of the world and has become one of the leading pathogens causing community-acquired and healthcare related infections (Gurieva et al., 2012), it has a fast transmission speed, strong pathogenicity, and exhibits multiple drug resistance with high mortality rate (Oliveira et al., 2018). MRSA is resistant to a variety of antibiotics, such as β-lactams, fluoroquinolones, macrolides, aminoglycosides, tetracyclines, rifampicin and fusidic acid. Its drug resistance mechanism is complex, mainly including the production of β-lactamase (Lee and Park, 2016) and PBP2a (Miyachiro et al., 2019), the reduction of the permeability of antibiotics to cell membranes, the change of drug targets, the activation of drug efflux in bacteria, the inhibition of enzyme expression, the transfer of drug-resistant plasmids and the formation of bacterial biofilms (Roberts et al., 2012). Glycopeptide antibiotics are currently the “last line of defense” for the treatment of MRSA infection, but there have been intermediates between vancomycin resistant Staphylococcus aureus (visa) and vancomycin resistant Staphylococcus aureus (VRSA) (Spagnolo et al., 2014), At present, MRSA has become a major problem in clinical anti infection treatment, which requires further research on the resistance mechanism of MRSA and the development of new antibacterial treatment strategies.
The development of new antibacterial drugs faces two major challenges, namely, high costs and lengthy clinical validation time. This means that not only does it require massive financial support, but it also takes a long time to ensure the safety and effectiveness of new drugs, and the combination of multiple antibiotics may also lead to high bacterial resistance. In recent years, the therapeutic effects of traditional Chinese medicine and its active ingredients have been increasingly recognized. Traditional Chinese medicine has minimal toxic side effects, and its combination with antibiotics can reduce drug toxicity and effective dosage, reduce bacterial resistance, and provide a new approach for the clinical treatment of MRSA. Houttuynia cordata, a traditional Chinese medicine, has good anti-inflammatory activity, and is often used in clinical treatment of respiratory infections, urinary tract inflammation, acute and chronic rhinitis, conjunctivitis and other diseases (Liu et al., 2021),Its extract sodium houttuyfonate has antibacterial, antiviral, antiallergic, immune enhancing, tumor proliferation inhibiting and other effects (Zhuang et al., 2022),Numerous studies have shown that SH has a clear therapeutic effect on bacterial infections such as Staphylococcus aureus, Pseudomonas aeruginosa, Haemophilus influenzae, and Streptococcus pneumoniae (Chen et al., 2014; Wang et al., 2019), and studies have proved that a certain concentration of SH can inhibit the formation of biofilm of Staphylococcus aureus (Liu et al., 2011). However, its mechanism of action is not fully understood and further research is needed to elucidate its potential mechanism of action in combating infections.
Network pharmacology is an important method for exploring the potential target and molecular mechanisms of drugs, and is an emerging field of pharmacological research that integrates traditional pharmacology, bioinformatics, cheminformatics, and network biology (Liu et al., 2024; Zhu et al., 2021). By constructing a drug-disease interaction network to evaluate the molecular mechanism of drugs, we can further study the biological effects of various small molecules (Zhou et al., 2022a; Shang et al., 2023). Molecular docking technology can deeply analyze the interaction between molecules, and intuitively explain the mechanism of action between receptors and ligands in 3D graphics. Therefore, combining molecular simulation validation with network pharmacology analysis is an effective method for studying the mechanism of drug action in drug research (Wang et al., 2024).
This study aims to investigate the antibacterial effect of sodium houttuyfonate combined with the clinically common antibiotic penicillin G, and observe its efficacy in a rat MRSA wound model. At the same time, network pharmacology and molecular docking techniques are used to predict the potential targets and action pathways of the drug, providing experimental evidence for SH to become a potential drug or antibacterial sensitizer for anti-MRSA infection in the future. The general workflow is shown in Figure 1A.
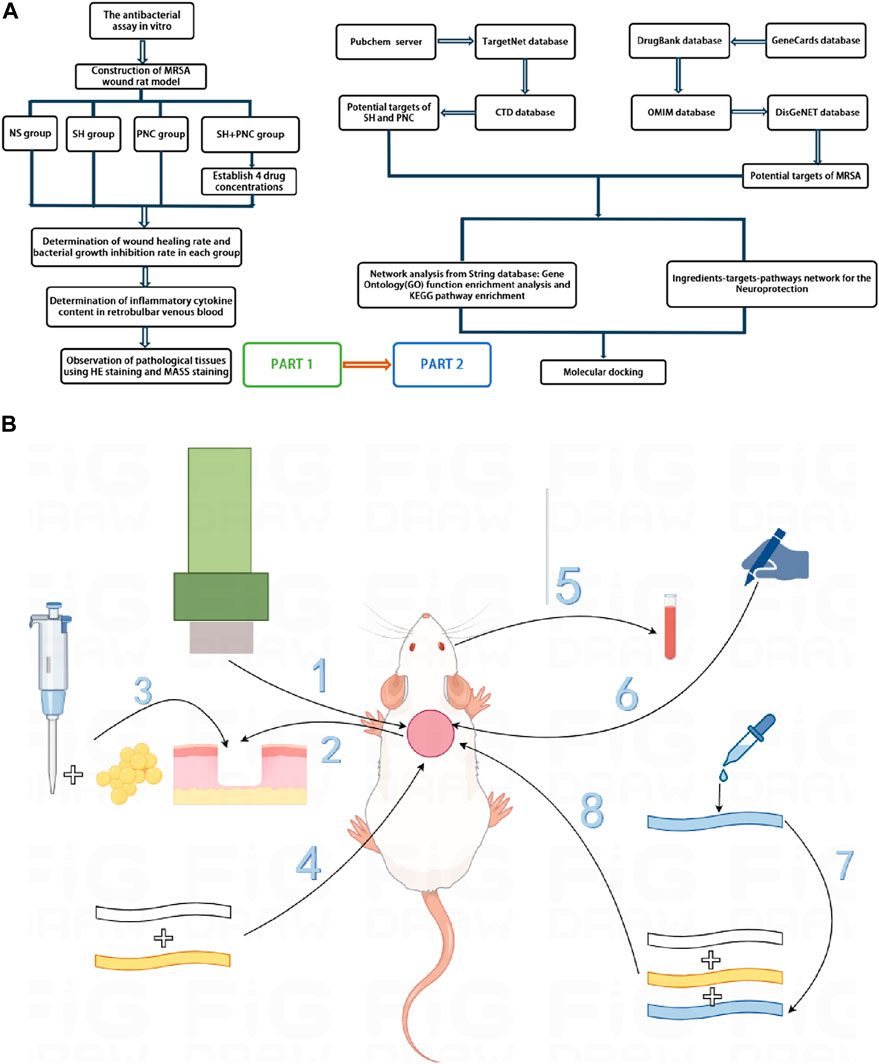
Figure 1. Overall workflow of SH + PNC treatment for methicillin resistant staphylococcus aureus infected wounds ((A), Part 1 is workflow of network pharmacology; Part 2 is workflow of animal experiments). Schematic diagram of the flow of animal experiments ((B), 1. Using a skin picker to create a wound on the back of the rat; 2. The wound is transverse and deep to the fascia layer.; 3. Inoculating the bacterial solution onto the back wound; 4. Wraping with vaseline gauze and sterile gauze in turn; 5. Collecting the blood from the retrobulbar vein of the rat; 6. Using a sterile transparent film to outline the wound surface; 7. Preparing drug gauze by impregnating it with drug solution; 8. Apply drug gauze, vaseline gauze, and sterile gauze to bind up the wound in order).
2 Materials and methods2.1 Experimental strains and animalsCollect 20 strains of MRSA isolated from the microbiology laboratory of the Affiliated Hospital of North Sichuan Medical College from September 2020 to November 2020, with specimen types of sputum and pus. The strain was identified by VITEK GP identification card and VITEK AST-GP67 drug susceptibility card of French bioMerieux company. The quality control strain is Staphylococcus aureus (ATCC 25923) provided by the Microbiology Laboratory of the Affiliated Hospital of North Sichuan Medical College. The experimental animals were 55 female SD rats weighing 150–200 g each, provided by the Animal Experimental Center of North Sichuan Medical College. The ethics of animal experiments were approved by the Ethics Committee of North Sichuan Medical College (NSMC2023071).
2.2 Experimental drugsSodium houttuyfonate (purity≥99%) (Xi’an Kailai Biological Engineering Co., Ltd.); Penicillin G for injection (Shandong Lukang Pharmaceutical Co., Ltd.); Tetrazolium salt (MTT, Guangzhou Saiguo Biotechnology Co., Ltd.); dimethyl sulfoxide (DMSO, Chengdu Kelong Chemicals Co., Ltd.).
2.3 Strain identification2.3.1 Preparation of strain plate and bacterial solutionPrepare MH broth medium and MH agar medium and store them in a refrigerator at 4°C for future use. Thaw the standard strain of Staphylococcus aureus ATCC 25923 and a MRSA strain. Pipette 2 μL of bacterial solution into 1 mL of MH broth culture medium, place it in a constant temperature shaker at 37°C and 120r/min for 12 h of shaking culture. Use a loop to dip a small amount of bacterial solution and inoculate it onto the MH agar plate using a continuous serpentine curve streaking method. After 24 h of cultivation, freeze it and pick a single colony from the plate with the inoculated strain into 1 mL of MH broth culture medium. Centrifuge the cultured bacterial solution at 8000r/min for 3 min, and then add 1 mL of normal saline to resuspend it. Use physiological saline as a blank control, detect the OD600 nm value of the bacterial solution using a nucleic acid protein analyzer, dilute the OD value of the bacterial solution with physiological saline to 1.0 (1OD600 = 1.5 × 10⁸ cfu/mL), and finally dilute the bacterial solution with MH broth medium to 1 × 10⁵ cfu/mL for use.
2.3.2 MRSA identificationAdjust the concentration of the bacterial solution to 0.5 McFarland concentration using a turbidimeter, dip a sterile cotton swab into the bacterial suspension, then evenly spread it onto the MH agar plate, and finally attach a cefoxitin (FOX) drug susceptibility disk (30 μg/disk). Incubate for 24 h in a 37°C incubator. The results were interpreted in accordance with the Clinical and Laboratory Standards Institute (CLSI) standards. The quality control strain is Staphylococcus aureus ATCC 25923.
2.4 In vitro antibacterial experiment2.4.1 Drug preparationAdd sodium houttuyfonate powder and penicillin G powder to the MH broth culture solution, shake and mix well, and prepare according to the two-fold dilution method. The concentration gradients are 1,600, 800, 400, 200, 100, 50, 25, 12.5 μg/mL and 1,200, 600, 300, 150, 75, 37.5, 18.75, 9.375 μg/mL. Weigh 250 mg of MTT powder and dissolve it in 50 mL of PBS solution that has been sterilized under high pressure. Prepare a MTT solution with a concentration of 5 mg/mL, filter it through a 0.25 μm bacterial filter, and store it in a refrigerator at 4°C away from light.
2.4.2 Determination of minimum inhibitory concentration (MIC)Take a sterile 96-well plates, set up 3 replicates for each drug concentration, and do not add samples to the edge wells of the 96-well plates. Add the diluted drugs in the order from high concentration to low concentration, except for the negative control, and add bacterial solution (concentration of 1 × 10⁵ cfu/mL) to each well. Use MH broth culture solution to make up to 100ul, and the final concentrations of SH solution are 640, 320, 160, 80, 40, 20, 10, 5 μg/mL, and PNC is 480, 240, 120, 60, 30, 15, 7.5, 3.75u/mL. The positive control group consists of MRSA bacteria without drug intervention, while the negative control group consists of pure MH broth medium. The remaining unsampled edge holes were filled with physiological saline. Place it in a 37°C incubator for 15 h, then add 10 μL of MTT solution to each well and shake it for 1 h at 37°C on a shaker (120r/min). The minimum drug concentration corresponding to the absence of bacterial growth in the visual inspection is the MIC of the bacteria. Finally, add DMSO to each well, and use a microplate reader to measure the absorbance value at a wavelength of 490 nm, thereby calculating the inhibition rate of each concentration of the two drugs.
2.4.3 Combined antibacterial effect of drugsAccording to the above MIC results, the final concentrations of the two drugs after sample addition were 2MIC, 1MIC, 1/2MIC, 1/4MIC, 1/8MIC, 1/16MIC, and 1/32MIC. Using the chessboard dilution method, add 40ul of each drug and 20ul of bacterial solution to each well, and make up to 100ul with MH broth culture medium. Add 100ul of normal saline to the hole without sample on the edge。Use the same method as above and calculate the MIC and fractional inhibitory concentration index (FICI). Standard: FICI ≤ 0.5 indicates synergistic effect; 0.5 < FICI ≤ 1 is additive effect; 1 < FICI ≤ 2 is an unrelated effect; FICI > 2 is antagonistic.
2.5 Animal experiments2.5.1 Establishment of rat model of MRSA infection woundSD rats were injected with 3% sodium pentobarbital solution intraperitoneally at a dose of 0.3 mL/100 g. After complete anesthesia, shave the back hair, with an area of 3 × 3 cm2. Create a circular wound with a diameter of 15 mm using a skin punch, reaching the fascia. Then, use a pipette to inject 15 μL of bacterial solution with a concentration of 1.5 × 10^8 cfu/mL into the back wound of an SD rat. Once the bacterial solution is fully absorbed, sequentially apply a single layer of sterile vaseline gauze for moisturizing and cover it with four layers of sterile gauze (Figure 1B). Breding in the animal experimental center of Southwest Medical University, with the ambient temperature of 22°C–24°C and the relative humidity of 60%–80% manually controlled.
2.5.2 Identification of wound secretionOn the third day after surgery, the wound secretion was taken with a cotton swab and transferred to a methicillin-resistant Staphylococcus aureus color medium, which was evenly applied and incubated for 24 h in a 37°C incubator. The results were identified according to the instructions of the colorimetric medium for methicillin-resistant Staphylococcus aureus.
2.5.3 Animal grouping and preparation of drug gauzePrepare the drug solution according to the results of the in vitro antibacterial test, take a sterile double-layer gauze measuring 2 × 2 cm2, and soak it with the drug solution. SD rats were divided into five groups, with three rats in each group. Four of the groups were treated with different concentrations of SH + PNC, while one group was treated with normal saline as a blank control group.
2.5.4 Measurement of wound healing rateThe rats were subjected to dressing changes on postoperative days 3, 5, and 7, and were sacrificed on day 9. On the 3rd and 9th day, sterile transparent film was placed on the wound surface, and then the wound surface was outlined and scanned using a gel imaging system. The image was analyzed using ImageJ software to calculate the wound area and wound healing rate. The wound healing rate (%) = (area before treatment - area after treatment)/area before treatment X100%.
2.5.5 HE staining and MASSON stainingOn the ninth day, SD rats were sacrificed and skin tissue was removed using a 15 mm diameter skin-removing device aligned with the center of the wound, which reached deep into the fascia. Soak the skin tissue in the fixative for 24 h, and embed the tissue in paraffin. Then, the tissue was stained with HE and MASSON, and the number of neutrophils in a random field of view was observed and recorded under a 200x light microscope. The percentage of collagen fibers in the image was determined using ImageJ software.
2.5.6 Inflammatory factor determinationOn the 3rd and 9th day, anesthetize rats with 3% sodium pentobarbital intraperitoneally, insert the capillary glass tube from the inner canthus, slide it to the retrobulbar vein, rotate the glass tube until blood drips out, collect 1 mL, then pull out the glass tube, place the whole blood sample at room temperature for 2 h, take the supernatant, freeze it and store it in a −80°C refrigerator for future use. Use the corresponding ELISA kit instructions, and finally measure the optical density (OD450 nm) value and calculate the sample concentration.
2.6 Network pharmacology2.6.1 Target acquisitionThe chemical structures of SH and PNC were obtained on Pubchem database (https://pubchem.ncbi.nlm.nih.gov/) (Kim, 2016). Upload SH and PNC to the TargetNet database (http://targetnet.scbdd.com/) (Zhi-Jiang et al., 2016) and CTD database (Comparative Toxicogenomics Database, https://ctdbase.org/) (Tumayhi et al., 2023) to obtain the target sites of action, load the obtained targets into the UniProtKB database (https://www.uniprot.org/) (Zaru et al., 2020) to obtain standard target names, and set the search criteria to “Homo Sapiens”. Search for ‘methicillin-resistant Staphylococcus aureus infection’ in the GeneCards database (https://www.genecards.org/) (Stelzer et al., 2016), Drug Bank database (https://go.drugbank.com/) (Svensson et al., 2018), DisGeNET database (https://disgenet.com/) (Piñero et al., 2017), and OMIM database (https://www.omim.org/) (Amberger et al., 2019) to obtain disease-related genes. Integrate data, remove duplicate values, and cross-reference the above targets using R software (Version 4.4.1, The R Project for Statistical Computing) (Sepulveda, 2020; Bota and Fodor, 2019) to obtain potential therapeutic targets.
2.6.2 Network constructionImport the cross targets into the STRING database (Version 12.0, https://cn.string-db.org/) (Szklarczyk et al., 2023) to construct a protein–protein interaction (PPI) network, with the condition set to Homo sapiens, minimum required high confidence (0.700) and hide disconnected nodes in the network. Further analysis of the PPI network was conducted through the Cytoscape software (Version 3.10.2) (Doncheva et al., 2019) to identify core targets.
2.6.3 Functional enrichment analyses and compound-target-pathways (CTP) networkGo analysis and KEGG pathway analysis of SH and PNC targets were performed by using DAVID database (https://david.ncifcrf.gov/home.jsp) (Xie et al., 2022) to predict the biological functions, action pathways and potential relationships of SH and PNC. Based on these core targets and pathways, CTP network were constructed to intuitively clarify the therapeutic mechanism of SH + PNC on methicillin resistant staphylococcus aureus infected wounds.
2.6.4 Molecular dockingPaymol software (Version 3.0) (Hancock et al., 2022) was used to remove water molecules and small molecule ligands from the protein structure, and then imported into AutoDock Vina (Version 1.1.2) (Forli et al., 2016) for hydrotreating. The receptor and ligand were docked in AutoDock Vina software to analyze their binding activities. Paymol was used to visualize the results of molecular docking simulation validation.
2.7 Statistical methodsSPSS27.0 statistical software was used for analysis. Data were expressed as x¯±s, and data that conformed to normal distribution and homogeneity of variance were analyzed using one-way analysis of variance and independent sample t-test. LSD-t test was used for inter-group comparison Sample data that do not conform to the normal distribution are represented by the median (interquartile range), and Kruskal–Wallis H tests are used for overall comparisons and pairwise comparisons between sample groups. P < 0.05 indicates a statistically significant difference.
3 Result3.1 Identification of MRSA strainsAccording to CLSI standards, when the diameter of the inhibition zone is ≤ 21 mm, it can be determined as MRSA; When the diameter of the bacteriostatic zone is ≥ 22 mm, it can be diagnosed as methicillin-sensitive Staphylococcus aureus (MSSA). The inhibition zone test was performed on the quality control strain ATCC 25923, and the inhibition zone diameter was 25 mm (Figure 2A), which meets the MSSA standard. The diameter of the inhibition zone for the clinical strains was less than 21 mm (Figure 2B), thus confirming them as MRSA.
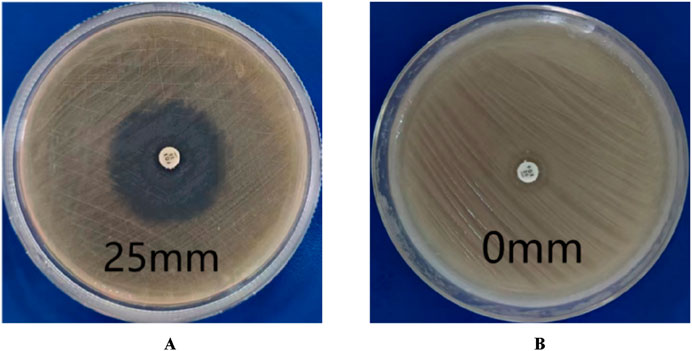
Figure 2. Drug sensitivity test results. (A) is MSSA (the diameters of bacterial inhibition zone≥22 mm). (B) is MRSA (the diameters of bacterial inhibition zone <21 mm).
3.2 Antibacterial testing in vitroThe MIC values of SH and PNC against the standard strain of Staphylococcus aureus ATCC 25923 were 60 μg/mL and <1u/mL, respectively. The MIC values for clinical isolates of MRSA ranged from 60 to 80 μg/mL and 40 to 70u/mL (Figure 3, Table 1). The FICI of SH + PNC was 0.375–0.5625, and 14 strains showed synergistic antibacterial effects, while 6 strains showed additive antibacterial effects (Figure 4, Table 1). The OD value of the 96-well plates at a wavelength of 490 nm was measured using a microplate reader, and the average inhibition rate was calculated. The results showed that the inhibition rate of sodium houttuyfonate at a drug concentration of 1/2MIC combined with different concentrations of penicillin G was significantly higher than that of penicillin G alone (P < 0.05), indicating that SH can significantly increase the antibacterial effect of PNC(Figure 5, Table 2).
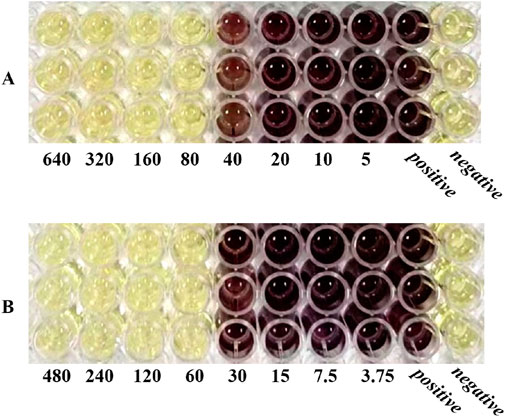
Figure 3. Microbroth dilution method was used to determine the MIC of drugs. (A) is SH(μg/mL). (B) is PNC(u/mL).
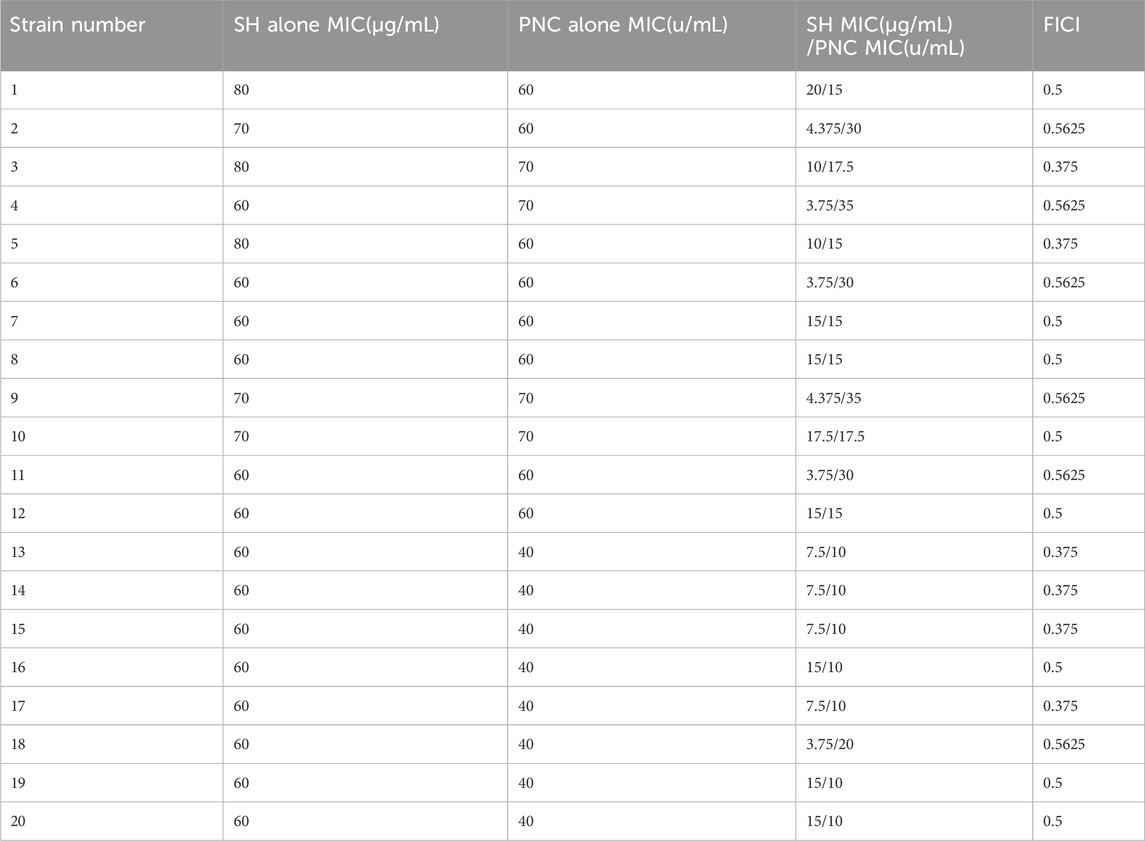
Table 1. MIC and FICI values of various drugs in vitro antibacterial experiments.

Figure 4. Drug sensitivity results of Sodium houttuyfonate combined with Penicilin G detected by microbroth dilution method ((B), Combined drug sensitivity results of strain No. 1). The first row of 1-3 holes are the positive control group, and the 4-6 holes are the negative control group. The MIC of SH alone in the figure is 80 μg/mL, and the MIC of PNC alone is 60u/mL. The best bacteriostatic concentration combination (SH 20 μg/mL + PNC15u/mL) is shown in the hole (A) in the figure where no bacterial growth is observed, with FICI = 20/80 + 15/60 = 0.5. Determination of MIC values for SH and PNC of isolated strain No. 1 (C).
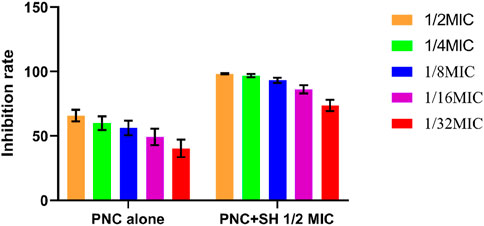
Figure 5. Changes in average inhibition rate of Penicilin G alone and combination with Sodium houttuyfonate (1/2 MIC).

Table 2. Comparison of average inhibition rates of Penicilin G alone and combined with Sodium houttuyfonate (1/2 MIC) (x¯±s, %).
3.3 Identification of wound secretionAccording to the instructions for the color medium for methicillin-resistant Staphylococcus aureus (MRSA) from the French company Comag, MRSA colonies are pink to light purple; Other bacterial colonies are blue. The results showed that the colonies of bacteria cultured from the wound secretions in each group were almost pink MRSA, with occasional blue colonies of other bacteria (Figure 6).

Figure 6. Results of MRSA chromoculture plate experiments. The color of the uninoculated MRSA coloration culture plate is light yellow (A). A large number of pink MRSA colonies grow on the plate, scattered among other blue (B) colonies.
3.4 Drug proportioning schemeThe results showed that there was redness and swelling around the wound surface in all groups before intervention, accompanied by a large amount of purulent exudation, and all groups had obvious bacterial mats. After intervention, the wound surface area in experimental group C and experimental group D was smaller than that in the control group, and no secretions or bacterial mats were observed (Figure 7). The healing rate of each group is shown in Table 3. The Dunnett-t test showed that the wound healing rate in experimental groups C and D was significantly higher than that in the control group (P < 0.05) (Table 4). Group C had a concentration of 90.78 ± 8.93 (%), while the group D had a concentration of 91.98 ± 9.77 (%). There was no significant difference between the two groups, and both were significantly higher than the other three groups. At the same time, the drug concentration of penicillin G in group C was lower than that in group D, which allowed group C to reduce the amount of antibiotic usage while achieving similar wound healing rates. Therefore, the drug concentration of experimental group C (SH20 μg/mL + PNC15u/mL) was selected for subsequent experiments.
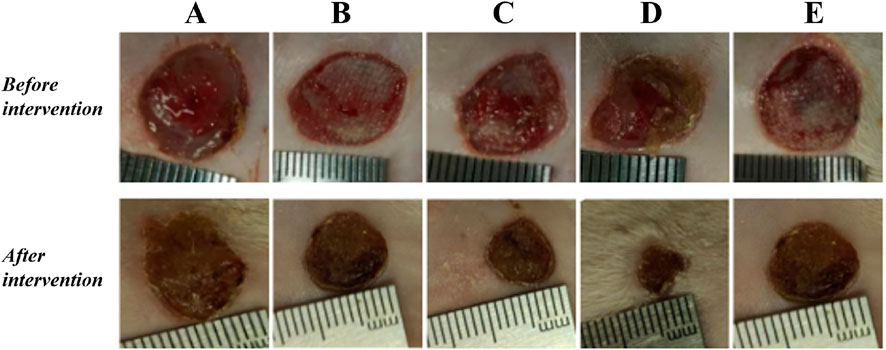
Figure 7. The healing status of MRSA wounds under different medication regimens of SH + PNC. (A) SH5 μg/mL + PNC15u/mL, (B) SH5 μg/mL + PNC30u/mL, (C) SH20 μg/mL + PNC15u/mL, (D) SH20 μg/mL + PNC30u/mL, (E) Normal saline (NS) was used as the blank control group.
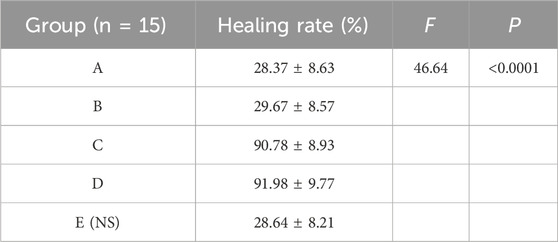
Table 3. The healing rate of MRSA wounds under different medication regimens of SH + NPC.
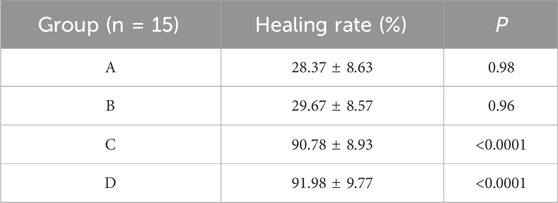
Table 4. Comparison of MRSA wound healing rate within the SH + PNC therapy group.
3.5 Wound healing rateCompared with other groups, the SH + PNC group showed a significant reduction in wound area on day 5, with less purulent secretion and no bacterial mats observed. The wound area in the SH group significantly decreased on day 9. The wound area in the PNC group decreased on day 7, but there was no significant change in purulent secretion compared with the blank control group. It can be seen that the healing time of MRSA infected wounds in the combined medication group is faster and the healing effect is better (Figure 8A).
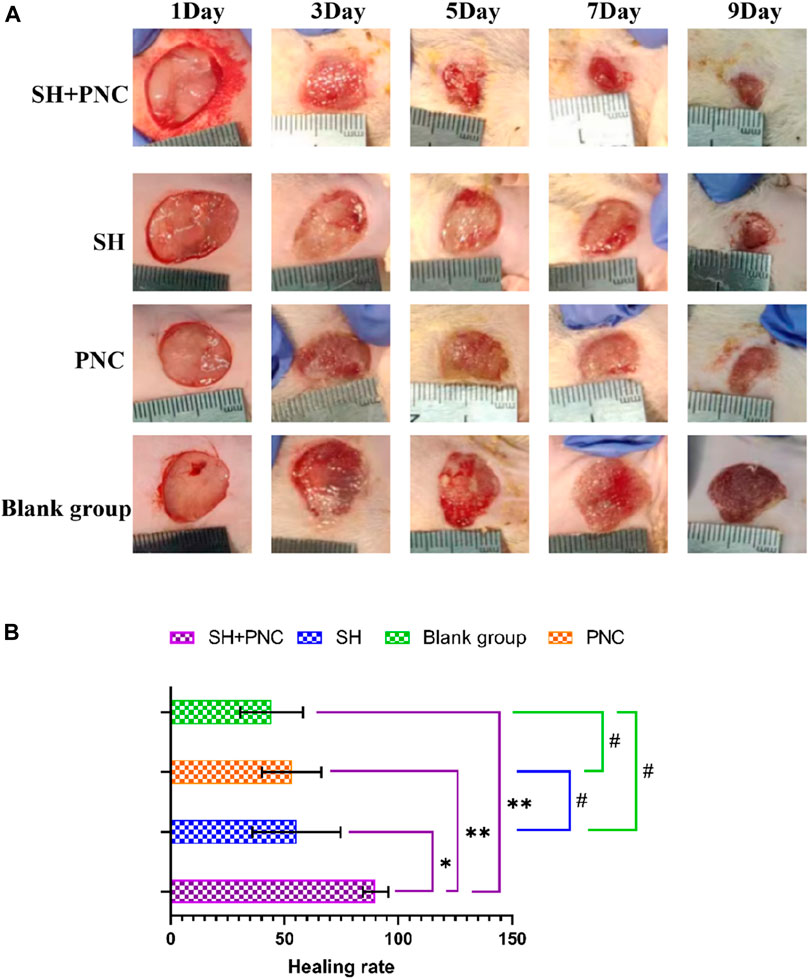
Figure 8. Contrast of infected wounds in MRSA ((A), Photography equipment: SONY IMAX799 ISO:500 WB:6,000 Shutter:1/30 *1). Comparison of wound healing rates between the groups ((B), *p < 0.05, **p < 0.01, #p > 0.05, p < 0.05 indicates statistical significance, while a p < 0.01 indicates a significant difference).
ImageJ software was used to process the images, and the wound area of each group was measured, and the wound healing rate of each group was calculated (Figure 8B, Table 5). The LSD-t test showed that the wound healing rate in the SH + PNC group was significantly higher than that in the other groups (P < 0.05), while there was no significant difference in wound healing rate between the SH, PNC, and blank groups (P > 0.05).
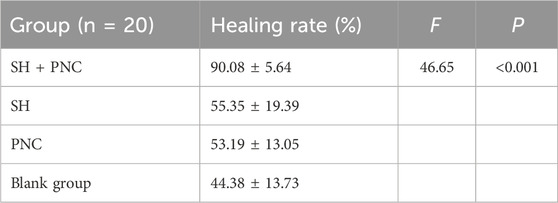
Table 5. Comparison of wound healing rates between the groups.
3.6 Inflammatory factor assayThere were no significant differences in the levels of IL-6, INOS, and TNF-α in the blood of each group before intervention, while there were significant differences in the levels of IL-6 and TNF-α in the blood of each group after intervention (P < 0.05) (Table 6; Figure 9).
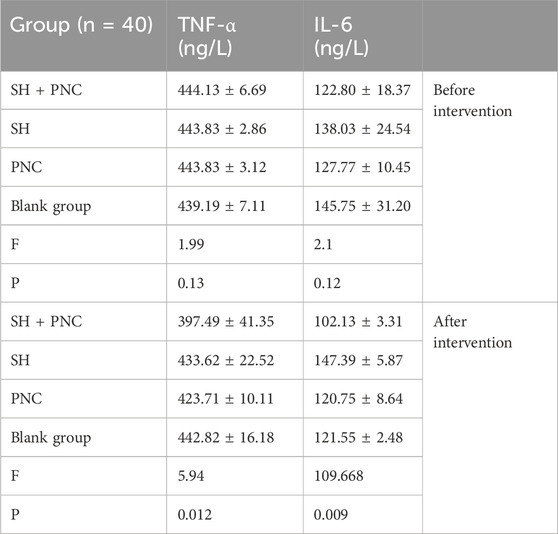
Table 6. Comparison of IL-6 and TNF- α in blood between the groups.
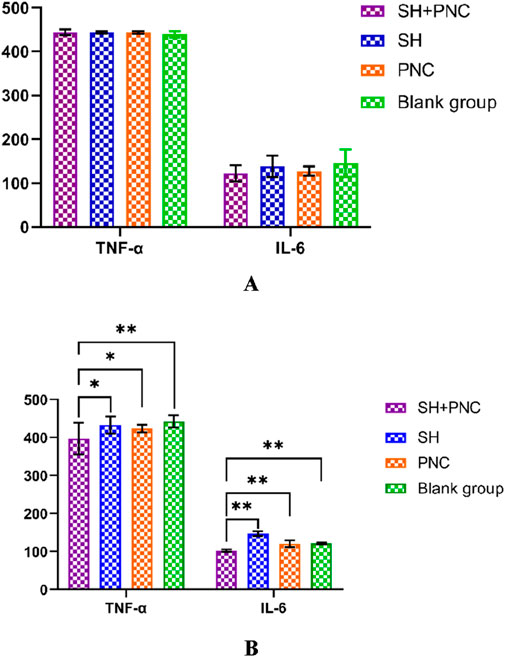
Figure 9. Comparison of IL-6, and TNF- α in blood between the groups before intervention (A). Comparison of IL-6, and TNF- α in blood between the groups after intervention (B) (*p < 0.05, **p < 0.01, p < 0.05 indicates statistical significance, while a p < 0.01 indicates a significant difference).
Using the LSD-t test, it was found that the levels of IL-6 and TNF-α in the blood of the combined medication group were significantly lower than those of the other groups after intervention (P < 0.05). The IL-6 content in the SH group was lower than that in the PNC group and the blank control group (P < 0.05). There was no significant difference in the levels of IL-6 and TNF-α in the blood between the PNC group and the control group.
3.7 HE stainingUnder 100x light microscope, neutrophils were clearly identified based on their microscopic characteristics (Figure 10). Record the average value of the number of neutrophils under random vision (Table 7). The LSD-t test was used to compare the groups, showing that the number of neutrophils in the combined medication group was significantly lower (P < 0.05). There was no significant difference in the number of neutrophils between the SH group and the PNC group.

Figure 10. HE stained wound tissue pathology sections from MRSA. (A) SH + PNC, (B) SH, (C) PNC, (D) Blank group (x100). Comparison of neutrophil numbers in MRSA infected wounds ((E), **p < 0.01, p < 0.05 indicates statistical significance, while a p < 0.01 indicates a significant difference).
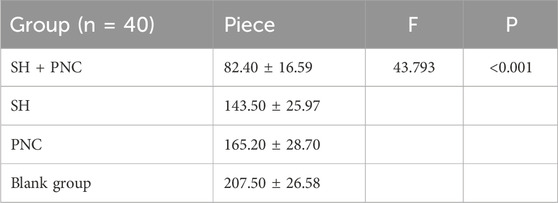
Table 7. Comparison of neutrophil numbers in MRSA infected wounds.
3.8 Masson stainingAs shown in Figure 11, blue represents collagen fibers. Randomly record the image of the field of view, use the ImageJ software to determine the percentage of collagen fibers in the image, and take the average value (Table 8). The Kruskal–Wallis H test was used for intra-group comparison, and the percentage of collagen fibers in the combination group was the highest (P < 0.05). There was no significant difference in the percentage of collagen fibers between the SH group and the PNC group.
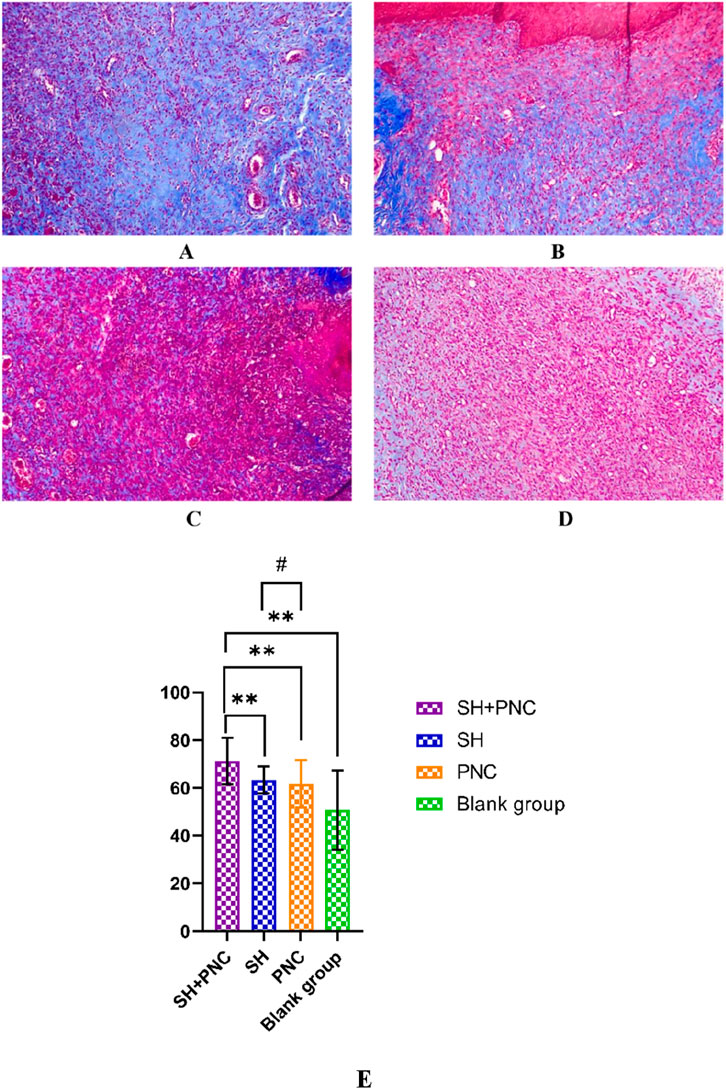
Figure 11. Masson-stained wound tissue pathology sections from MRSA. (A) SH + PNC, (B) SH, (C) PNC, (D) Blank group (x100). Comparison of percent collagen fibers of infected wounds in MRSA ((E), **p < 0.01, p < 0.05 indicates statistical significance, while a p < 0.01 indicates a significant difference).

Table 8. Comparison of percent collagen fibers of infected wounds in MRSA.
3.9 Network pharmacology3.9.1 The targets information of SH and PNCUsing PubChem database, we obtained the 3D structure and smiles chemical formula of SH and PNC. By searching the database separately for keywords’ sodium houttuyfonate “and” penicillin G ′, we obtained 83 and 325 relevant targets, respectively. Upload the above targets to UniProtKB database to get the target standard target names.
3.9.2 Network construction2,362 disease-related targets were obtained by using GeneCards database, Drug Bank database, OMIM database and DisGeNET database. This indirectly reflects the complex molecular pathways and related mechanisms involved in nerve injury. Using Cytoscape software, we interacted SH and PNC targets with disease targets and obtained Venn diagram (Figure 12A).
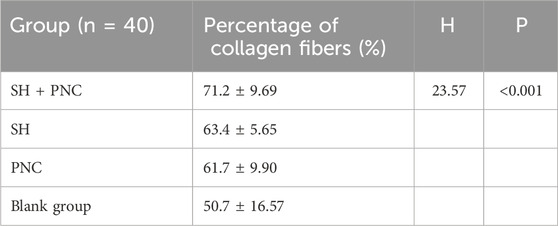
Table 9. Comparison of percent collagen fibers of infected wounds in MRSA.
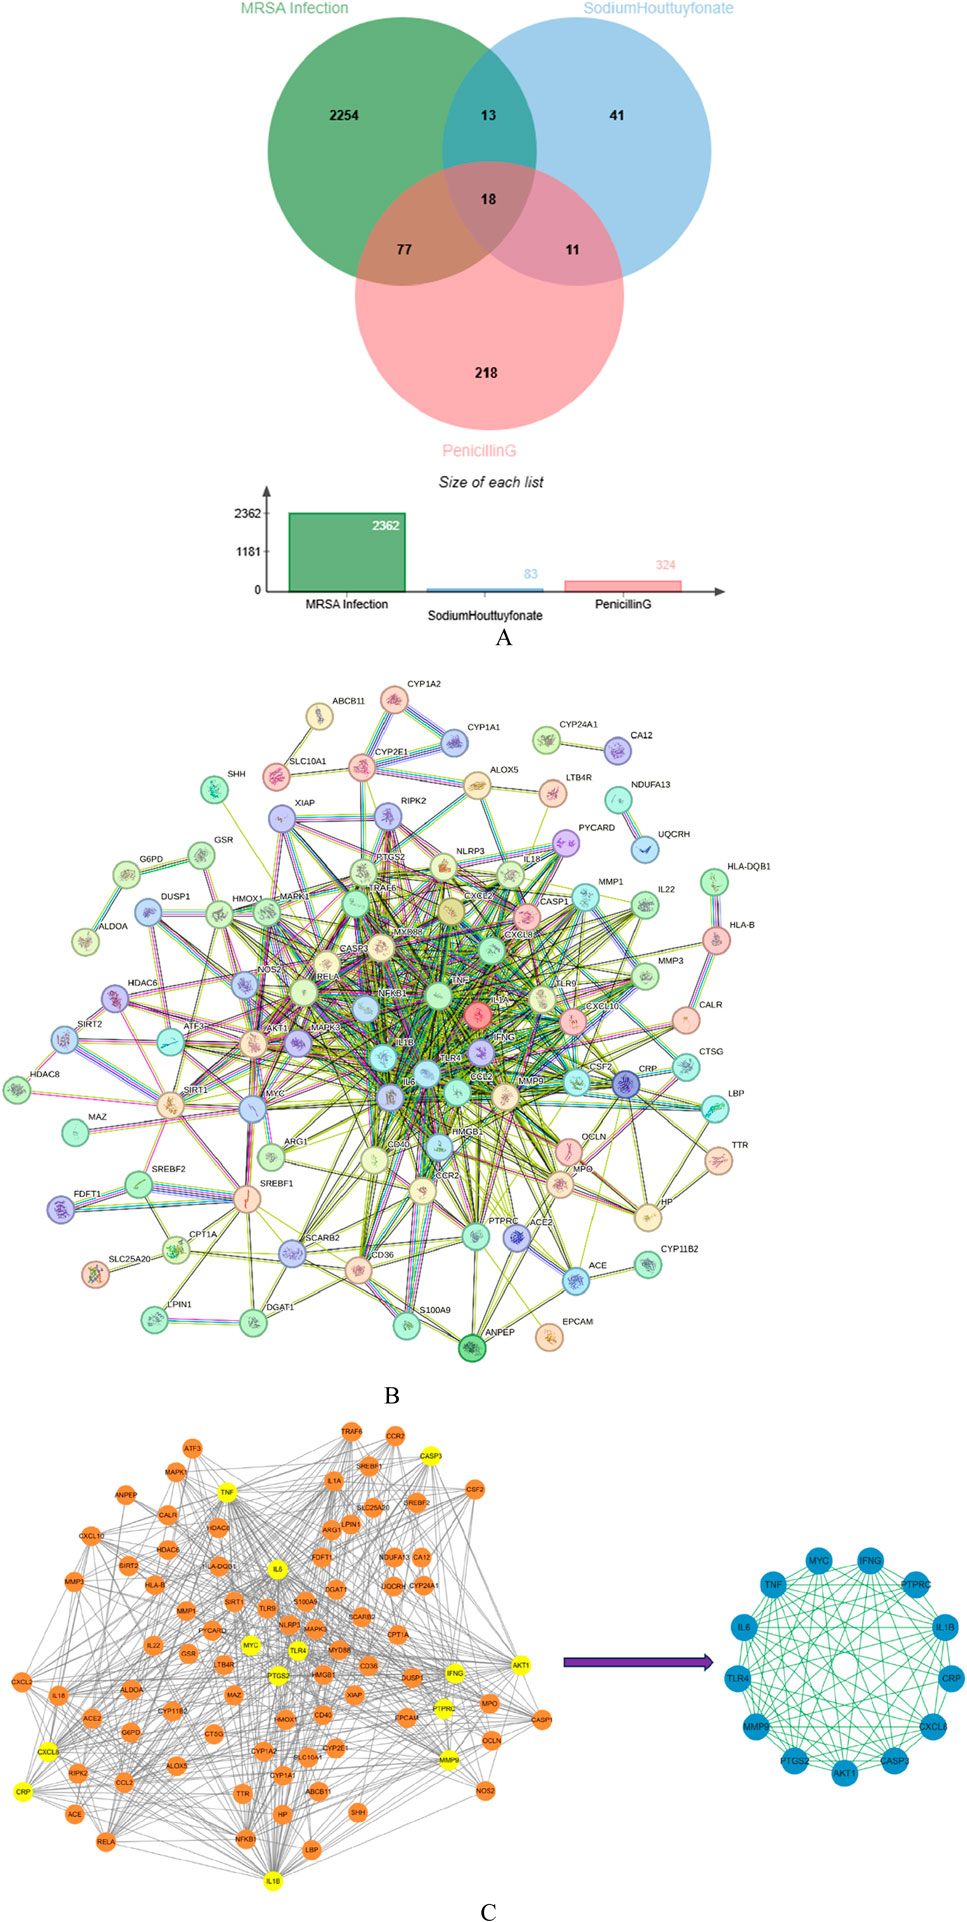
Figure 12. Venn diagram of Sodium houttuyfonate and penicillin G (A). PPI network of potential therapeutic targets (B). Import PPI network data into Cytoscape to obtain protein interaction network, the key target protein interaction network obtained after filtering by CytoNCA analysis (C).
We used STRING database to connect 126 potential therapeutic targets and obtained a PPI network consisting of 86 nodes and 502 edges (Figure 12B) to clarify the potential mechanism of SH combined with PNC on MRSA infected wounds. Then the target protein interaction data were imported into Cytoscape software, and the topological parameters of the network were calculated and analyzed by using the plug-in CytoNCA. The key nodes in the network are screened according to Betweenness (BC), Closeness (CC), Degree (DC), Eigenvector (EC), Local Average Connectivity-based method (LAC), Network (NC) as shown in Figure 12C.
3.9.3 Functional enrichment analyses and compound-target-pathways (CTP) networkDAVID database was used to conduct GO enrichment analysis and KEGG pathway enrichment analysis on the core targets to study the biological mechanism, and the biological process, cellul
留言 (0)