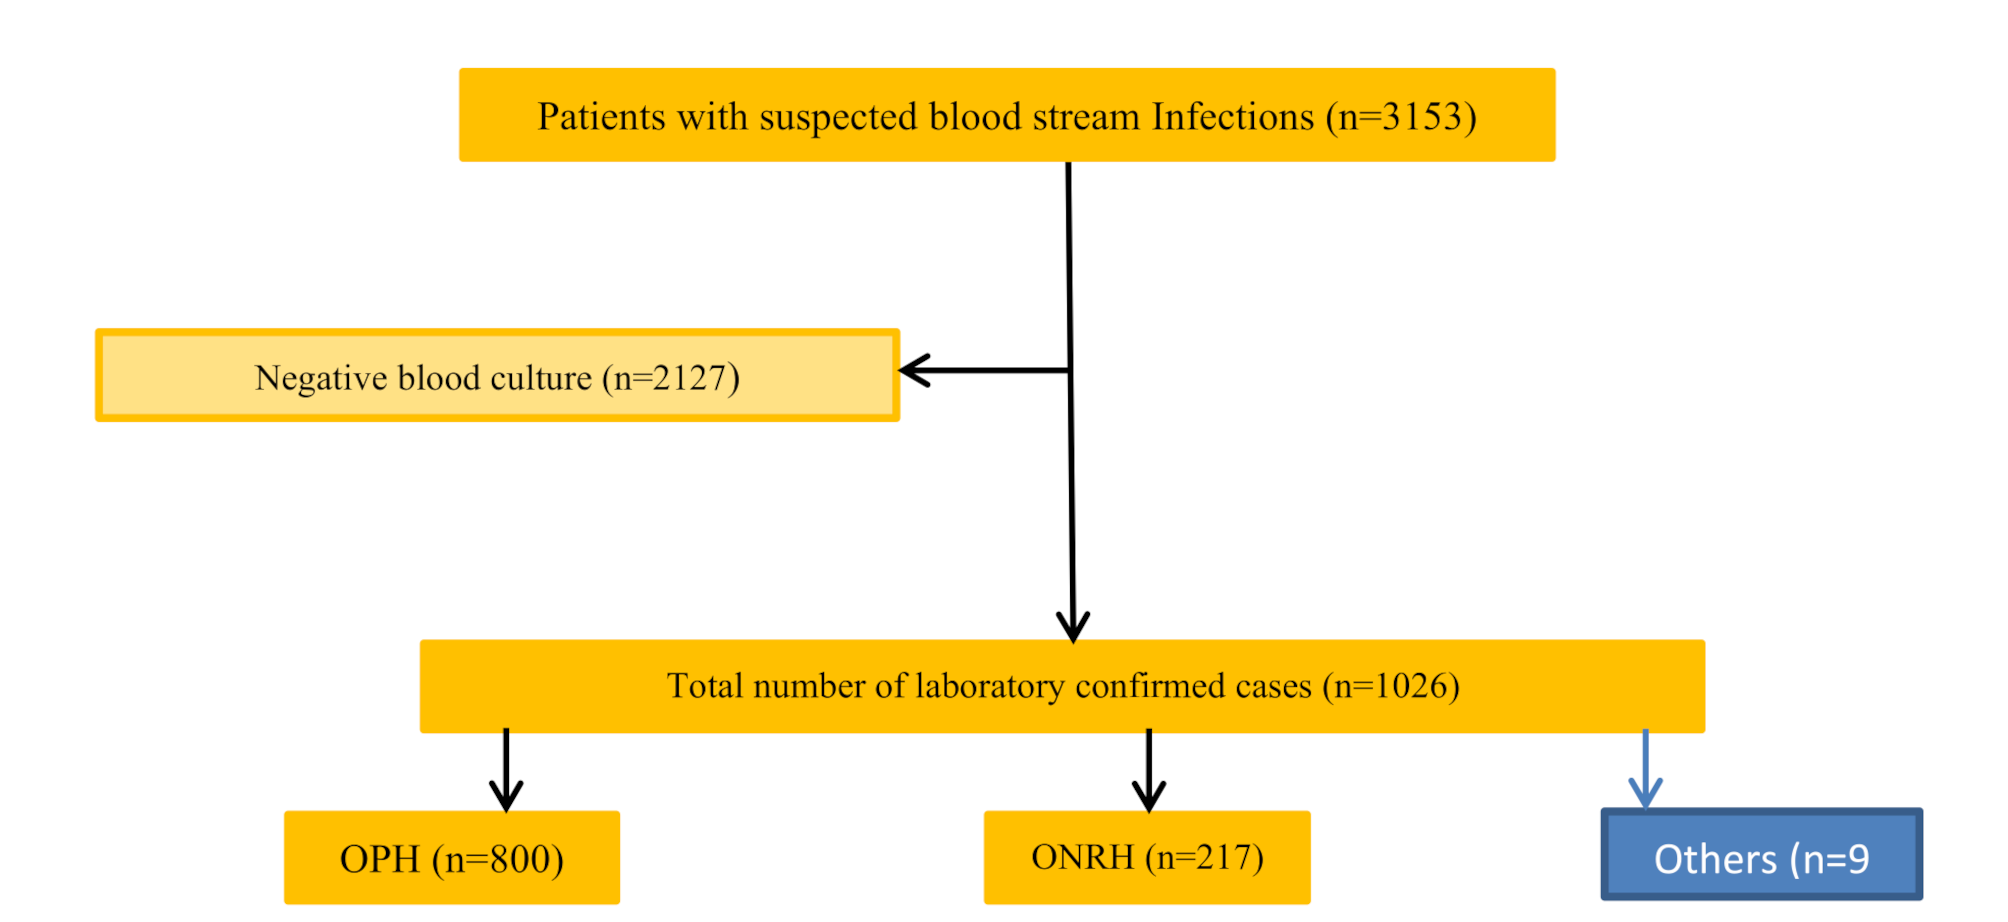
In their 2022 report, the GLASS-AMR group of experts noted that a high percentage of AMR and AST tests within a country are essential to optimise the empirical treatment of BSIs. Unfortunately, there is a wide intra- and inter-country/or regional variation in testing coverage. In a recent analysis of LMIC vs. HIC data on BCIs, the researchers demonstrated that HICs tend to have greater testing coverage (> 229.4–826.6 per 1 000 000 vs. < 0.7–3.3 per 1000 000 population for countries in East Africa [4]. In our study, we observed that over a 9-year period, the NHL received ~ 3153 blood culture samples from a population of ~ 4 000 000 or 87.58 samples per 1 000 000 population per year.
Under-utilisation of clinical microbiology services (CMS), even in the treatment of patients with sepsis; is a well-documented phenomenon in LMICs [4, 19]. The severity of this problem can be demonstrated by the large gap between sepsis estimates in LMICs and BCI per 1000 000 population. For most countries in East Africa, for example, sepsis estimates are below the recent GBD BCI per 1000 000 population estimates: > 2500 to < 3400 per 100 000 vs. < 0.7–3.3 per 1000 000 [1, 4]. All in all, one inescapable conclusion from these results is that the CMS in NHL is underutilised and that the treatment of sepsis in Eritrea is largely unguided by AST data.
The limited range of antibiotics tested and the limited range of media used in this laboratory can undermine diagnostic and surveillance functions. Examples of antibiotics that were not tested but are widely used in the country included amoxicillin [20]. Other agents included Amoxicillin/clavulanic acid (Augmentin©) – used in the combination disk diffusion test (CDDT) for ESBL -/AmpC β-lactamases (AmpC)-/carbapenemases producing organisms [21]. It should be noted that confirmatory testing for ESBL production using phenotypic tests such as CDDT or molecular methods is recommended for 3GC-R organisms [22]. Additionally, several techniques used at the NHL for AST evaluation are not recommended in the CLSI M100 guideline. These include the use of oxacillin instead of cefoxitin for the detection of MRSA; and the disc diffusion method, instead of MIC methods (E test and broth dilution test), for the evaluation of vancomycin resistance [16]. In the former, experts have argued that cefoxitin is a better inducer of mecA-mediated resistance and that disc diffusion methods can overestimate vancomycin resistance [23].
Separately, we demonstrated a correlation between distance to the laboratory and pathogen recovery rates. In terms of distance with respect to NHL, Sembel and Haz Haz, which recorded the lowest recovery rates, are the farthest. This finding highlights a potential problem with existing specimen transport modalities. By and large, the use of out-dated tests (a common practice in most CML in Sub-Saharan Africa), along with the inability to test for specific drug-pathogen combinations listed in the WHO Priority Level (critical) list (Carbapenem-resistant Enterobacteriaceae) needs argent re-evaluation.
Based on these findings, the need to build capacity is clearly highlighted. The decentralisation of CMS and the adoption of automated continuous monitoring blood culture instruments (BACTEC, VersaTREK, or VITEK) in the NHL can be recommended. Other options, atleast in the long term; may include the adoption of fast identification methods such as matrix-assisted laser resorption/ionization - time of flight mass spectroscopy (MALDI TOF MS); real-time polymerase chain reaction (RT-PCR) based methods; fluorescence in situ Hybridization (FISH) based methods; whole genome sequencing, and other molecular assays [24].
Another prominent finding, with a far-reaching implication for CML practice in Eritrea, was the incidence of blood culture contamination (BCC). In general, BCC in BSIs in LMICs is poorly researched [4]. In the limited number of published BSI literature with BCC information, considerable heterogeneity abounds with respect to the methods used to distinguish between true pathogens and contaminants [25,26,27,28]. For example, Berkeley et al.. (2005) employed an identity-based system which classified all isolates of CoNs, Bacillus spp., Micrococcus spp., and viridans streptococci isolates as contaminants regardless of the clinical picture. In contrast, Hattori et al. (2018) included episodes of BSIs with CoNs, Bacillus spp., Corynebacterium spp., and Cutibacterium spp [29].,. More recent algorithms rely on the number of positive cultures (isolation of commensals which are also known to be pathogenic in ≥ 2 culture sets) and clinical scenario [19]. In our analysis, positive cultures of GPB, viridans streptococci, and CoNs without AST data were characterized as potential contaminants. Based on this approach, potential contaminants represented 363 (35.4%) of BCI. Heterogeneity in the distribution of contaminants across hospitals was also observed– note that all isolates in hospitals other than OPH or ONRH were potential contaminants. Although the difference in methodology limits the comparability of the results across the region; our results suggest that BCC maybe a problem in the setting.
According to the existing literature, a high incidence of BCC can have several adverse clinical and financial consequences for patients and hospitals [30]. In particular, some authors have argued that it has the potential to undermine the utility of CML in patient care [31]. That is to say, some physicians / clinicians believe that BCC is the result of poor laboratory practice. Inexorably, this perception can create the sense that the results from a specific CML are unreliable. This assumption may, in turn, lead to under-utilization of CML services in these settings. Ironically, BCC occurs mainly during pre-analytical procedures such as sample collection and, to a lesser extent, during sample processing [31]. Therefore, the under-use of CML services in these settings points to the need for better collaboration between clinicians and laboratory personnel. To reduce the incidence of BCC to the required threshold (< 3%); expert opinion reiterates the need for prudent selection of patients; well-trained phlebotomy teams; surveillance and feedback; and the presence of multidisciplinary quality assurance teams, among others [31].
Although our analysis cannot provide comprehensive information on AMR resistance in Eritrea; it allows organism-level analysis that can allow us to assess the nature of the organism that circulates in specific hospitals in the country. As in other studies [28], CoNs was the predominant isolate in the respective scalar years (≤ 2016: 60 (48.4%) vs. ≥ 2020: 65(23.1%). The predominance of CoNs in this setting has multiple explanations, but only one imputation. In the first place, CoNs infections are particularly relevant as hospital-acquired or catheter-associated infectious agents and are a problem in preterm new-borns and /or neonates; elderly patients, critically ill patients, and, often, immunocompromised patients [32]. In our study, we believe that the low median age of the patients (median 1.2 years (IQR: 0.01 months − 15 years) implicates central line - associated blood stream infections given the fact that neonates are usually treated with central vein catheters.
Possible misclassification of non-pathogenic CoNs as pathogenic is another explanation for the high incidence of CoNs in most settings in the region. As mentioned previously, drawing a distinction between pathogenic vs. non-pathogenic CoNs in BCI is complicated as there is no single benchmark with adequate level of specificity [28]. In our study, the problem was compounded by several factors, which are relatively common in the region; including the use of a single culture set and the absence of patient and species-level data on CoNs. Note, for instance, that among the 41 or CoNs isolates; the only clinically relevant CoNs are Staphylococcus epidermidis, Staphylococcus saprophyticus, Staphylococcus haemolyticus, Staphylococcus schleifieri, Staphylococcus xylosus, Staphylococcus hominis, and Staphylococcus lugdunensis [28]. Therefore, species-level analysis is critical. All these, it must be emphasised; add uncertainty about the reliability of CoNs data from the region. To provide conclusive recommendations, additional research should be undertaken. Future research should leverage genomic technologies alongside better research designs.
Separately, analysis of the AST profiles of the 189 (34.3%) pathogenic CoNs demonstrated a high resistance to penicillin, 168 (92.3%); oxacillin, (171(94.5%); and gentamicin, 104 (56.5%). Moderate resistance to vancomycin was also noted. Furthermore, we demonstrated that MDR resistance has increased overtime (≤ 2016: 25 (41.7%), vs. ≥ 2020: 50 (76.9%), p-value 0.001). High resistance to oxacillin has been reported in other studies [28]. Others have noted that horizontal transmission of genes such as the mecA gene (which mediates methicillin resistance and is located in SCCmec– a mobile genetic element) to other staphylococcal species is possible and that this can increase cross resistance against many antibiotics [33].
Among all BCIs analyzed, Staphylococcus aureus, one of the WHO’s high-priority pathogens, was ranked 5th in frequency. Overtime, clear evidence of a significant decline in the isolation rate was also observed. Currently, the reasons for the observed decline remain unknown. In general, the low frequency of Staphylococcus aureus reported in this study is unusual for the region - it is the number 2 pathogen in most settings [34]. In line with previous studies in the country [35, 36]; we demonstrated a high resistance to TMP-SMZ, 26 (68.4%); penicillin, 38(86.4%); and oxacillin, 37(80.4%). Other notable AMR profiles included moderate resistance to ciprofloxacin, 19(45.2%); tetracyclines, 18(43.9%); erythromycin, 18 (42.9%) and gentamicin 14(31.1%). The high rate of resistance to commonly used antibiotics is a well-documented phenomenon in the region [37, 38] and has been linked, in the past; to a high frequency of MRSA. In general, MRSA usually has other resistance genes (e.g., determining resistance to gentamicin, sulphonamides, kanamycin, streptomycin, macrolides, fluoroquinolones or tetracyclines) and therefore can be classified as MDR [39].
Unlike previous studies [38], the frequency of VRSA was extremely high − 14(31.1%). In the past, the use of the disk diffusion method; which has a high incidence of false positivity, has been mentioned as a possible explanation [40]. Whether the foregoing explanation is true for these settings remains unknown. This non-resisting, MRSA and VRSA carry a serious prognosis, a recurrence rate, 5 − 10% [41]; high mortality rates; and the danger associated with their presence in any setting cannot be underestimated.
The main Gram (-ve) bacteria associated with BSIs were, in order of decreasing frequency: Klebsiella spp., Escherichia coli, Citrobacter spp., Enterobacter spp., Pseudomonas aeruginosa, and Salmonella spp. Except for the period prior to < 2014, Gram (-ve) predominated in subsequent scalar years. The prevalence of Enterobacterales in BSIs in LMICs is consistent with the findings of several studies [42,43,44,45]. In most of these studies, Escherichia coli or Klebsiella spp., are the dominant Gram (-ve) organisms. In a recent systematic and meta-analytical review on BSIs in Ethiopia, Alemnew et al. reported a pooled prevalence of 7.04% and 1.69% for Klebsiella spp., and Escherichia coli, respectively. In Egypt, Escherichia coli was the most frequently identified Gram (-ve) bacteria (35%), followed by Klebsiella spp. (13%) [46]. Others have reported a pooled prevalence of 129 (46.7%) for Klebsiella spp., versus 128 (17.3%) for Escherichia coli in Vietnam [47]. Another notable result was the low prevalence of Salmonella spp., prior to < 2019. This is contrary to reports from other regions (mostly South East Asia), where Salmonella spp., is known to be a prominent pathogen in BSIs [48]. Altogether, there are few explanations and hypotheses for the remarkable variation in pathogen distribution in patients with BSIs in most settings.
In a separate analysis, we demonstrated that isolates of Klebsiella spp., Escherichia coli, Pseudomonas aeruginosa, Enterobacter spp., and Citrobacter spp., had a high resistance (ranging between 54.5% and 96.7%) to several first-line antibiotics, gentamicin; tetracycline, ampicillin, TMP-SMZ, cephalosporins (cephalexin, ceftazidime and ceftriaxone). In the last GLASS report (2022), the authors noted that a high rate of resistance to 3GC is generally associated with the presence of ESBL. Importantly, resistance to 3GC is known to be a critical determinant of poor outcomes - increasing the odds of death 15-fold in some settings [19]. Equally significant is the high resistance to TMP-SMZ. This is because TMP-SMZ resistance genes in enterobacterales are frequently associated with mobile genetic elements that increase the likelihood of pan drug resistance or extreme-drug-resistance [49].
When comparing our data with a systematic review of Gram (-ve) AMR in BSIs in resource-limited countries, we noted a number of striking similarities. For example, resistance of Escherichia coli to 3GC was comparable to what has been reported in other LMICs − 39(60.9%) vs. 58.3% (IQR 39.8–70.2) in LMICs [4]. In line with previous studies, amikacin, and to a lesser extent, ciprofloxacin; demonstrated better efficacy against Gram (-ve) bacteria. The relative effectiveness of amikacin in this setting may be due to its limited availability.
The problem of AMR was further compounded by the phenomenon of co-resistance, which enables isolates to be resistant to multiple agents by acquiring multiple mobile elements (transposons and plasmids) or chromosomal mutations. In this study, this phenomenon was evaluated using two indexes– the MDR and MAR index. Accordingly, MDR organisms were predominant, 472 (79.1%). Significant variations in MDR were observed between disparate etiological agents, with Pseudomonas spp., Citrobacter spp., and Enterobacter spp., exhibiting rates > 90%. Compared to other studies from the region (Kenya– Meru (46.3%) [50] Ethiopia– South Ethiopia (33.1%) [51]; Arba Minch (60.3%) [52] and Jimma (62.7%) [53]); the prevalence of MDR was higher (472 (79.1%): Of further concern, a significant increase in MDR rates was observed for some pathogens - Acinetobacter spp., and CoNs.
MDR or co-resistance, in general, has multiple imputations in any setting. Previous research has, for instance, shown that co-resistance can stymie AMR control strategies/policies which rely on restricting the use of antibiotics with high resistance rates. According to this position, co-resistance may lead to the persistence of resistance to specific antibiotics despite a drastic reduction in usage. For example, resistance to TMP-SMZ in Escherichia coli remains high in clinics across the United Kingdom despite a drastic reduction in its use [54]. The high prevalence of isolates which are co-resistant to ampicillin, gentamicin and 3GC has serious practical implications for current WHO guidelines for the treatment of neonatal sepsis (the guideline recommends the combined use of ampicillin or benzylpenicillin for 7–10 days with 2 doses of gentamicin as first-line empiric therapy [55]. Commenting on this problem, some authors have suggested that the high rate of co-resistance to ampicillin and gentamicin; and the observed species-level variance, points at the need for AST-guided antimicrobial therapy [44]. This is particularly important as the remaining therapeutic options such as meropenem, chloramphenicol (in some agents), and vancomycin (for Gram + ve bacteria) are relatively expensive and can trigger adverse reactions, particularly in infants; if not adequately monitored [55].
Finally, the MAR index has been described as a cost-effective and easy-to-use tool for monitoring selection pressure exerted by the use of antibiotics on bacterial isolates. For example, the MAR index > 2 is frequently observed in bacterial isolates from settings where exposure to antibiotics is high. Others have argued that a high MAR index highlights the potential misuse of broad-spectrum antibiotics in hospital environments. In this study, the MAR index was > 2 (mean (± SD) = 0.55 (± 0.23)) with wide species-level variation. Except for 2020, we also observed an increase in the overall MAR index over the duration of the study.
Similar to other studies [23], the decrease in the MAR index in 2020 can be explained by a number of factors, including random fluctuations in the number of samples and changes in healthcare practice. For instance, stringent measures including travel restrictions, changes in admission requirements (and attendant changes in patient mix), or the more stringent infection control measures associated with COVID-19 may account for the slight deepening of the MAR index in 2020. Using timed cluster density analysis, we demonstrated that resistotypes diversity has increased over time. Such increases, it has been argued, may not necessarily be due to the spread of a single gene cassette carrying multiple genes, but may be due to the spread of multiple phenotype co-resistance/multiple genetic determinants [56].
Strengths and limitations of the study
Our study has several biases and limitations. First, retrospective studies have some inherent limitations, including data quality issues and data missingness. Note, for instance, that the NHL logbook does not contain information on hospital acquired blood stream infections; primary or secondary bacteraemia; reference information; device-related blood stream infection; previous antibiotic use, sepsis, or other outcomes, among others. Second, the fact that our data was extracted from a laboratory register from a facility which sources samples from centralized tertiary level facilities imposes considerable limits on the representativeness and generalizability of our findings. Indeed, one might even argue that the age bias and year-to-year variations in the number of samples submitted by the respective institutions have more to do with vagaries of institutional practices (or other confounders) than with true epidemiological trends. Third, and in some instances, the use of out-dated techniques and lack of confirmatory testing means that our results should be interpreted with caution. Although these factors may limit the quality of our findings, they only affect a subset of the information provided. Furthermore, these concerns are relatively common in a large number of published studies from LMICs.


留言 (0)