
記住我
Vertebrate branchial arches (BAs) represent a principal developmental model that incorporates segmented design, cell migration and tissue specification. The BA transient domains arise during mid-embryonic development and comprise a series of outgrowths on each side of the embryonic head and pharynx, ultimately contributing to mature head, neck, and cardiovascular structures (Frisdal and Trainor, 2014; Xu et al., 2024). Correct formation of these mature structures relies on the interplay between distinct embryonic populations found within the BAs: a mesenchymal core containing mesoderm and cranial neural crest (NC) surrounded by endoderm and ectoderm epithelia (Frisdal and Trainor, 2014; Graham and Richardson, 2012). Cranial NC cells that populate the BAs, originate from the hindbrain, and undergo epithelial to mesenchymal transition to migrate in discrete streams to the BAs (Kulesa et al., 2010). These cells express distinct members of Hox cluster genes, which is central to BA patterning (Frisdal and Trainor, 2014). As cranial NC have the potential to give rise to a range of tissues including muscular, skeletal, vascular, and nervous, failure of migration and differentiation has been associated with multiple congenital defects (Etchevers et al., 2019).
In mammals there are five pairs of BAs: BA1, BA2, BA3, BA4, and BA6 (Frisdal and Trainor, 2014). In this study we refer to the latter three, and the connected outflow tract (OFT), as the PBA/OFT. The PBA/OFT domain gives rise to multiple structures of the cardiovascular system, partly due to the migration of a subpopulation of cranial NC called cardiac NC. This subpopulation migrates from more caudal regions of the hindbrain, compared to other cranial NC, into the PBA/OFT (Boot et al., 2003; Kirby et al., 1983; Kirby et al., 1985). Cardiac NC initially form smooth muscle cells for the BA arterial system, connecting the embryonic heart to the dorsal aorta (Bergwerff et al., 1998). BA arteries undergo subsequent remodelling into the great arteries, with cardiac NC contributing to the septation of the OFT into the aorta and pulmonary artery (Hiruma et al., 2002; Jiang et al., 2000). Additional cardiovascular derivatives of cardiac NC cells include parasympathetic nerves and the surrounding cells of the His-Purkinje system (Gurjarpadhye et al., 2007), as well as a reported small proportion of cardiomyocytes (Soldatov et al., 2019). The PBA also contribute to the formation of carotid arteries supplying blood to the head and neck (Frisdal and Trainor, 2014).
MicroRNAs are important factors in regulating embryonic development, with multiple studies validating their roles in cell fate decision and tissue patterning (Aboobaker et al., 2005; Alzein et al., 2021; Crist et al., 2009; Li et al., 2021). Generally, microRNAs are understood to execute two different mechanisms of regulation. The first mechanism regards microRNAs as “on-off” switches, whereby they are anticorrelated in expression with their targets; this mechanism has been associated with earlier embryonic development (Avital et al., 2017). The second mode sees microRNAs as fine-tuners of their targets, stabilising their expression and attenuating noise brought about by stochasticity. These microRNAs are reported to be expressed later during development and generally show overall weaker repressive abilities (Avital et al., 2017). Weaker repression across many targets has been shown to stabilise GRNs through cumulative effects (Chen et al., 2019; Ma et al., 2018; Zhao et al., 2018).
MicroRNA-mediated regulation occurs during cardiovascular and craniofacial development. Disruption of the microRNA biogenesis pathway, through NC conditional Dicer loss of function, has been implicated in abnormal BA vessel remodelling (Nie et al., 2011) and OFT morphogenesis (Saxena and Tabin, 2010). Furthermore, Dicer loss of function in mouse models resembles several congenital phenotypes observed in DiGeorge Syndrome (DS) patients (Nie et al., 2011). DS individuals commonly have a genomic deletion encoding DGCR8 (Sellier et al., 2014), which is essential for microRNA processing (Gregory et al., 2004). In addition to incorrect BA arterial remodelling, disrupting microRNA biogenesis also leads to craniofacial defects, due to aberrant skeletal formation and muscular maldevelopment (Nie et al., 2011). Taken together, microRNA biogenesis and expression are important for normal development of BA derivatives.
In this study we present novel microRNA-seq datasets that characterise global microRNA expression during mouse BA development. We find 550 microRNAs expressed across BA1, BA2, and the PBA/OFT, with many microRNAs demonstrating progressive expression across the anterior-posterior axis. Using time-matched BA RNA-seq datasets (Losa et al., 2017), we identified candidate microRNA target genes enriched for biological processes linked to cardiovascular development. Using in silico microRNA target prediction and in vitro microRNA target validation, we identify a role for miR-92b-3p as a key cardiovascular developmental regulator, adding to previous studies that have demonstrated miR-92b-3p regulates transcripts that encode for cardiac TFs Hand2 and Mef2d (Chen et al., 2012; Hu et al., 2017; Yu et al., 2019). We hypothesise that miR-92b-3p works in multiple microRNA-mediated coherent feedforward loops within cardiovascular GRNs, ultimately stabilising target gene expression during mammalian PBA/OFT development.
2 Materials and methods2.1 BA dissection, RNA extraction and library preparationWild type (CD1) mice were time-mated to obtain tissue for microdissection. Animal experiments followed local legislations regarding housing, husbandry, and welfare (ASPA 1986; United Kingdom). Embryos were collected at E10.5 and E11.5 and accurately staged by counting somites. BA1, BA2 and PBA/OFT tissues were dissected and snap frozen on dry ice and stored at −80°C until RNA extraction. The OFT was harvested with the PBA as it acts as a landmark feature during dissection and maintains physical integrity of the PBA. BAs from three closely staged embryos were pooled for each library, with BA1, BA2 and PBA/OFT from the same embryos being used for each timepoint replicate. Total RNA was extracted using the miRNeasy micro kit (Qiagen, #217084) following the manufacturer’s instructions, eluted into RNase-free water and stored at −20°C until library preparation. Small RNA libraries were generated using the NEBNext Small RNA Library Prep Set (New England BioLabs, #E7330S) following manufacturer’s instructions. For size selection we used gel separation and extracted amplified microRNA cDNA bands corresponding to 140bp. NEBNext Index primer sequences and respective libraries are listed in Supplementary Table S1. Libraries were quality checked using the Agilent 2200 BioAnalyzer TapeStation and sequenced on the Illumina HiSeq 4000 at The University of Manchester Genomics Technologies Core Facility. Small RNA-seq libraries have been deposited under project accession PRJEB64007 available from the European Nucleotide Archive.
2.2 Small RNA-seq analysisNEBNext Small RNA adapter sequences were removed using cutadapt v1.8 (Martin, 2011). Adapter-trimmed reads were filtered to keep those 18–25 nt in length, and mapped against mouse tRNAs [mm 10, GtRNAdb v18.1 (Chan and Lowe, 2016)] and rRNAs [Mus musculus, Silva SSU/LSU r138.1 (Ludwig et al., 2004; Quast et al., 2013)], using Bowtie v1.1.0 (Langmead et al., 2009). Reads that mapped to tRNAs/rRNAs were discarded from further analysis. Remaining reads were mapped to the mm10 primary fasta file (GRCm38, release M23) using bowtie v1.1.0 (Langmead et al., 2009) with the following settings: bowtie -v1 -a -m5 –best–strata. To predict novel microRNAs, we used miRDeep2 v0.1.3 (Friedländer et al., 2011) with combined filtered reads from all our small RNA-seq libraries. Reference microRNAs included stem-loop mouse, mature mouse and mature rat microRNAs, all downloaded from miRBase v22 (Kozomara et al., 2019). Novel pre-microRNAs were filtered using the following criteria: ≥30 0-mismatch reads for the mature arm and ≥10 0-mismatch reads for the star arm, no internal sub-hairpins, ≥50% 5′ arm homogeneity, 0-4 nt overhang at the 3′ arm, hairpin free energy ≤ −0.2 kcal/mol/nt. Custom Python scripts used for filtering are available at github.com/SianGol. Pre-microRNA sequences that met all the above criteria were input into Rfam v14.6 sequence-search (Kalvari et al., 2020) to remove any that overlapped with previously annotated ncRNAs. Remaining novel microRNAs were added to the GTF file of known microRNAs, downloaded from miRBase v22 (Kozomara et al., 2019). Genome-mapped reads were assigned to mature microRNAs and quantified using featureCounts v1.6.0 (Liao et al., 2014) with the following settings: featureCounts -M -g gene_id -s 0.
2.3 RNA-seq analysisBA1, BA2 and PBA/OFT E10.5 and E11.5 (Losa et al., 2017) RNA-seq libraries were adapter-trimmed and quality-filtered using Trimmomatic v0.36 (Bolger et al., 2014). We used STAR v2.5.3a (Dobin et al., 2012) to generate the mm 10 genome index (GRCm38, release M23) and map RNA-seq reads to the genome using the mm 10 genome primary fasta file and corresponding GTF file, both downloaded from GENCODE (Frankish et al., 2021). Mapped reads were then assigned to annotated genomic features and quantified using featureCounts v1.6.0 (Liao et al., 2014), with options set as following: featureCounts -g gene_id -s 2.
2.4 Differential expression of small RNA and RNA-seq datasetsTo remove lowly-expressed genes, a threshold was set for our RNA-seq libraries: 4.2CPM (corresponding to approximately 100 reads) for small RNA-seq, and 0.38 CPM (corresponding to approximately 10 reads) for RNA-seq. Genes with CPM above these thresholds in two or more libraries were kept for further analysis. Differential analysis was performed using DESeq2 (Love et al., 2014) and results were obtained for the following pairwise comparisons: E10.5 BA1 vs. BA2, E10.5 BA1 vs. PBA/OFT, E10.5 BA2 vs. PBA/OFT, E11.5 BA1 vs. BA2, E11.5 BA1 vs. PBA/OFT, E11.5 BA2 vs. PBA/OFT.
2.5 MicroRNA target prediction3′UTR coordinates of BA transcripts were identified using the mm10 GTF and extract_transcript_regions.py (Floor, 2018). The longest 3′UTR for each gene was used, alongside BA expressed microRNAs, as inputs for in silico microRNA target prediction by seedVicious v1.3 (Marco, 2018). Results were filtered to remove predicted interactions with 6mers, off-6mers, sites with a hybridisation energy of >−7 kcal/mol, and 3′UTRs with <2 predicted microRNAs binding sites.
2.6 PBA/OFT gene set and microRNA-target enrichment analysisE10.5 PBA/OFT Gene Ontology (GO) terms were identified using PANTHER (Mi et al., 2018). The background genes used were those differentially expressed (±1.5-fold, adj-p ≤ 0.05) in any BA pairwise comparison, and the input genes were those >1.5-fold (adj-p ≤ 0.05) expressed in the PBA/OFT compared to BA1 and BA2. We defined our PBA/OFT gene set as those annotated under the most significant GO terms returned (≥2-fold, FDR ≤ 0.05) by PANTHER. To perform a hypergeometric test for enrichment, we used the phyper function in R, with PBA/OFT-gene-set-microRNA interactions as the ‘sample’, and all BA-microRNA interactions as the “population”.
2.7 hESC cardiomyocyte differentiationNKX2-5eGFP/w hESCs (Elliott et al., 2011) were seeded in hESC medium (DMEM/F-12 (Gibco, #31765027), 1X None-Essential Amino Acids (Gibco, #11140050), 1X GlutaMAX (Thermo Scientific, #35050038), 0.1 mM 2-ME (Gibco, #21985023), 0.5% penicillin-streptomycin (Sigma-Aldrich, #P0781), 20% KnockOut Serum Replacement (KSR) (Gibco, 10828028), and 10 ng/mL bFGF (Miltenyi, #130-104-924)) at a density of 1.8 × 10⁵ cells/mL on growth factor-reduced Matrigel coated 6-well plates. Twenty-four hours later (day 0) differentiation was induced as described previously (Giacomelli et al., 2020). hESC medium was replaced with BPEL (Ng et al., 2008) supplemented with BMP4 (Bio-techne/R&D, #314-BP-050), 20 ng/mL ACTIVIN A (Miltenyi Biotec, #130-115-009) and 1.75 μM CHIR99021 (Selleckchem, #S1263). On day 3, media was refreshed with BPEL containing 1 μM XAV939 (VWR, #CAYM13596-1). BPEL was refreshed every 3 days thereafter.
2.8 Cloning 3′UTRs into dual luciferase reporter vectorsCandidate target 3′UTRs were amplified using the following reaction; 1X Q5 Reaction Buffer (New England BioLabs, #B9027S), 20 units/mL Q5 High-fidelity DNA Polymerase (New England BioLabs, #M0491S), 0.6 μM 3′UTR F/R primer (Supplementary Table S1), 0.2 mM dNTP mix (Promega, #U1511), 2 μL DNA, and RNase free water, using the cycling conditions: 98°C 1 min, 35X [98°C 10 s, 58°C 30 s, 72°C 1 min], 72°C 2 min. Amplified 3′UTRs were size selected and purified using the QIAquick Gel Extraction kit (Qiagen, #28704) following manufacturer’s instructions. Purified 3′UTRs were ligated with the pmirGLO dual-luciferase vector (Promega, #E1330) via SacI and SalI restriction sites. Resultant plasmids were sequenced using 0.4 μM pmirGLO F/R custom sequencing primers (Supplementary Table S1).
2.9 MicroRNA 3′UTR binding site mutagenesismiR-92b-3p binding sites in each 3′UTR were mutated using the QuikChange II XL site-directed mutagenesis kit (Agilent, #200517) following the manufacturer’s instructions, using custom mutagenesis primers (Supplementary Table S1). Mutated plasmids were sequenced as described above.
2.10 Dual luciferase reporter assayNIH/3T3 cells were reverse co-transfected with 100 ng pmirGLO dual luciferase vector (Promega, #E1330) containing appropriate 3′UTRs and 30 nM microRNA mimic in 96-well plates (Invitrogen, miR-92b-3p #4464066, miRNA negative control 1 #4464058) using lipofectamine 2000 (Invitrogen, #11668019) diluted in opti-MEM (Gibco, #31985062). Luciferase activity was measured 48 h later using the Dual-Glo Luciferase Assay System (Promega, #E2920) following the manufacturer’s instructions. Firefly and Renilla luciferase signal were measured using the Promega GloMax-Multi + Detection System. Five technical replicates were performed for each biological replicate. Firefly luciferase values were first normalised to Renilla luciferase, and fold change was calculated relative to a control sample transfected with the dual-luciferase plasmid and no microRNA mimic.
2.11 miR-92b-3p mimic transfectionHEK293 and NKX2-5eGFP/w hESCs were reverse transfected with 30 nM microRNA mimic (Invitrogen, miR-92b-3p #4464066, miRNA negative control 1 #4464058) using lipofectamine 2000 (Invitrogen, #11668019) diluted in opti-MEM (Gibco, #31985062). Samples were incubated for 24 h at 37°C in 5% CO2.
2.12 RNA extraction and RT-qPCRWhere hESC cardiomyocyte differentiation timeline samples were used for microRNA and mRNA RT-qPCR, total RNA was extracted using the mirVana miRNA Isolation kit (Invitrogen, #AM1560) following the manufacturer’s instructions. Alternatively, where only mRNA expression was measured, RNA was isolated using TRIzol Reagent (Invitrogen, #155996026) following a standard protocol. For miR-92b-3p quantification, 10 ng total RNA was used as input with the TaqMan Advanced MiRNA cDNA Synthesis Kit (Applied Biosystems, #A28007) following the manufacturer’s instructions. For our internal control, U6, 10 ng total RNA was used as input for the TaqMan MicroRNA Reverse Transcription Kit (Applied Biosystems, #4366596) following manufacturer’s instructions. To measure miR-92b-3p and U6 expression we used the TaqMan Fast Advanced Master Mix Kit (Applied Biosystems, #4444556) according to manufacturer’s instructions, with 1X TaqMan Advanced miRNA Assay (Applied Biosystems, #A25576, assay ID: 477823_mir) or 1X TaqMan small RNA Assay (Applied Biosystems, #4427975, assay ID: 001973) respectively. For mRNA expression we used the QuantiTect SYBR Green RT-PCR kit (Qiagen, #204243) in the following reaction: 1X QuantiTect SYBR Green RT-PCR master mix, 0.3 μM F/R primers (Supplementary Table S1), 1X RT mix, 40 ng RNA, RNase-free water. Cycling conditions: 50°C 30 min, 95°C 15 min, 40X [95°C 20 s, 57°C 30 s, 72°C 30 s], 68°C 7 min, 4°C hold. Fold change was calculated using 2−ΔΔCt relative to the given control.
2.13 Western blottingHEK293 cells were lysed (20 mM Tris-HCl, 120 mM NaCl, 0.5 mM EDTA, 0.5% NP40 (Thermo Scientific, #J60766-AP), 10% glycerol (Thermo Scientific, #17904), 1X protease cocktail inhibitor (Roche, #4693116001)) and the supernatant was recovered. Proteins were denatured in 1X laemmli buffer. Western blot membranes were incubated with 1:1500 anti-GATA-6 rabbit-mAb DEIE4 (Cellsignal, #5851) or 1:50,000 anti-β-Actin-peroxidase mouse-mAb (Sigma Aldrich, #A3854) in 1% milk. For GATA6 1:10,000 Goat anti-Rabbit IgG HRP (abcam, #ab6271) was used as a secondary antibody in 1% milk.
2.14 Sequence alignmentmiR-92 sequences for human, mouse, zebrafish and Drosophila were obtained from miRBase v22 (Kozomara et al., 2019). Gata6 and Tbx20 3′UTR sequences were obtained from the UCSC genome browser versions hg38 and mm 10. To align sequences, we used Clustal Omega (Sievers and Higgins, 2014).
3 Results3.1 BAs demonstrate distinct microRNA expression patternsTo identify microRNAs that function during development and morphogenesis of mammalian BAs, we generated small-RNA-seq libraries for BA1, BA2, and PBA/OFT tissue from embryonic (E) 10.5 and E11.5 mouse embryos. Both timepoints coincide with mid-gestation and allow us to capture the three separate BA domains prior to their fusion at E11.5-E12.5 (Frazer, 1926). Furthermore, these datasets complement RNA-seq libraries we previously generated from equivalent tissues and timepoints (Losa et al., 2017), and so provide a valuable opportunity to consider expression of both microRNAs and predicted target mRNAs.
BA small-RNA-seq libraries were enriched for 18–25 nt reads (Supplementary Figure S1A), and 73%–86% of the 18–25 nt reads mapped to known microRNAs (Table 1). As shown by principal component analysis (PCA) (Figure 1A), replicate samples clustered closely to one another indicating reproducibility. The sample clustering across the first two principal components coincided with anterior-posterior location and developmental stage respectively. Using Spearman’s rank correlation to determine similarity between datasets, BA1 E11.5 and BA2 E11.5 showed the greatest correlation, followed by PBA/OFT E10.5 and PBA/OFT E11.5 (Supplementary Figure S1B). The PBA/OFT were most distinct in microRNA expression compared to the two anterior BA domains.
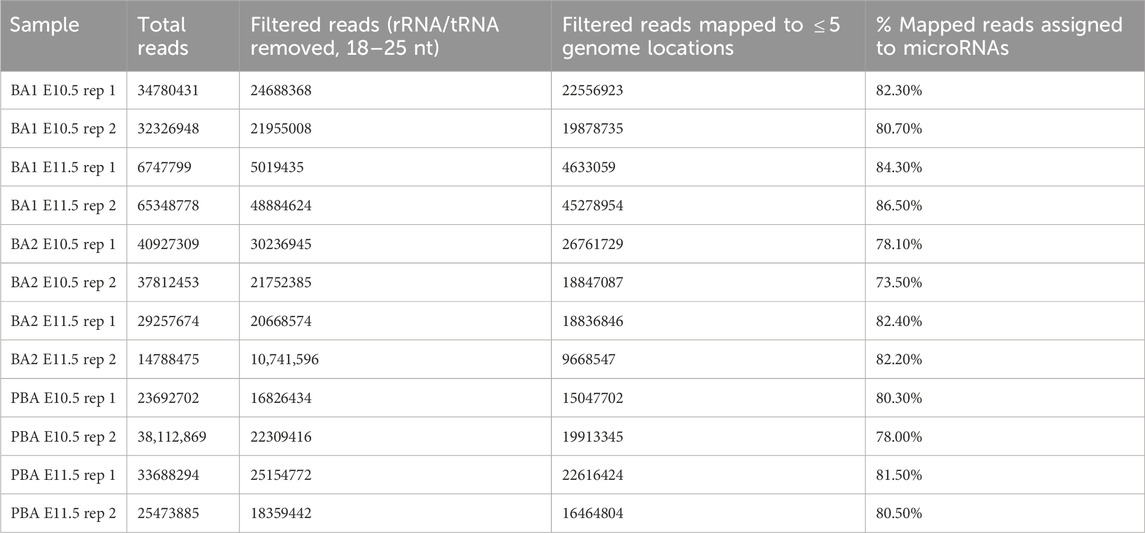
Table 1. Mapping of small-RNA-sequencing libraries.
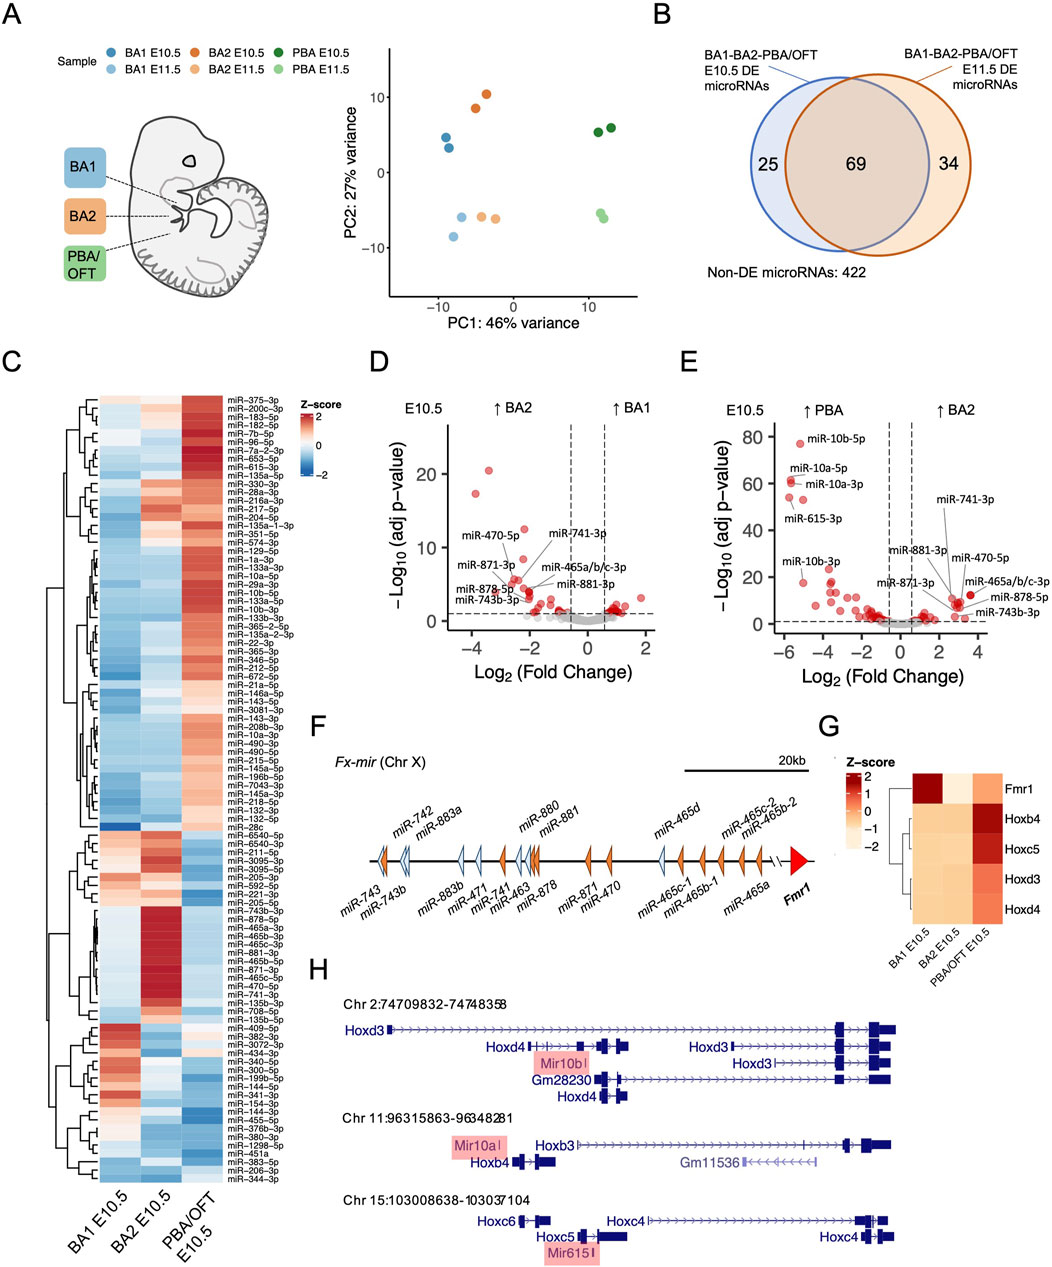
Figure 1. Differential expression of microRNAs across mouse branchial arches. (A) Principal component analysis of branchial arch microRNA-seq libraries, mapped to the mm10 genome and assigned to mature microRNAs. (B) Overlap of differentially expressed microRNAs (≥1.5-fold change and adj-p ≤ 0.05), from BA pairwise comparisons at E10.5 and E11.5. (C) Z-score normalised expression of differentially expressed microRNAs from E10.5 BA pairwise comparisons. (D, E) Pairwise comparisons between E10.5 BA1 v BA2 and E10.5 BA2 v PBA/OFT. Fx-mir and Hox cluster microRNAs are labelled. Dotted lines correspond to 1.5-fold change and adjusted p-value ≤0.05. (F) Fx-mir cluster schematic. MicroRNAs more highly expressed in BA2 are shaded orange and remaining microRNAs are shaded blue. (G) Z-score of overlapping or nearby protein-coding genes from BA RNA-seq (25). (H) Loci of microRNAs more highly expressed in the PBA/OFT overlapping Hox cluster gene members.
Using miRDeep, and a set of post hoc filters for high confidence microRNA annotations, we identified 28 putative novel pre-microRNAs (Supplementary Table S2). The discovery of novel microRNAs is perhaps unexpected in such a well-studied model organism. However, it is well-known that many microRNAs show very specific special and temporal expression patterns (Xu et al., 2024), and therefore under-studied tissues and developmental time points continue to reveal novel microRNA loci. All these predicted loci pass accepted strict criteria, including for submission to the miRBase database (see methods), and as with all microRNAs, further datasets and studies will help to clarify these annotations. Two of the novel microRNAs share seed sequences with mmu-miR-702 and mmu-miR-1839.
After applying an expression cut-off (see methods), we found a total of 550 microRNAs were expressed across the BAs. We explored differential expression in both a spatial and temporal manner. To identify domain-specific microRNAs, we performed BA pairwise comparisons across E10.5 and E11.5 samples. We defined differentially expressed microRNAs as those with ≥1.5-fold change and adjusted p-value≤0.05. In at least one pairwise BA comparison for a given timepoint, 94 microRNAs were differentially expressed at E10.5, and 103 microRNAs were differentially expressed at E11.5. There was considerable overlap between the sets of differentially expressed microRNAs at E10.5 and at E11.5 (Figure 1B), showing that regional microRNA expression is largely maintained across these developmental timepoints. Additionally, at both E10.5 and E11.5, we saw increased microRNA expression progressively across the anterior-posterior axis, whereby most differentially expressed microRNAs demonstrated ≥1.5-fold expression in the PBA/OFT compared to BA1 and BA2 (Supplementary Figure S1C, D).
By considering the expression of microRNAs and their validated targets we can infer their regulatory outcome. For example, 11 mature microRNAs were significantly more highly expressed in BA2 compared to both BA1 and PBA/OFT at E10.5 (Figure 1C). These include miR-743b-3p, miR-741-3p, miR-878-5p, miR-881-3p, miR-871-3p, miR-470-5p, miR-465a/b/c-3p, and miR-465b/c-5p (Figures 1D, E). These microRNAs are transcribed from a large microRNA cluster, Fx-mir, spanning ∼62 kb on Chr X (Figure 1F). Members of this cluster have been described to regulate the neighbouring gene Fmr1 (Ramaiah et al., 2019; Wang et al., 2020), however, each respective study draws contradictory conclusions with regards to whether these microRNAs repress or promote expression of Fmr1. Expression profiles from our BA RNA-seq show that Fmr1 was most lowly expressed in BA2 (Figure 1G), suggesting Fx-mir microRNAs may have a repressive role on Fmr1 in BA2.
The PBA/OFT demonstrated the most distinct microRNA expression across the BAs, at both E10.5 and E11.5 (Supplementary Figure S1C, D). Some of the greatest differentially expressed microRNAs (Figure 1E; Supplementary Figure S1E) are located within the Hox clusters; miR-10b overlaps with both Hoxd3 and Hoxd4, miR-10a is located upstream of Hoxb4, and miR-615 is found within Hoxc5 (Figure 1H). These Hox genes are also more highly expressed in the PBA/OFT E10.5 (Figure 1G), coinciding with spatial collinear Hox gene expression in distinct streams of cranial NC cells that populate the BA’s (Frisdal and Trainor, 2014). Therefore, Hox cluster microRNAs in the PBA/OFT mirror expression of their overlapping or nearby protein-coding genes.
In summary, we have identified differentially expressed microRNAs across the BAs, and BA-specific expression patterns are largely maintained between E10.5 and E11.5. As E10.5 samples demonstrated more defined PCA clustering (Figure 1A) and had a greater number of differentially expressed microRNAs (Supplementary Figure S1C, D), we focused on this timepoint for the remainder of our study.
3.2 miR-92b-3p is a candidate regulator of cardiac developmental genesThe microRNA biogenesis pathway has previously been implicated in PBA artery remodelling (Nie et al., 2011) and OFT morphogenesis (Saxena and Tabin, 2010). We combined expression data from both microRNA-seq and RNA-seq datasets to identify individual microRNA mediated regulation in this domain. The approach is shown in Figure 2A. To begin, we generated a comprehensive list of predicted interactions between BA microRNAs and BA protein-coding genes (see methods). In parallel, we curated a subset of protein-coding genes specifically implicated in PBA/OFT development. We identified this subset by extracting genes that were more highly expressed in the PBA/OFT, relative to BA1 and BA2, performing GO analysis and selecting genes annotated under the top GO terms. Many of these terms were related to muscle and cardiac development, consistent with the contribution of this area to the anterior pole of the heart (Figure 2B). We obtained a list of 315 genes associated with developmental processes specific to the PBA/OFT. To identify microRNAs most significantly enriched for predicted interactions with these 315 genes, we performed a hypergeometric p-value test. For each microRNA, this test considers its predicted interactions with all BA genes and its predicted interactions with the 315 genes specific the PBA/OFT. In return, we determine the microRNAs that interact with this set of genes, compared to all BA genes as background, more than would be expected by chance.
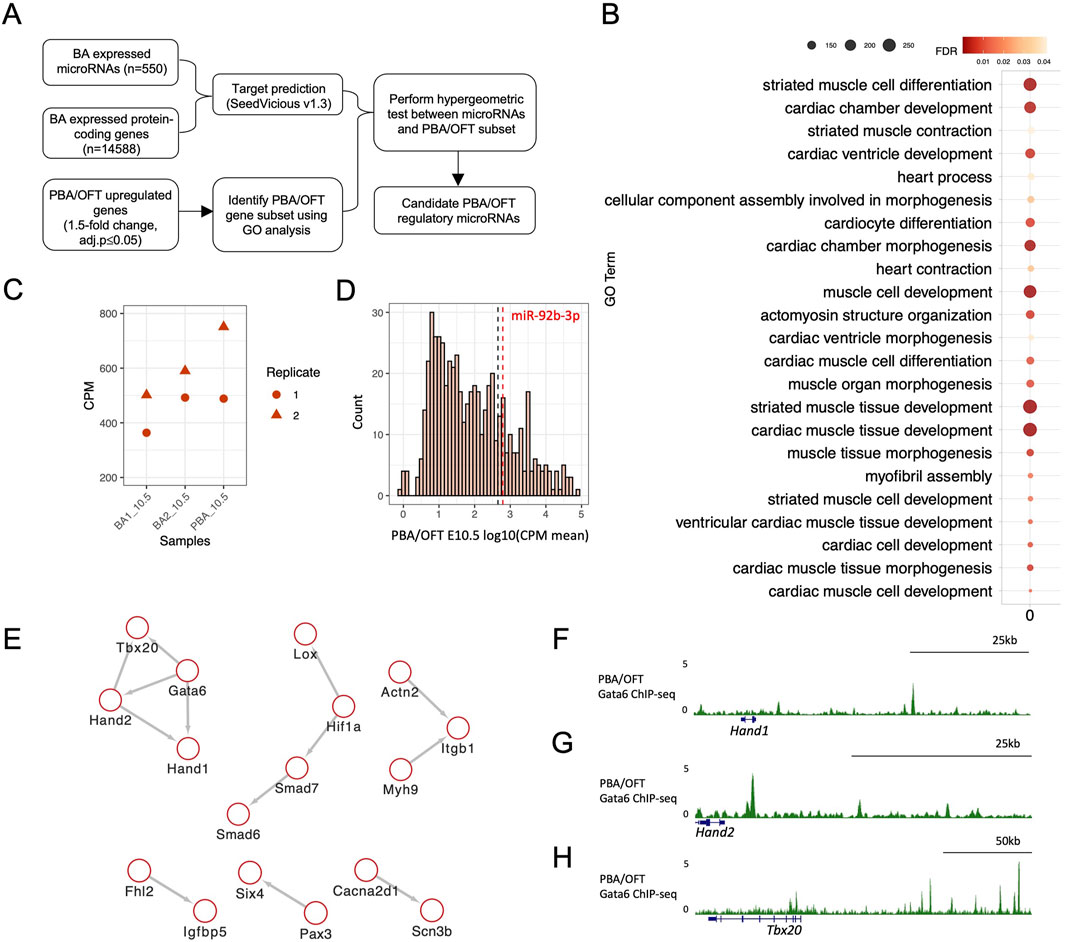
Figure 2. Identifying candidate microRNAs as regulators of PBA/OFT differentiation genes. (A) Pipeline for identifying candidate microRNA regulators of PBA/OFT differentiation. (B) GO analysis performed using PANTHER (Mi et al., 2018). Genes with ≥1.5-fold-change (adj-p ≤ 0.05) in the PBA/OFT, compared to both BA1 and BA2, from total RNA-seq were used as input, with all differentially expressed genes from BA pairwise comparisons used as background genes (fold-change ≥1.5, adj-p ≤ 0.05). Total RNA-seq was re-analysed from previous publication (25). (C) CPM of miR-92b-3p across BA1, BA2 and PBA/OFT at E10.5. (D) Log10(mean CPM) expression of all BA microRNAs in PBA/OFT E10.5. Black dashed line marks the 75th percentile (2.66), red dashed line marks miR-92b-3p (log10 (meanCPM) = 2.79). (E) Protein-protein interaction network of predicted miR-92b-3p targets in the PBA/OFT gene subset, using the STRING database with a 0.6 confidence interaction score (Szklarczyk et al., 2021). (F, G, H) PBA/OFT E11.5 Gata6 ChIP-seq (mm 9) around predicted downstream targets of GATA6 (Losa et al., 2017).
The top ranked microRNA by hypergeometric p-value was miR-92b-3p (p-value = 0.0029). This microRNA was 1.7-fold enriched for predicted interactions with the PBA/OFT list of genes compared to interactions with all BA expressed mRNAs. On average, miR-92b-3p was most highly expressed in the PBA/OFT (Figure 2C) and expressed above the 75th percentile of all PBA/OFT microRNAs (Figure 2D). Looking at its predicted interactions, miR-92b-3p was predicted to bind to 30 of the 315 PBA/OFT genes (Supplementary Table S3).
MicroRNAs are understood to stabilise GRNs through broad regulation of multiple targets (Liufu et al., 2017). Therefore, we were interested in identifying interactions between miR-92b-3p predicted targets. To do so we used the STRING database, which returned evidence for multiple functional interaction networks (Figure 2E). One of these protein-protein interaction clusters contained four developmental cardiac TFs, GATA6, TBX20, HAND1 and HAND2, which have previously been shown to have correlated expression (Sharma et al., 2020). In human induced pluripotent stem cells (hiPSCs) undergoing cardiomyocyte differentiation, HAND1, HAND2 and TBX20 are downregulated following GATA6 loss of function (Sharma et al., 2020). This may be a result of direct regulation, as GATA6 binds in the vicinity (100 kb upstream or downstream) of Hand1, Hand2, and Tbx20 in the PBA/OFT (Losa et al., 2017) (Figures 2F–H).
Taken together, we generated in silico microRNA-target predictions using time-matched BA RNA-seq expression datasets. We identified miR-92b-3p as enriched for predicted binding sites for a network of cardiac transcription factors. As one of these transcription factors, Hand2, has previously been validated as a target of miR-92b-3p (Yu et al., 2019), we explored the possibility that miR-92-3p may regulate the other predicted targets Gata6, Tbx20, and Hand1 to broadly modulate a cardiac GRN.
3.3 miR-92b-3p interacts with Gata6 and Tbx20 3′UTRsTo assess whether miR-92b-3p can interact with its predicted target sites in Gata6, Tbx20 and Hand1 3′UTRs, we used dual-luciferase reporter assays. Whilst we note these assays may not reflect physiological binding, our aim for this experiment was determine if binding can occur at the target sites and if this brings about reduced reporter expression. Portions of each 3′UTR containing the predicted binding sites were cloned into the Promega pmirGLO dual-luciferase plasmid (Figure 3A). Following co-transfection of miR-92b-3p mimic and Gata6 and Tbx20 3′UTR reporters, we saw a significant reduction in luciferase signal, approximately 0.5-fold, compared to the control mimic (Figures 3B, C). In contrast, when miR-92b-3p was co-transfected with the Hand1 3′UTR reporter, a smaller reduction in reporter signal was seen compared to the control mimic (Figure 3D). These results are consistent with the predicted hybridisation energies between miR-92b-3p and the three putative binding sites (Figures 3E–G), whereby Hand1 has the weakest interaction predicted at −7.2 kcal/mol, just meeting our −7 kcal/mol threshold cut-off.
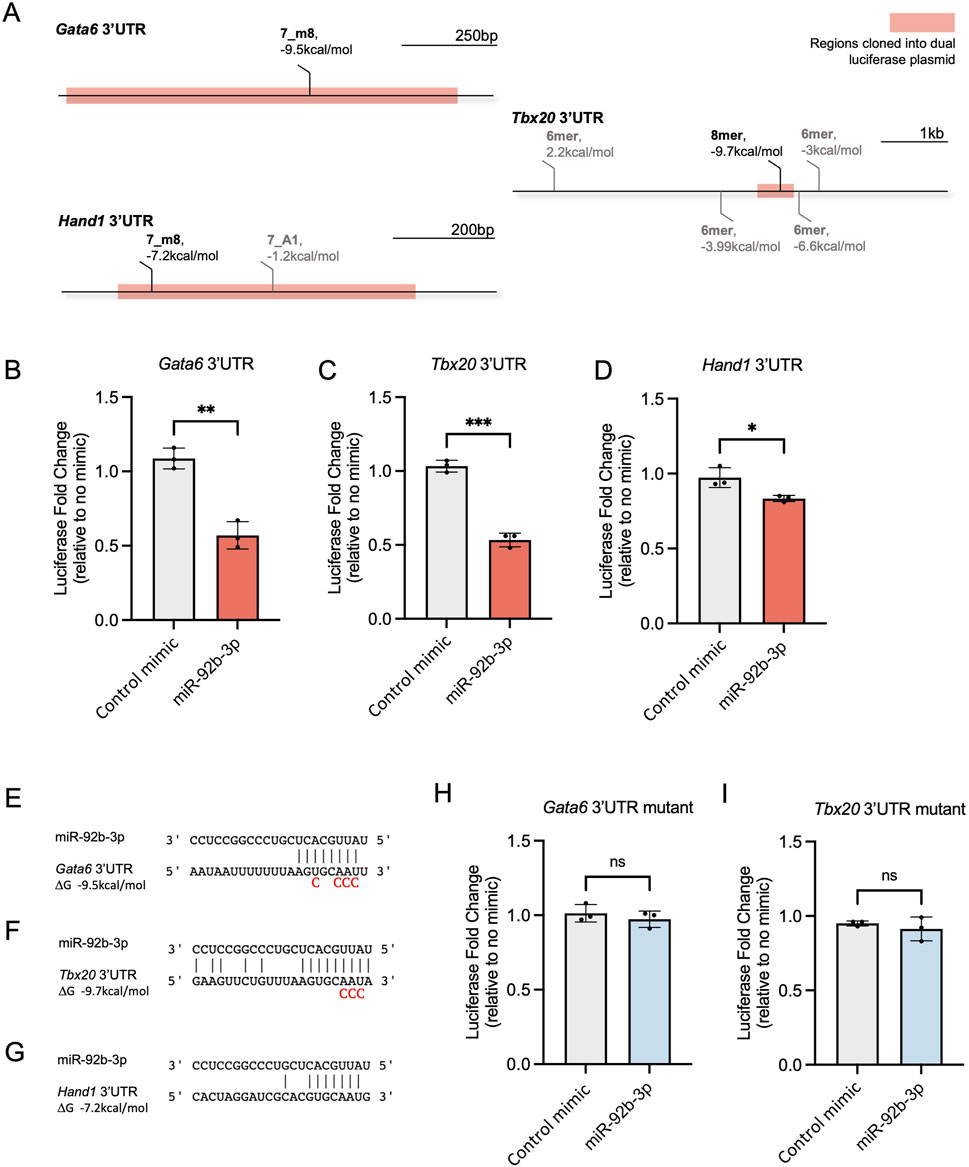
Figure 3. Testing miR-92b-3p binding sites in mouse Gata6, Tbx20, and Hand1 3′UTRs. (A) Seedvicious predicted binding sites between miR-92b-3p and Gata6, Tbx20, and Hand1 3’UTR’s. Highlighted regions were cloned into the pmirGLO dual-luciferase plasmid. Sites that did not meet our threshold of −7 kcal/mol are shown in grey. (B–D) Dual-luciferase reporter assays following co-transfection of microRNA mimics and dual luciferase plasmids containing wild type 3’UTR, in NIH/3T3 cells. Luciferase fold change is plotted relative to samples transfected with only plasmid and no mimic. Control mimic is mirVana negative control #1. Values are presented as the mean ± s.d, n = 3 biological replicates. Significance was calculated using an unpaired t-test: Gata6 p-value = 0.0015, Tbx20 p-value = 0.001, Hand1 p-value = 0.0254. (E–G) Predicted complementary binding and hybridisation energy between miR-92b-3p and Gata6, Tbx20, Hand1 3’UTRs. Mutated nucleotides included underneath wildtype sequences. (H, I) Dual-luciferase reporter assays following co-transfection of dual luciferase plasmids containing mutated 3’UTRs microRNA mimics. Values are presented as mean±s.d., n=3 biological replicates.
Next, we determined whether luciferase reporter knockdown was specifically caused by the physical interaction of miR-92b-3p with the putative binding sites in Gata6 and Tbx20 3′UTRs. Initial binding occurs between positions 2–4 of a microRNA seed site and the target RNA (Chandradoss et al., 2015), therefore, we mutated nucleotides complementary to the seed region of miR-92b-3p (Figures 3E, F). Following co-transfection of mutated 3′UTRs with miR-92b-3p, we did not observe reduced luciferase reporter expression, confirming luciferase reporter knockdown occurs due to interaction of miR-92b-3p with the identified binding sites located in Gata6 and Tbx20 3′UTRs (Figures 3H, I).
In summary, miR-92b-3p interacts with the predicted target sites in Gata6 and Tbx20, leading to significantly reduced reporter expression. Furthermore, the extent of repression was reflective of the predicted hybridisation energy.
3.4 miR-92b-3p binding to Gata6 and Tbx20 is conserved in human3.4.1 Conservation of miR-92b-3p binding sites across mouse and humanCardiac development is a highly conserved process (Jensen et al., 2013), and so we were interested in exploring whether there was conservation of miR-92b-3p binding sites within Gata6 and Tbx20 3′UTRs. miR-92b-3p is conserved between species separated by more than 780 million years of evolution (Hedges et al., 2006). Alignment of pre-miR-92b across mouse, human, zebrafish, and Drosophila showed most conserved nucleotides are in the 3′ mature arm (Figure 4A). Additionally, the validated miR-92b-3p binding sites in mouse Gata6 and Tbx20 3′UTRs are in regions of high sequence conservation (Kent et al., 2002) (Figures 4B, C, Supplementary Figure S2A, B). Consistent with these observations, in silico target prediction between human miR-92b-3p and GATA6 and TBX20 3′UTRs identified homologous binding sites to those we validated by dual luciferase reporter assay, with identical seed complementarity and similar hybridisation energies (Supplementary Figure S2C, D). Therefore, we wanted to determine whether miR-92b-3p can regulate GATA6 and TBX20 in a similar repressive manner to that shown from our reporter assays, specifically in a human cardiac cell type.
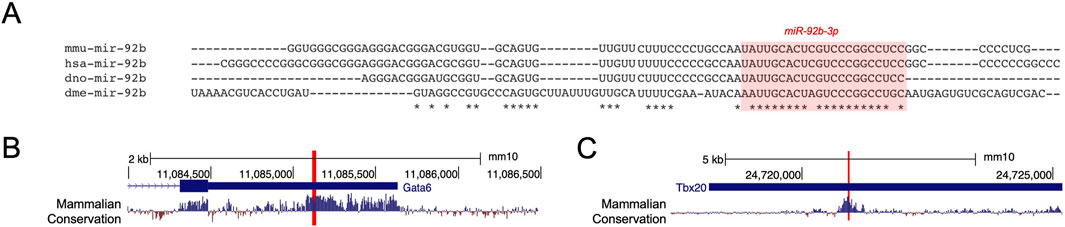
Figure 4. Conservation of miR-92b-3p targeting of GATA6 and TBX20. (A) Alignment of miR-92b (3p highlighted) in M. musculus, H. sapiens, D. rerio, and D. melanogaster. (B, C) PhyloP placental mammalian basewise conservation in Gata6 and Tbx20 3’UTRs. miR-92b-3p binding sites are highlighted in each 3’UTR.
3.4.2 miR-92b-3p knocks down GATA6 and TBX20The PBA/OFT transcriptome is enriched for transcripts linked to cardiac muscle development and differentiation (Figure 2B). To test whether miR-92b-3p could regulate GATA6 and TBX20 in a cardiac cell type we employed a human cardiac differentiation system (Giacomelli et al., 2020). Firstly, we determined the expression dynamics of GATA6, TBX20, and miR-92b-3p within our model. We also included HAND1, to see how its expression pattern related to the other two transcription factors of interest. All 3 TFs were initially upregulated at the onset of differentiation, however, from day 3 onwards they displayed variable expression dynamics (Figures 5A–C). GATA6 and TBX20 expression increased between day 5 to day 10, whilst HAND1 expression decreased. In contrast, we found miR-92b-3p remained generally stable throughout cardiac differentiation with a slight decrease in expression by day 10 (Figure 5D). We also measured miR-92b-3p in undifferentiated hESCs and found it to be expressed at similar levels as day 1 (data not shown), meaning its expression was not induced by differentiation. This is comparable to microarray data previously published (Wilson et al., 2010). Therefore, whilst not expressed in a cardiac-specific manner, miR-92b-3p is expressed at the same cardiac differentiation stages as GATA6 and TBX20 and could therefore function as a regulatory factor in a cardiac cell type.
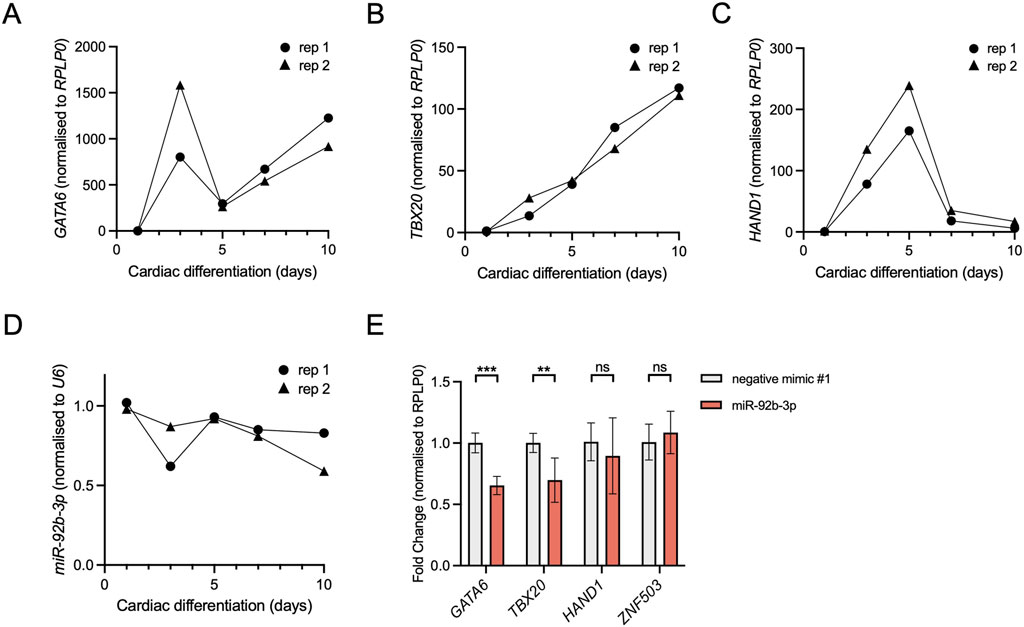
Figure 5. Knockdown of Gata6 and Tbx20 following miR-92b-3p transfection in a human cardiac cell type. (A–C) RT-qPCR of GATA6, TBX20 and HAND1 expression, normalised to RPLP0, during days 1–10 of hESC cardiomyocyte differentiation, n = 2 biological replicates. (D) miR-92b-3p expression, normalised to snRNA U6, during days 1–10 of a hESC cardiomyocyte differentiation, n = 2 biological replicates. (E) RT-qPCR of GATA6, TBX20, HAND1, and ZNF503 (negative control), following 24 h transfection with miR-92b-3p mimic. hESCs were collected on day 7. Expression was normalised to RPLP0 and then used to calculate fold change relative to the control mimic. Values are presented as the mean ± s.d., n = 6 biological replicates. Statistical significance was calculated performing multiple unpaired t-tests, GATA6 adjusted p-value = 8.4 × 10⁻⁵, TBX20 adjusted p-value = 4.6 × 10⁻³.
To test whether miR-92b-3p can regulate endogenous GATA6 and TBX20, we transfected differentiating cardiomyocyte cells with microRNA mimics and measured gene expression 24 h later. Following miR-92b-3p mimic transfection, GATA6 and TBX20 were both downregulated compared to the control mimic (Figure 5E), suggesting miR-92b-3p may downregulate their expression in a cardiac cell type. In contrast to GATA6 and TBX20, we found no significant knockdown of HAND1, akin to results shown in Figure 3D, suggesting there is no functional effect of this miR-92b-3p predicted binding site. Additionally, a negative control gene ZNF503 (with no predicted miR-92b-3p binding sites in its 3′UTR) did not display significant knockdown between conditions, demonstrating that miR-92b-3p transfection did not affect global transcription or translational machinery.
As GATA6 loss of function has previously been shown to downregulate TBX20 in a cardiac setting (Sharma et al., 2020), the TBX20 knockdown we observe could be an indirect effect, rather than a direct effect, of miR-92b-3p binding. To test whether miR-92b-3p reduces TBX20 expression directly, rather than indirectly via GATA6 moderation, we performed microRNA transfection in HEK293 cells. This human cell line showed no evidence of GATA6-mediated TBX20 regulation, as demonstrated by 1000-fold GATA6 overexpression and no measurable changes to TBX20 (Supplementary Figure S3A). We therefore transfected miR-92b-3p into HEK293 cells and measured endogenous GATA6 and TBX20 (Supplementary Figure S3B). Both GATA6 and TBX20 were significantly knocked down following miR-92b-3p transfection. Furthermore, we found reduced GATA6 expression, showing that miR-92b-3p repression extended to protein abundance (Supplementary Figure S3C). We did not see any significant difference in our negative control, ACTB, for both mRNA and protein, showing that overexpression of miR-92b-3p is unlikely to disrupt global transcription and translation.
To summarise, we have shown evidence of miR-92b-3p mediated repression of GATA6 and TBX20 in two human cell lines; one that provided a cardiac cell context, and one that provided a system for which GATA6 and TBX20 expression were independent of one another. We understand that there are limits to interpreting results from overexpression of microRNA mimics. Due to the excess in which microRNA mimics are applied to cells, they do not represent physiological microRNA expression levels. However, our work has concluded that miR-92b-3p can bind to both Gata6 and Tbx20 via the 3′UTR binding sites highlighted in this study. These binding sites are conserved between mouse and human, and downregulation of endogenous human GATA6 and TBX20 were akin to results shown by dual luciferase reporter assays. If miR-92b-3p-mediated regulation occurs at physiological levels, this would place miR-92b-3p within a cardiac GRN containing Gata6, Tbx20, and Hand2 (Yu et al., 2019).
4 DiscussionIn this study we present novel small-RNA-seq datasets characterising microRNA expression across developing mammalian BAs as they undergo tissue specification and morphological changes. These libraries complement our previously published work on RNA-seq and ChIP-seq datasets (Amin et al., 2015; Donaldson et al., 2012; Losa et al., 2017), expanding our understanding of BA developmental biology into the microRNA field. As these small-RNA-seq datasets provide microRNA expression across all BA domains, these additionally build upon microRNA microarray data generated from isolated NC cells in mouse BA1 (Sheehy et al., 2010). Surprisingly, none of the NC-upregulated microRNAs reported by Sheehy et al. (2010) demonstrated BA1-specific expression in our datasets, suggesting alternative groups of microRNAs are important for BA identity compared to distinct cell populations within the BAs.
We have characterised expression of 550 mature microRNAs in the BAs, with the most distinct domain being the PBA/OFT with regards to microRNA upregulation. Additionally, we identified miR-92b-3p as a candidate regulator of cardiovascular development in the PBA/OFT. We validated its interaction with Gata6 and Tbx20, two central cardiac TFs (Lepore et al., 2006; Losa et al., 2017; Sharma et al., 2020; Takeuchi et al., 2005). Previously, knockout of the microRNA biogenesis factor Dicer led to abnormal OFT development, with progenitor cells failing to differentiate into smooth muscle cells (SMC) (Sheehy et al., 2010). Incidentally, Gata6 is sufficient to promote SMC differentiation (Losa et al., 2017), highlighting one of the many microRNA-target interactions that may support normal OFT development. Cardiac development is also understood to be sensitive to gene or protein dosage, echoed by the incidence of human congenital cardiac malformations (Hoffman et al., 2004). Therefore, it is understandable that cardiovascular development is in part controlled by microRNA-directed regulation, and that microRNA dysregulation can therefore have an impact on disease (Goren et al., 2012; Hu et al., 2017; Ventura et al., 2008; Zhao et al., 2007).
TFs have been described as microRNA target hubs, with microRNAs essentially “regulating the regulators” (Martinez and Walhout, 2009). Previously the cardiac TF Hand2 was identified as a target of miR-92b-3p (Yu et al., 2019), consistent with our in silico target predictions. Both Yu et al (2019) and Hu et al. (2017) showed that Ang-II induced cardiomyocyte hypertrophy caused an increase in miR-92b-3p expression in neonatal mouse ventricular cells. Furthermore, overexpression of miR-92b-3p prevented the hypertrophic phenotype developing following Ang-II treatment, through targeting Hand2 (Yu et al., 2019). Another cardiac TF, Mef2d, is targeted by miR-92b-3p (Chen et al., 2012; Hu et al., 2017). While we identified Mef2d in our predicted targets of miR-92b-3p, Mef2d was not annotated under any of the GO terms used to identify our PBA/OFT subset genes and therefore not included in our network.
The understanding of microRNA regulation within GRNs has advanced following the application of computational and mathematical modelling approaches (Cora’ et al., 2017; Lai et al., 2016). Different GRN motifs elicit different outputs (Lai et al., 2016), and it is therefore important to consider where a microRNA fits into a GRN to infer its functional role. GATA6, TBX20 and HAND2 are all cardiac progenitor markers and have important roles in activating cardiovascular cell fates (Lepore et al., 2006; Losa et al., 2017; Sharma et al., 2020; Takeuchi et al., 2005; Tsuchihashi et al., 2011). Furthermore, these 3 TFs demonstrate overlapping expression within the PBA/OFT, as shown by in situ hybridisation and fluorescence microscopy (Cai et al., 2011; Lepore et al., 2006; Losa et al., 2017; Vincentz et al., 2020). GATA6 indirectly promotes HAND2 and directly promotes TBX20 expression during hiPSC cardiomyocyte differentiation, through functioning as a pioneer cardiac factor (Sharma et al., 2020). Additionally, HAND2 binds to cis-regulatory modules associated with Gata6 and Tbx20 in embryonic hearts (Laurent et al., 2017). Taken together, this places miR-92b-3p in multiple microRNA-mediated coherent feedforward loops (Figure 6). Of note, the miR-92b-3p target sites in Gata6, Tbx20 and Hand2 3′UTRs are all located in highly conserved regions, determined from the UCSC genome browser Multiz alignments of 60 vertebrates, suggesting a conserved regulatory network. MicroRNA-mediated coherent feedforward networks can function to minimise leaky transcripts or prevent spatial co-expression of the microRNA and its targets (Lai et al., 2016; Shalgi et al., 2009). From our microRNA-seq and RNA-seq datasets we know that miR-92b-3p, Gata6 and Tbx20 are all more highly expressed in the PBA/OFT domain. However, it would be interesting to determine at a greater resolution, for example, single-cell, whether miR-92b-3p is in fact inversely correlated with Gata6, Tbx20 and Hand2, as may be expected if functioning to prevent spatial co-expression or minimise leaky transcripts (Lai et al., 2016).
Alternatively, microRNAs can also work as master regulators when embedded within coherent feedforward motifs (Cora’ et al., 2017). If the microRNA and target genes are expressed in the same cell, then the microRNA concentration is a controlling parameter, driven by competition for microRNA-target binding. The microRNA in turn can regulate and maintain the ratio of its targets relative to one another, ensuring stability in target concentration (Cora’ et al., 2017). This is particularly effective when one of the microRNA targets is a TF which regulates the other target (Riba et al., 2014), as we see in our proposed miR-92b-3p network, where GATA6 regulates Tbx20. We have evidence of Gata6 and Tbx20 co-expression in human embryonic and foetal OFT single-cell data (unpublished). Therefore, if miR-92b-3p were also co-expressed in these cells, microRNA-target competition could occur. As a result, miR-92b-3p could act to reinforce this GRN and facilitate PBA/OFT development in a “coordinate regulatory” manner (Liufu et al., 2017). To build on our understanding of miR-92b-3p within this GRN, it would be interesting to determine its upstream regulator.
MicroRNAs often act moderately to fine-tune their target gene expression, with the idea that “weak and broad” regulation is central to how microRNAs stabilise GRNs and contribute to developmental canalization (Alberti and Cochella, 2017; Liufu et al., 2017). However, this moderately repressive role often means there is no substantial phenotypic consequence when individual microRNAs are knocked out, as over 90% of microRNA activity is recognised as “weak” (Chen et al., 2019). There is also redundancy between microRNAs that share the same targets, therefore it is also important to consider how microRNAs may work collectively. miR-92b-3p belongs to a larger seed family of microRNAs containing miR-92a-3p, miR-25-3p, and miR-363-3p. Two of these, miR-92a-3p and miR-25-3p, were ranked in the top five candidates enriched for predicted binding sites in our PBA/OFT gene subset. As these microRNAs share identical seed sequences, there will likely be a high level of redundancy between their targets (Marco et al., 2012; Subasic et al., 2015). miR-92a-3p is located within the miR-17-92 cluster, which has previously been linked to cardiomyocyte proliferation, hypertrophic cardiomyopathy, and aberrant cardiac ageing (Chen et al., 2013; Danielson et al., 2013; Zhang et al., 2012). Furthermore, deletion of this cluster caused ventricular septal defects in mouse models (Ventura et al., 2008). Another family member, miR-25, is expressed in the OFT and ventricular regions during embryonic chick development and is predicted to regulate Tbx20 (Alzein et al., 2021). Evidence for miR-92b-3p regulated cardiac development extends to Drosophila, whereby miR-92b-3p exhibited muscle and cardiac specific expression (Chen et al., 2012). Taken together, we hypothesise that miR-92b-3p and members of its family, through cooperativity and redundancy, perform a central role in regulating the described cardiac GRN (Figure 6) during PBA/OFT development.
Data availability statementThe datasets presented in this study can be found in online repositories. The names of the repository/repositories and accession number(s) can be found in the article/Supplementary Material.
Ethics statementEthical approval was not required for the studies on humans in accordance with the local legislation and institutional requirements because only commercially available established cell lines were used. Ethical approval was not required for the studies on animals in accordance with the local legislation and institutional requirements because only commercially available established cell lines were used.
Author contributionsSG: Conceptualisation, Investigation, Formal analysis, Writing–original draft, Writing–review and editing. ML: Data curation, Writing–review and editing. NB: Conceptualisation, Supervision, Writing–review and editing. SG-J: Conceptualisation, Supervision, Writing–review and editing.
FundingThe author(s) declare that financial support was received for the research, authorship, and/or publication of this article. This work was supported by Wellcome Trust [102171/Z/13/Z].
AcknowledgmentsWe would like to acknowledge the Genomic Core Technology Facility at The University of Manchester for performing the small-RNA sequencing. We would also like to thank Joshua Mallen for advice and technical troubleshooting, Matthew Birket for advice on hESC cardiomyocyte differentiation, and Emma Layton and Svitlana Kurinna for help with microRNA assays.
Conflict of interestThe authors declare that the research was conducted in the absence of any commercial or financial relationships that could be construed as a potential conflict of interest.
Generative AI statementThe author(s) declare that no Generative AI was used in the creation of this manuscript.
Publisher’s noteAll claims expressed in this article are solely those of the authors and do not necessarily represent those of their affiliated organizations, or those of the publisher, the editors and the reviewers. Any product that may be evaluated in this article, or claim that may be made by its manufacturer, is no
留言 (0)