
記住我


The time from the confirmed diagnosis of an invasive BC until the start of treatment is referred to as the delay and includes the time required for organizational and technical processes. BC growth is an approximately continuous process, and to adequately estimate the effect of a delay of surgery, our model was built around a single biological parameter, the volume doubling time (VDT). The VDT depends, e.g., on grade or hormone receptor status (HR). VDT used by large study consortia are estimated via ultrasound, mammography, and reported for population-based mammography screening studies [6,7,8,9]. The association of HR and metastasis is also described by population-based data [10], and HR distributions and BC incidences are publicly available for several populations [11, 12].
The tumor diameter (TD) was furthermore considered as the central prognostic parameter, since the size of the TD at diagnosis describes the duration of the occult growth phase and thus the duration of the risk of distant metastasis. The TD is therefore considered a surrogate parameter which is correlated with metastasis and mortality. Each 5 mm interval of TD, for example, represents a subgroup of BCs with a specific distribution of prognostic factors and corresponding mortality. As the TD increases, the M1 findings increase, more positive lymph nodes are affected, and the proportion of grade G1 and HR + cases decrease. The association between TD and BC mortality can be described by population-based survival data for first single BC [12, 13].
The consequences of delay e.g., numbers of additional deaths are therefore estimated in dependence on HR-Status and delayed weeks based on these known parameters and using available aggregated population-based data. Therefore, power or sample size analysis, randomization, and blinding are not applicable.
Data sources and assumption parametersAll calculations are based on female BC incidence data and distributions of delay from the U.S. (Delay data: study by Wiener et al., Incidence: NCI Cancer Report 2022) [3, 14] and Germany (Delay: report by the German Institute for Quality Assurance and Transparency in Health Care, Incidence: German Centre for Cancer Registry Data, 2019) [11, 15].
Relative survival as the best estimate for BC-specific survival in epidemiology, cumulative incidence of distant metastases (MET), and time distribution of metastasis by TD and HR were derived from the population-based Munich Cancer Registry (MCR) database (initial diagnosis 1988–2019, first single malignancies except in Fig. 1C). The MCR was the official regional cancer registry of Upper Bavaria from 1978 to 2021 and accounted for an area of 2.8 M up to 4.3 M since 2002, and 5.16 M inhabitants since 2007. By documenting all death certificates and actively following up the living, the MCR was able to estimate valid long-term population-based follow-up data on BC, which is rarely found elsewhere. Also, tumor-specific characteristics such as HR and TD were documented over decades. Since the German health care system offers broadly the same access everywhere, the MCR data are assumed to be representative for Germany.
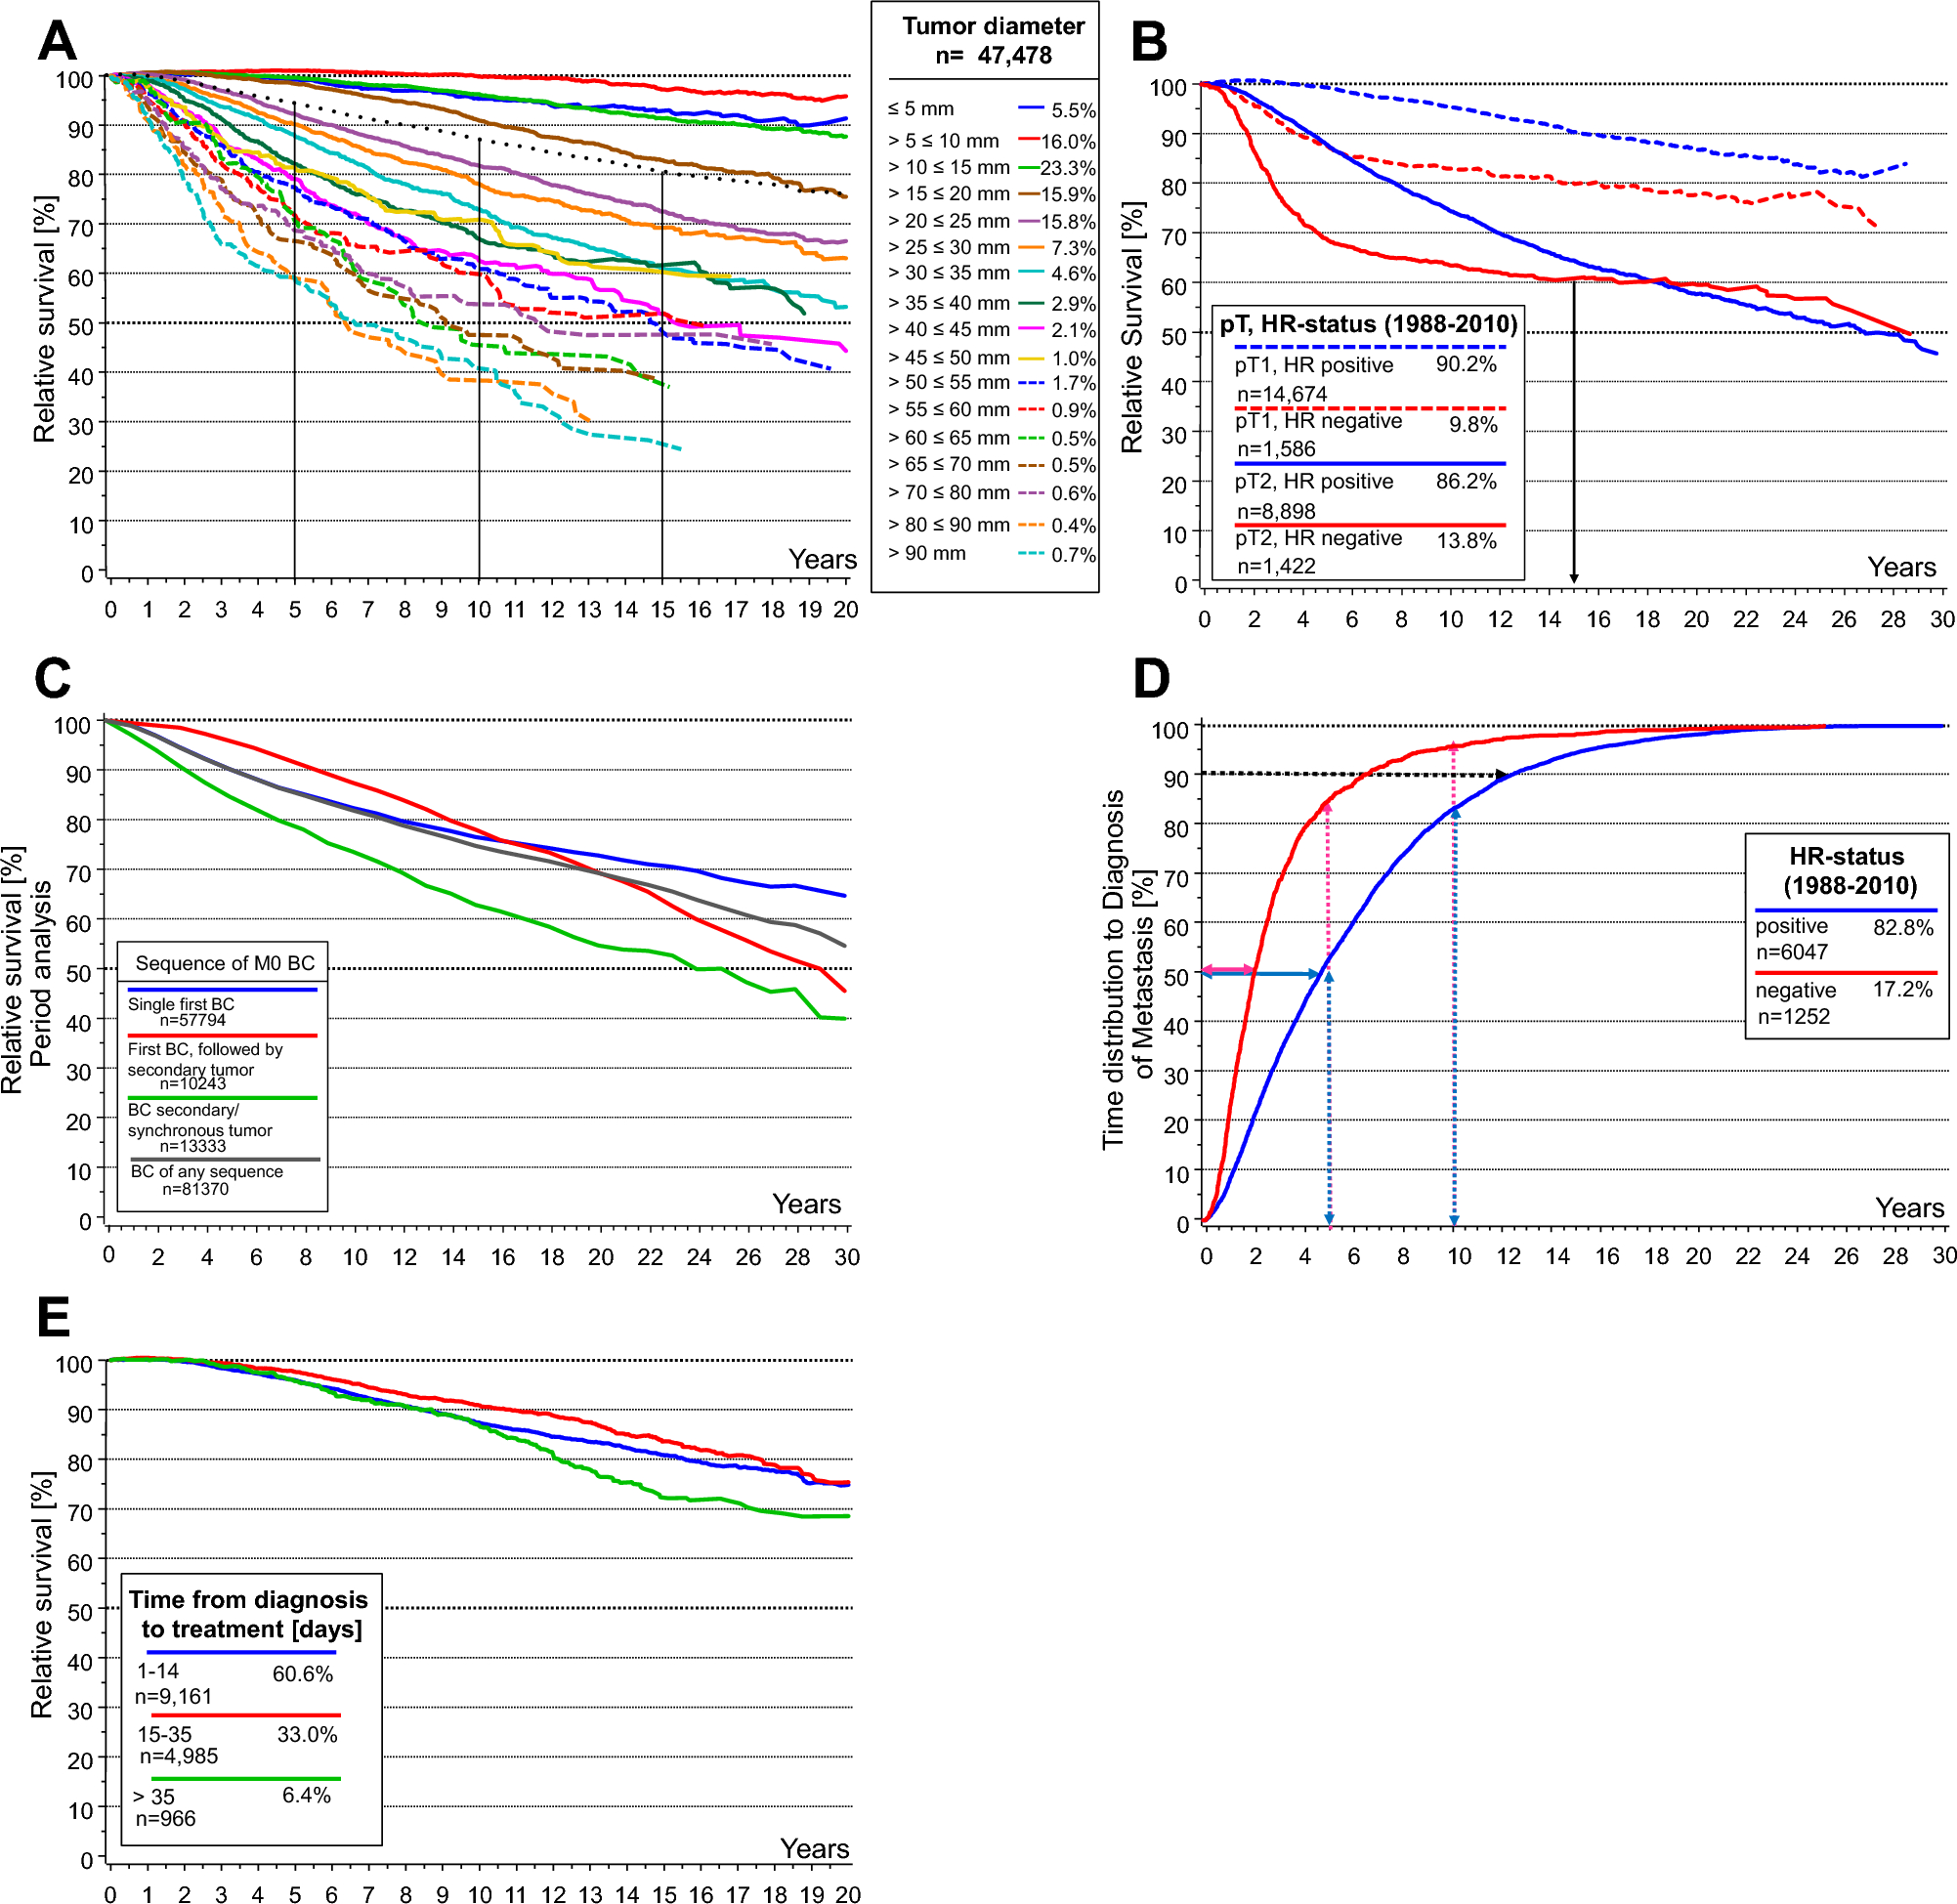
Fig. 1
Long-term breast cancer survival based on data from the MCR, first single tumors only. A: Relative survival stratified by TD. The dotted line shows a relative survival for all M0 BCs of 80.7% at 15 years and 76% at 20 years (1998–2019, n = 47,478). B: Relative survival stratified by HR status (1988–2010, pT1 n = 16,260, pT2 n = 10,320). The faster growth of HR- MET causes different results in the pT1- and pT2-BC subgroups. C: Relative survival according to tumor sequence (Period analysis, BC M0, 1988–2018), only first single BCs adequately illustrate the BC-specific disease course, the other disease courses are impacted by preceding or secondary cancer diseases. D: Time to diagnosis of MET by HR status for first single M0 BC (diagnosed 1988–2010, n = 7,299). Within 25 years, all MET after primary M0 are diagnosed. 50% of MET in HR- are diagnosed within 2.1 years, in HR + within 5 years after initial diagnosis of the primary tumor. MET which are diagnosed soon after initial treatment are in a later stage of development and were initiated long before diagnosis (and treatment) of the primary BC, later diagnosed MET were initiated shortly before and were able to escape destruction by adjuvant systemic treatment. Therefore, twice the median time can be estimated as the median time of growth and development of MET, which are initiated during surgical delay until detection which is 10.8 years in HR + and 4.2 years in HR−. The growth time depends on tumor biology (above all HR status) and not on the size of the primary BC at the time of MET initiating tumor cell spread. Secondary BCs are excluded because MET from a contralateral BC, for example, would prolong the distribution of time to MET. E: Relative Survival of hormone receptor positive and M0 BC in dependence on days delayed (1998–2010, n = 15,112)
Parameters and assumptions for modeling:
1.) Relative survival stratified by TD and HR is derived from MCR data, which includes follow-up data up to 20 years and more (see Fig. 1A, B). The association of 15-year BC-specific mortality (1 minus 15-year relative survival) and TD in M0 BC can be described by a Gompertz function (GF) [12].
$$GF:15 - yrMortality(\% ) = a*e^ \right)} \right)}}$$
Here, a=58.4, describing an asymptote parallel to the x-axis which intersects the y-axis at 58.4; b=4.46, setting the displacement of the graph along the x-axis; and c=0.071 describing the growth rate.
For example, 15-year BC mortality increases by 18.1% with a tumor growth from 12 to 25 mm or by 1.39% per mm of growth with a turning point at 21.1 mm [13]. Increases in 15-year BC mortality between 8.4 and 26.6% follow a nearly linear association with tumor growth (see supplement Figure S1). This function describes for the most part a biological association which is derived from population-based tumor cases with any standard treatment approved during their period of diagnosis.
2.) The TD depends on the growth of the BC, and therefore on VDT for HR+ and HR−, respectively. HR− BCs grow faster than HR+ BCs, approximately by a factor of 2.4 (Fig.1D). The mean VDTs derived from two publications are 170/72 days for HR+ and HR− BCs [6, 7]. Considering the proportions of HR+/HR- (85%/15%) subtypes in the German and U.S. population, an approximated overall weighted mean VDT of 150 days was used for estimation. This VDT value is referred to in other studies as well [16].
Additional stratification by HER2+, Ki67, or neoadjuvant treatment modality was not conducted in this exploratory study. Ki67 was only implemented in widespread diagnostics in 2007. Nevertheless, limiting the modeling on TD and HR status broadly explains prognosis for a large majority of patients.
3.) The distribution of delay (in weeks) as it is available for the U.S. and Germany (see Table 2, Column 2 and 10) was implemented as influencing factor [3, 17]. Unknown frequencies for the first four weeks in the U.S. were split according to data from Germany. The middle of each week represents the duration of delay; 48/90 days were assumed for >6/ >12 weeks to model German and U.S. data.
4.) Female BC incidences for the U.S. and Germany in absolute numbers define the model cohorts [14, 15]. They are split into subgroups according to the distribution of clinical characteristics as primary M category, HR, and TD derived from MCR clinical data. Current data state that 6.2% of BCs are primary M1 and 85% are HR+. Exploratory analysis of SEER data shows similar proportions (5.8% M1 and 84.7% HR+) [11, 12].
5.)The distribution of the time to MET is determined by HR status. Based on MCR data, the 80% percentile intervals PI80(p10, p50, p90) of time to MET in M0 BC are PI80(16.9, 60.4, 141.3) months for HR+ and PI80(9.4, 25.2, 80.8) months for HR-(Fig. 1D) [10]. This implies that 50% of developing METs will be diagnosed within 5.0 or 2.1 years and 50% later than 5.0 or 2.1 years after initial diagnosis in M0/HR+ or M0/HR− BCs, respectively. This means that relevant, potentially preventable METs initiated during delay may be detected on average after at least twice the median MET-free time because growth from initiation to detectability may take about 10.0 / 4.2 years for HR+/HR− BCs.
The observable increase in mortality due to delay is lessened if the surgery is followed by an adjuvant therapy which eradicates a part of the MET initiated during the delay.
Derivation of tumor growthBased on the volume doubling of a spherical tumor with the initial diameter of 19.8 mm after 170/72 days at HR + and HR− the corresponding tumor diameter is calculated for weeks 1 to 8, as well as for 3 and 6 months of further growth (days 4, 11, 18, 25, 32, 39, 46, 53, see Table 1, rows 2 and 5 for HR + /HR− with different VDT of 170/72 days; for details see supplementary Figure S2):
$$TD_ = 19.8\times\,1.26^ \right)}} \,\left( = 19.8\,mm\,and\,d = delay\,time\,in\,days} \right)$$
Table 1 Increase TD and 15-year mortality risk as a function of HR status and delayed surgery in weeks/daysThe cohorts of annual incident BCs (2022 U.S., 2019 Germany) with primary M0 (about 93.8% of the total cohort, because of elimination of 6.2% primary M1, n = 229,502 for the U.S. and n = 56,906 for Germany) are divided first into two theoretical cohorts by HR status, the HR + cohort comprises 85% of M0 and the HR- cohort 15%. These two cohorts are now split further into “delay cohorts” according to the current distribution of U.S. and German delay in weeks up to ≥ 12 weeks and ≥ 7 weeks, respectively (see Table 2, Column 3 and 11). For each of these “delay cohorts,” the same mean TD of 19.8 mm is assumed at the time point of initial diagnosis with an average basal 15-year BC-specific mortality without delay derived from the Gompertz function shown above. The 15-year BC-specific mortality depending on the delay and estimated grown TD is also derived from this function for each “delay cohort.”
Table 2 Increase in TD as a function of HR + /HR- and delayed surgery in weeks and mortality caused by delay in the U.S. and GermanyThe difference in both mortalities reflects the additional delay effect, which is shown in Tab. 1, rows 4 and 7 as relative rate (RR: 15-year mortality after delay divided by the baseline 15-year mortality) and absolute excess deaths after 15 years. The 15-year BC-specific mortality in M0 BC is considered a suitable endpoint, because of the known course of BC disease from initial diagnosis of the primary tumor to the detection of further MET and the survival after MET. The duration of MET growth and the survival time from MET determine the time from which any delay-initiated MET occur or rather can be detected.
To determine the variability of the association between delay and underlying assumptions of VDT and TD, estimations were repeated for three different VDT (150–190, 62–82) and different basal TD, a mean TD of 14 mm as it is found in screening cohorts, and a mean TD of 28 mm found in a pT2-BC cohort (see supplementary Table S4).
This can be considered a deductive approach whereby a verifiable thesis is derived from public data sources.
Time-to-event and other statistical analysesAll time-to-event analyses were completed with data from the MCR breast cancer population (1988–2018). For reference, the demographic data of this cohort are shown in supplementary table S3. Due to legal changes in cancer registry proceedings for Upper Bavaria, MCR high-quality follow-up data are only available until the 2018 patient cohort (censored on March 31, 2019). They were conducted as part of the established routine data preparation until end of 2021 according to public mandate.
Relative survival is calculated from observed survival estimated using the Kaplan–Meier method and the respective expected survival of the German general population using the official age- and sex-matched life tables (Ederer II method). Secondary malignancies, especially contralateral BCs, are excluded from analysis since the METs originating from these cases would falsify the estimates for the primary diagnosis (see Fig. 1C). Time to MET was estimated by cumulative incidence analysis considering competing risks (e.g., death) [18]. In addition, hazard ratios of the delay effect on overall survival are estimated using a multiple Cox proportion hazard model adjusting for age, TD, tumor grade, molecular subgroups, and number of positive lymph nodes (See supplementary Table S5). Survival analyses and Cox regression were performed in SAS V 9.4. For the estimation and delay calculations, the R system version 3.1.3 was used and results were validated in SAS [19]. The R code for the delay calculations can be found in the supplementary materials. For all analyses, a two-sided p-value of 0.05 or less was considered statistically significant. Plots were generated in SAS V 9.4.
留言 (0)