
記住我
Osteoporosis is a systemic skeletal degenerative disease characterized by a reduction in bone mass and strength, disruption in the bone microstructure tissue, and increased bone brittleness, which may ultimately lead to osteoporotic fractures (1). The latest studies suggested that more than 200 million people are suffering from osteoporosis worldwide. The prevalence of osteoporosis in people over 50 is about 30% in women and 15% in men (2, 3). This heavy burden of disease could create a huge financial burden. A global study on osteoporosis shows that the average cost of treatment of osteoporosis was US $5,258,741, which accounts for 20% of the GDP of countries in 2018, placing a huge financial burden on health systems (4). Obesity is defined as the excessive or abnormal accumulation and distribution of body fat that poses a threat to health. Over the past few decades, obesity has emerged as an escalating public health concern worldwide (5). The 2017 Global Nutrition Report disclosed that 2 billion adults globally are overweight or obese (6).
Numerous studies have demonstrated a correlation between obesity and osteoporosis. Some research suggests that obesity may have a protective effect against osteoporosis, while other evidence indicates that obesity and the amount of body fat can be risk factors for decreased bone density and fractures (7). A cross-sectional study has revealed a negative correlation between body fat and bone density, indicating that severe obesity is associated with an elevated risk of osteoporosis (8). Zhao et al. demonstrated a negative relationship between fat mass and bone mass after controlling for body mass (9). Kim KC et al. observed that higher body weight and BMI were associated with greater bone mineral density (BMD), potentially lowering the risk of vertebral fractures. Conversely, larger waist circumference and higher body fat percentages were linked to reduced BMD, which could elevate the risk of vertebral fractures (10). However, observational studies have yielded inconsistent findings, and the precise correlation and underlying causality between obesity and its related traits, such as body fat distribution and BMD, require further investigation to be conclusively established.
Mendelian randomization (MR) analysis, which harnesses genetic variation as an instrumental variable, is a robust approach to establish causality between exposures and outcomes in a clinical research (11). Compared with traditional observational studies, MR is less likely to be confounded by external factors (12). A two-sample MR analysis has demonstrated a positive correlation between body mass index (BMI) and BMD at the lumbar spine and heel, yet no such correlation was observed at the femoral neck and forearm (13). That study was limited by its reliance on BMI as the sole indicator of obesity and by its use of data from a single genome-wide association study (GWAS) database. Another recent MR study revealed that different central obesity indicators have different effects on BMD; hip circumference adjusted for BMI showed a negative correlation with BMD, while the waist-to-hip ratio exhibited a positive correlation (14). However, this study also relied on a single-source GWAS database, and the potential mediating effects between obesity and BMD were not further explored.
In addition, osteoporosis is closely related to many factors and biological processes, such as inflammation, estrogen deficiency, cellular senescence, and oxidative stress (15). Certain proteins, including zinc finger protein 267 (ZNF267), ras homologue family member J, actin-binding LIM protein family member 2, programmed cell death 1, and cell cycle protein-dependent kinase-like 5, have been implicated in the pathogenesis of osteoporosis (16, 17). Obesity, as a modulator of bone health, may interact with bone through the endocrine system, adipokines, and inflammation, representing potential mechanisms for bone–adipose tissue crosstalk (18). However, no multifactorial mediated-effect MR studies have yet explored the direct causal link between obesity and osteoporosis nor have they elucidated the underlying mechanisms. Consequently, we initiated a multifactorial MR study to probe the genetic correlations and potential mediators, such as plasma proteins and blood metabolites, between obesity and its associated traits in relation to osteoporosis. This approach aims to provide clearer insights into the complex interplay between obesity and osteoporosis, complementing existing research in the field.
2 Method2.1 Study designWe utilized publicly available datasets and two-sample MR to investigate the relationship between adiposity indicators, plasma proteome, and blood metabolites with osteoporosis. Our research methodology and the reporting of results were conducted in strict accordance with the Strengthening the Reporting of Observational Studies in Epidemiology Using Mendelian Randomization (The STROBE-MR Statement) (19). A schematic diagram of our study is shown in Figure 1.
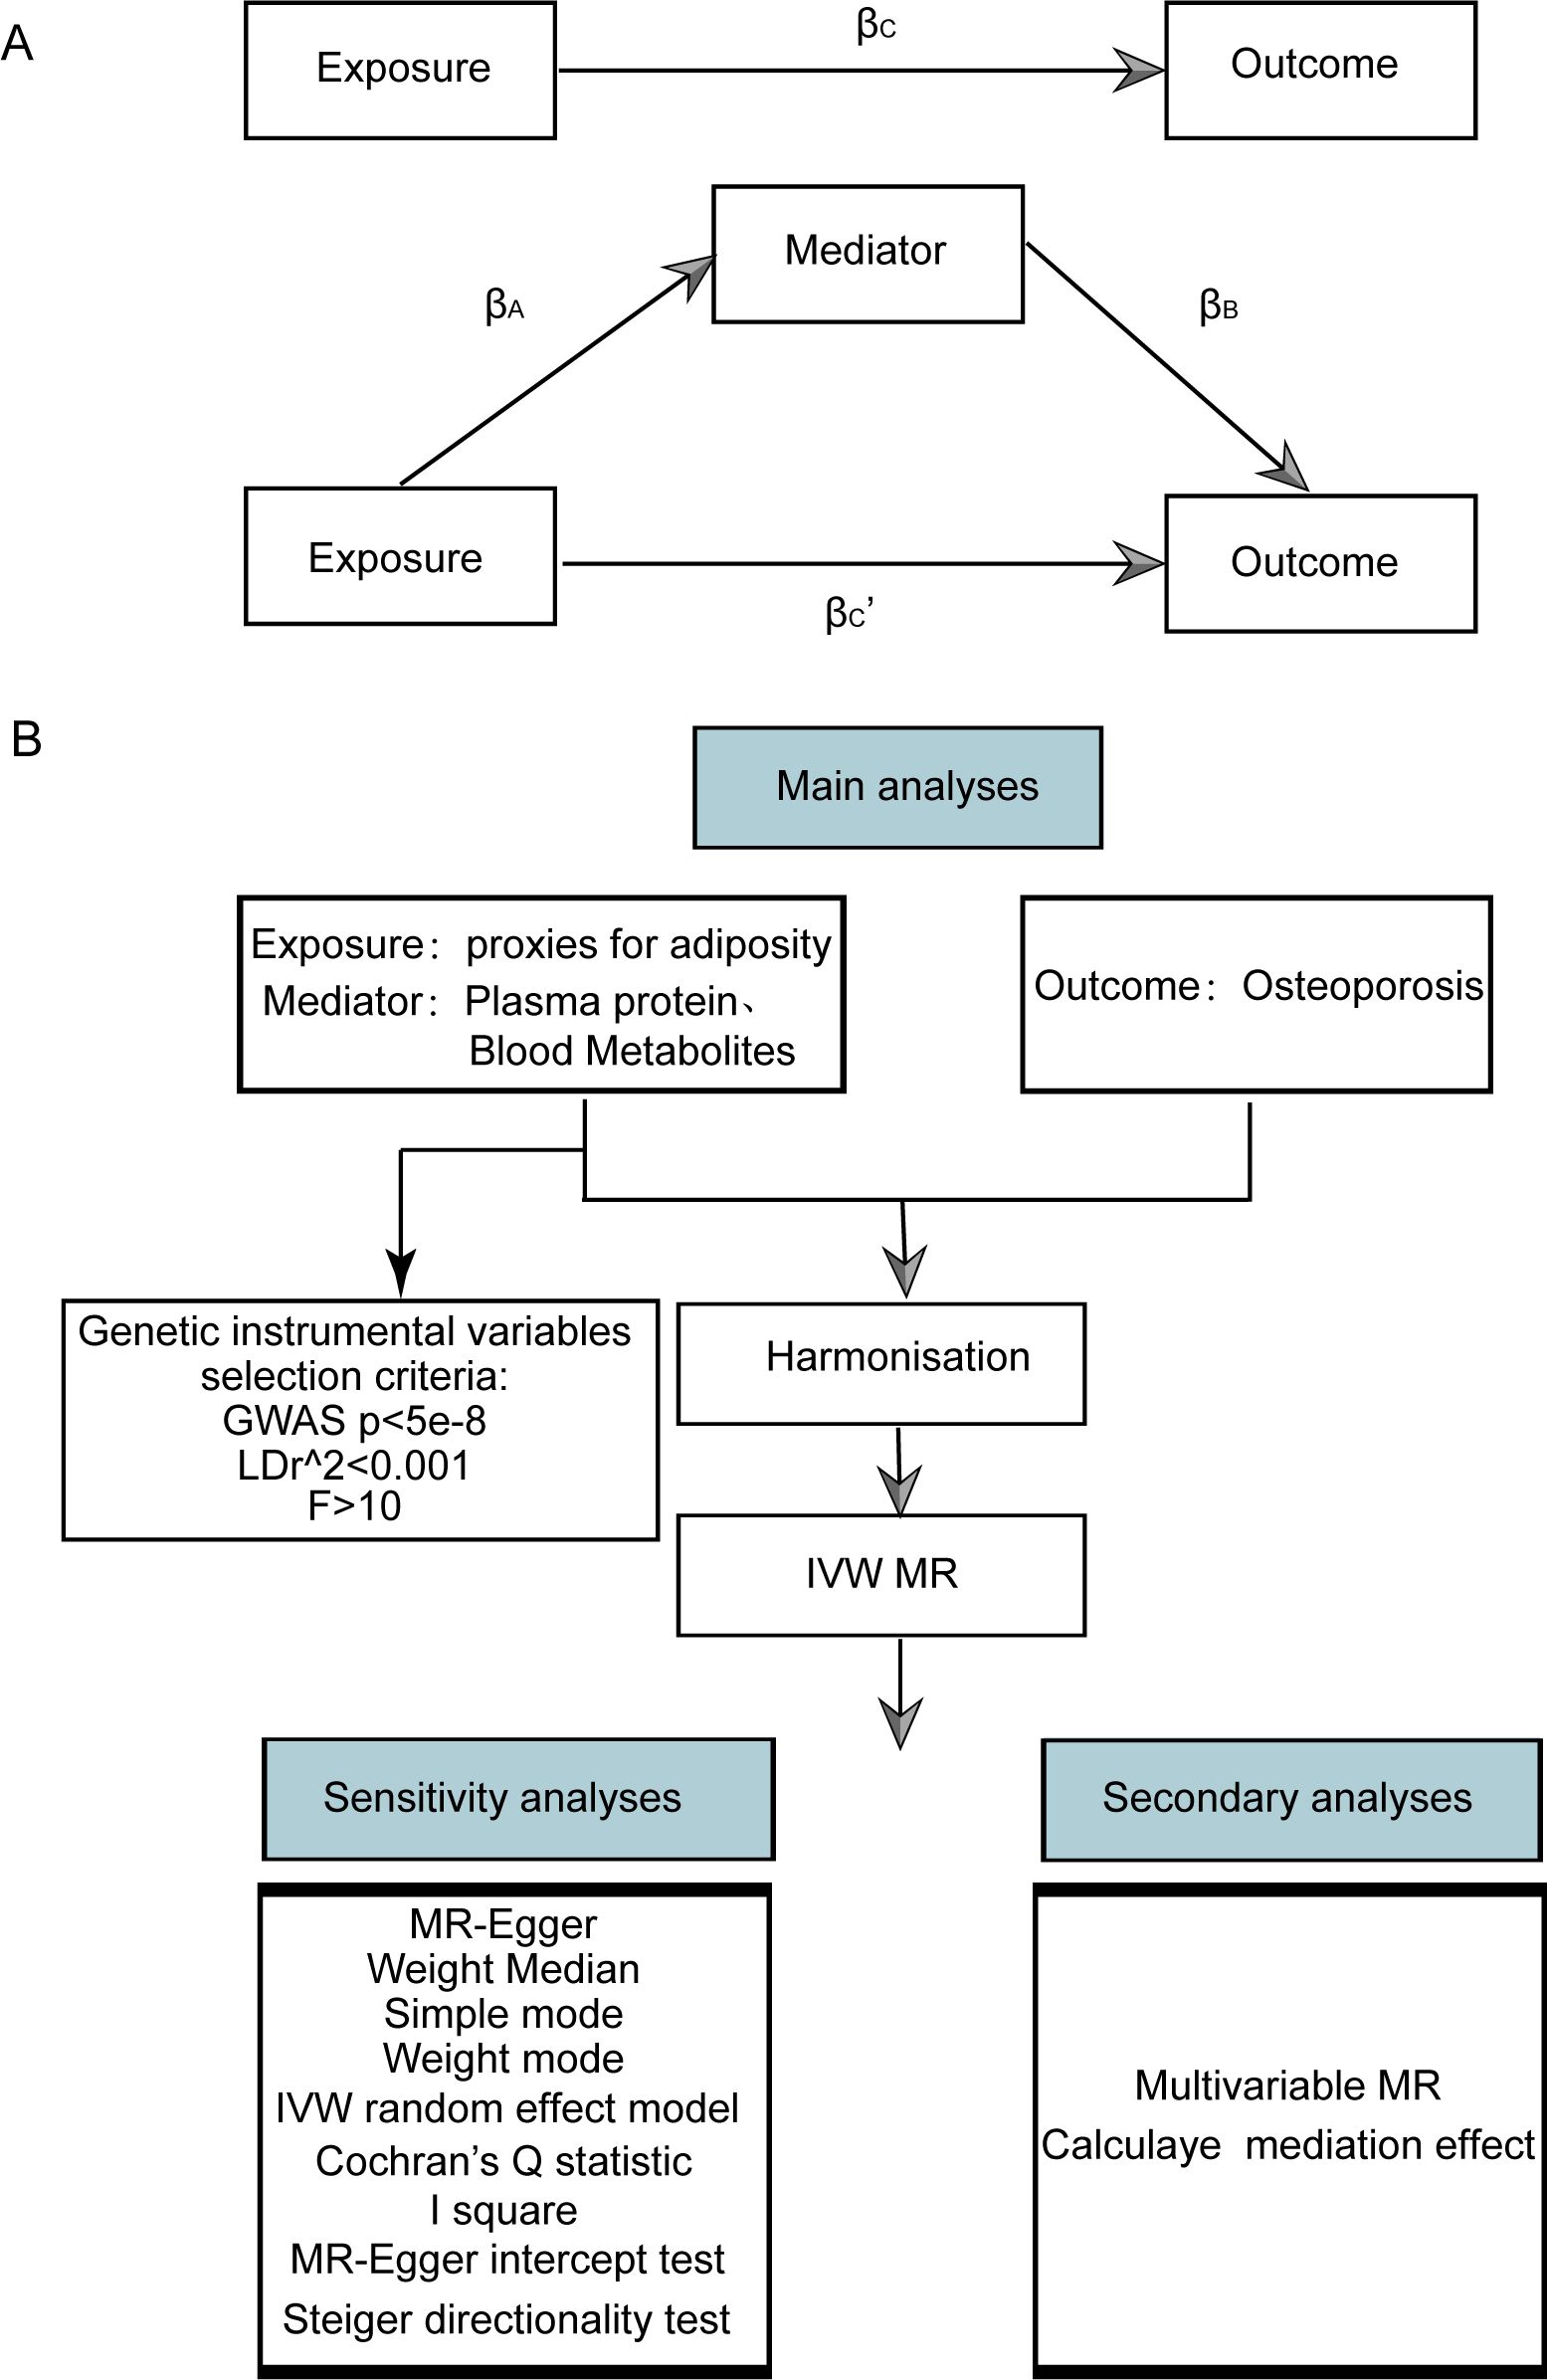
Figure 1. Flow chart of Mendelian randomization analysis. (A) Multivariate MR and intermediary role analysis diagram. Basic assumptions of MR. βA is the univariate MR effect value of exposure on mediation, and βB is the direct effect value of exposure on the multivariate MR analysis of outcomes. βc is the univariate MR effect value of exposure on outcomes. βc’ is the multivariable MR Effect value of exposure on outcome. (B) Flow chart of analysis methods for this study. SNPs, single-nucleotide polymorphisms; IVW, inverse variance weighted; MR-Egger, Mendelian randomization-Egger; GWAS, genome-wide association study.
2.2 Data sourceThe terms “body mass index”, “waist circumference”, “waist-stature ratio”, “percentage body fat”, “waist-to-hip ratio”, and “fat percentage” were used as keywords to search for obesity-related indicators in the European group from the MRC IEU Open GWAS database (20–22), and 53 obesity-related indicators were obtained (Supplementary Table S1). Then TwoSampleMR, a R package, was used to get and standardize the association summary statistics of the 53 indicators.
The list of plasma proteins was obtained from a study on the plasma proteome related to human diseases (23). We queried the MRC IEU Open database using the PMID number 29875488, yielding a dataset of 3,282 plasma proteins (refer to Supplementary Table S2). This dataset encompassed data from 3,301 European individuals. The association summary statistics for these proteins were standardized using the TwoSampleMR R package.
The list of metabolites was from a related literature exploring genetic loci affecting human metabolism (24). We conducted a search in the MRC IEU Open database using the PMID number 24816252, obtaining in a dataset comprising 452 blood metabolites (refer to Supplementary Table S3). The dataset was derived from 8,242 Europeans. The association summary statistics for these metabolites were standardized by utilizing the TwoSampleMR R package.
The GWAS ID of osteoporosis (ukb-a-87) was obtained from the MRC IEU Open GWAS database. The study cohort was comprised of individuals of European descent, totaling 337,159 samples, which included 5,266 osteoporosis cases and 331,893 controls. The summary statistics for the outcome variable were standardized by utilizing the TwoSampleMR R package.
2.3 Instrumental variable selectionA valid genetic instrumental variable must fulfill three core assumptions: (1) the association hypothesis, which states that the chosen instrumental variable must have a notable correlation with the exposure factor; (2) the independence assumption, which dictates that the instrumental variable must not have a significant relationship with any potential confounders that might influence the exposure or the outcome; and (3) the exclusion restriction, which demands that the instrumental variable can only impact the outcome via the pathway of “instrumental variable → exposure → outcome”.
In this study, the criteria of instrumental variable screening for exposure were set as follows: First, a primary screening criterion was set at a P-value less than 5 × 10⁻⁸ for single-nucleotide polymorphisms (SNPs) identified in GWAS. Second, SNPs in linkage disequilibrium, with r2 value of less than 0.001 and separated by a physical distance exceeding 10,000 kb, were excluded. Based on the filtered SNPs, instrumental variables were extracted from the GWAS outcome data. To evaluate potential bias due to weak instrumental variables, F-statistics were computed. When F < 10, it suggests that the genetic variation is a weak instrumental variable and might cause a certain bias in the results (25). Therefore, it is necessary to eliminate such variables to prevent affecting the outcomes. The F-statistic calculation formula is as follows:
In this context, N represents the sample size, k denotes the quantity of instrumental variables employed, and R2 reflects the degree to which these instrumental variables account for the exposure. Specifically, R2 is calculated using the formula R2 = 2 × (1 - MAF) × MAF × 2β, where MAF stands for minimum allele frequency and β represents the allele effect size.
2.4 MR causal effect estimationWe used a variety of methods of two-sample MR analysis to evaluate the causal effect of obesity-related indicators, plasma proteins, and blood metabolites on osteoporosis, including inverse variance weighted (IVW) (26), weight median (27), MR-Egger (28), and weighted model (29). Under certain conditions, the IVW method is considered marginally more robust than other methods; its distinctive feature is the exclusion of the intercept term during regression and the use of the inverse of the outcome variance as the fitting weight. Therefore, in scenarios where pleiotropy is absent, regardless of heterogeneity, the IVW method serves as the primary MR analysis (utilizing the IVW random-effects model in cases of heterogeneity), complemented by four additional methods. In the presence of pleiotropy, the MR-Egger method is adopted to calculate the results. Finally, we determined the direction of causality through the Steiger test of the TwoSampleMR.
2.5 Sensitivity analysisThe sensitivity analysis of the findings was conducted using three tests:
(1) Heterogeneity test: The Cochran Q test was employed to assess the heterogeneity among SNP estimations. A statistically significant Cochran Q test indicates significant heterogeneity in the analysis outcomes. However, this test only determines the presence or absence of heterogeneity; it does not assess its distribution. Therefore, the I2 statistic was introduced to represent the proportion of heterogeneity within the instrumental variables relative to the total variation. Specifically, the I2 value of ≤0 is set to 0, signifying no heterogeneity; values between 0% and 25% indicate mild heterogeneity, 25%–50% suggest moderate heterogeneity, and >50% denote high heterogeneity. The formula for this calculation is detailed below:
(2) Pleiotropy test: To assess pleiotropy, the MR-Egger method was applied. A statistically significant MR-Egger intercept with a P-value below 0.05 indicates substantial horizontal pleiotropy of the genetic variation.
(3) Leave-one-out test: The leave-one-out test was conducted by iteratively excluding individual SNPs to compute the MR results using the remaining instrumental variables. This was done to evaluate the impact of each SNP on the relationship between exposure factors and outcomes. A significant disparity between the MR effect estimates and the overall effect estimates upon excluding a specific instrumental variable would suggest that the MR effect estimates are highly sensitive to that particular SNP.
2.6 Multivariate MR analysis and mediating effect estimationMultivariable Mendelian randomization (MVMR) extends the traditional MR framework. It utilizes genetic variations linked to several potentially interconnected exposures to ascertain the impact of multiple exposures on a single outcome. This approach enables the assessment of the direct effects of an individual exposure on a specific outcome. Before conducting MVMR, we selected those obesity-related indicators, plasma proteins, and blood metabolites with significant causal effects on osteoporosis in univariate MR as subsequent MVMR exposures. The MVMR models for obesity-related indicators, plasma proteins, and blood metabolites on osteoporosis were constructed for MVMR analysis. The direct effects of obesity-related indicators, plasma protein, and blood metabolites on osteoporosis were obtained through MVMR analysis, and the effects of obesity-related indicators on plasma proteins and blood metabolites were obtained through univariate MR. This allowed us to estimate the indirect effects of obesity-related indicators → plasma proteins or blood metabolites → osteoporosis pathway (Figure 1). Effect sizes and standard errors for mediating effects were calculated according to the following equation:
βM=βA×βB
SEM=(βA×SEB)2+(βB×SEA)2where βM is the effect size of mediating effect, and SEM is its corresponding standard error. βA is the univariate MR effect of exposure (obesity-related indicators) on mediator, and SEA is its corresponding standard error. βB is the direct effect of plasma proteins or blood metabolites on osteoporosis (obtained by MVMR), and SEB is its corresponding standard error (Figure 1A).
Combined with the causal stepwise regression method, if both βA and βB are significant, the indirect effect is significant. If βA or βB are not significant, Sobel test was used to determine whether βM is significant. If βM is significant, the indirect effect is significant. Under the premise of significant indirect effect, if the MR effect value βC, of obesity-related indicators on osteoporosis in MVMR is significant, the direct effect is significant, and other mediators might exist. Otherwise, the direct effect is not significant, and the complete mediating effect is assumed. Under the premise that both indirect and direct effects are significant, if βM and βC, have different signs, according to the cover effect theory, calculate the covering ratio: | βM/βC, | × 100%. If βM and βC, have the same number, according to the partial mediation effect theory, calculate the mediation accounted for: βM/βC × 100%, where βC is the effect size of obesity-related indicators on osteoporosis in univariate MR. Due to the complexity of the mediating effect, this paper only discusses the mediation effect based on the case where there is a significant causal correlation between exposure and outcome, and there is also a significant causal correlation between exposure and mediating factors.
2.7 Statistical analysisAll data computations and statistical analyses were conducted using R (https://www.r-project.org/, version 4.3.1). Primarily, the TwoSampleMR package facilitated MR analysis. To assess the robustness and reliability of the findings, we employed the Cochran Q test and leave-one-out analysis. Genetic pleiotropy was tested using the MR-Egger intercept method. Our evaluation criteria included the odds ratio (OR) and 95% confidence interval (95% CI). All reported P-values were two-sided. In the context of SNPs derived from GWAS studies, a P-value less than 5 × 10⁻⁸ was considered statistically significant. For other statistical assessments, a P-value below 0.05 was considered statistically significant.
3 Results3.1 Analysis framework and flow chartThe MVMR and intermediary role analysis diagram is shown in Figure 1A. The flow chart of analysis methods for this study is shown in Figure 1B.
3.2 Instrumental variable screeningSNPs with linkage disequilibrium were removed according to the screening criteria of instrumental variables in our study. After matching with the GWAS data for osteoporosis, SNPS related to obesity-related indicators, plasma proteins, and blood metabolites were included as instrumental variables. The instrumental variables with a significant p-value (<0.05) identified by MR analysis of each index are shown in Supplementary Tables S4-S6. The F-test statistics for these indicators are greater than 10, suggesting that the screened SNPs had a strong effect and that the potential bias due to weak instrumental variables is limited.
3.3 MR causal effect estimatesFive models, including MR Egger, weighted median, IVW, simple mode (SM), and weighted mode were used for analysis. The significance of the IVW model (P < 0.05) served as the screening condition for significant causality. The causal effect estimation results for these five models are shown in Supplementary Tables S7-S9.
The scatter plots of the effect estimate for SNPs screened after MR analysis of obesity-related indicators and osteoporosis are shown in Figures 2, 3. Only results with more than two SNPS are shown in the figures. It can be seen that the direction of the scatter plot fitting curve for the five models is essentially the same, and the slopes of most models is relatively consistent. The intercept of the IVW model was close to 0. For obesity-related indicators, the results of the IVW model are shown in Table 1 and Figure 4. The IVW model results show that obesity-related indicators such as BMI, waist circumference, waist-to-hip ratio, leg fat percentage (right), leg fat percentage (left), arm fat percentage (right), arm fat percentage (left), and body fat percentage have a significant causal relationship with the pathogenesis of osteoporosis (P < 0.05). Finally, the Steiger test suggested that the causal direction from obesity-related indicators to osteoporosis is correct (Supplementary Table S10). The Steiger directionality test calculated the variance rate (r2) of SNPs for exposure and outcome, respectively. The results showed that the SNPs for our selected indicators explained more variance of exposure than in outcome, with the direction being TRUE, and the p-values were less than 0.05, indicating that the direction is correct.
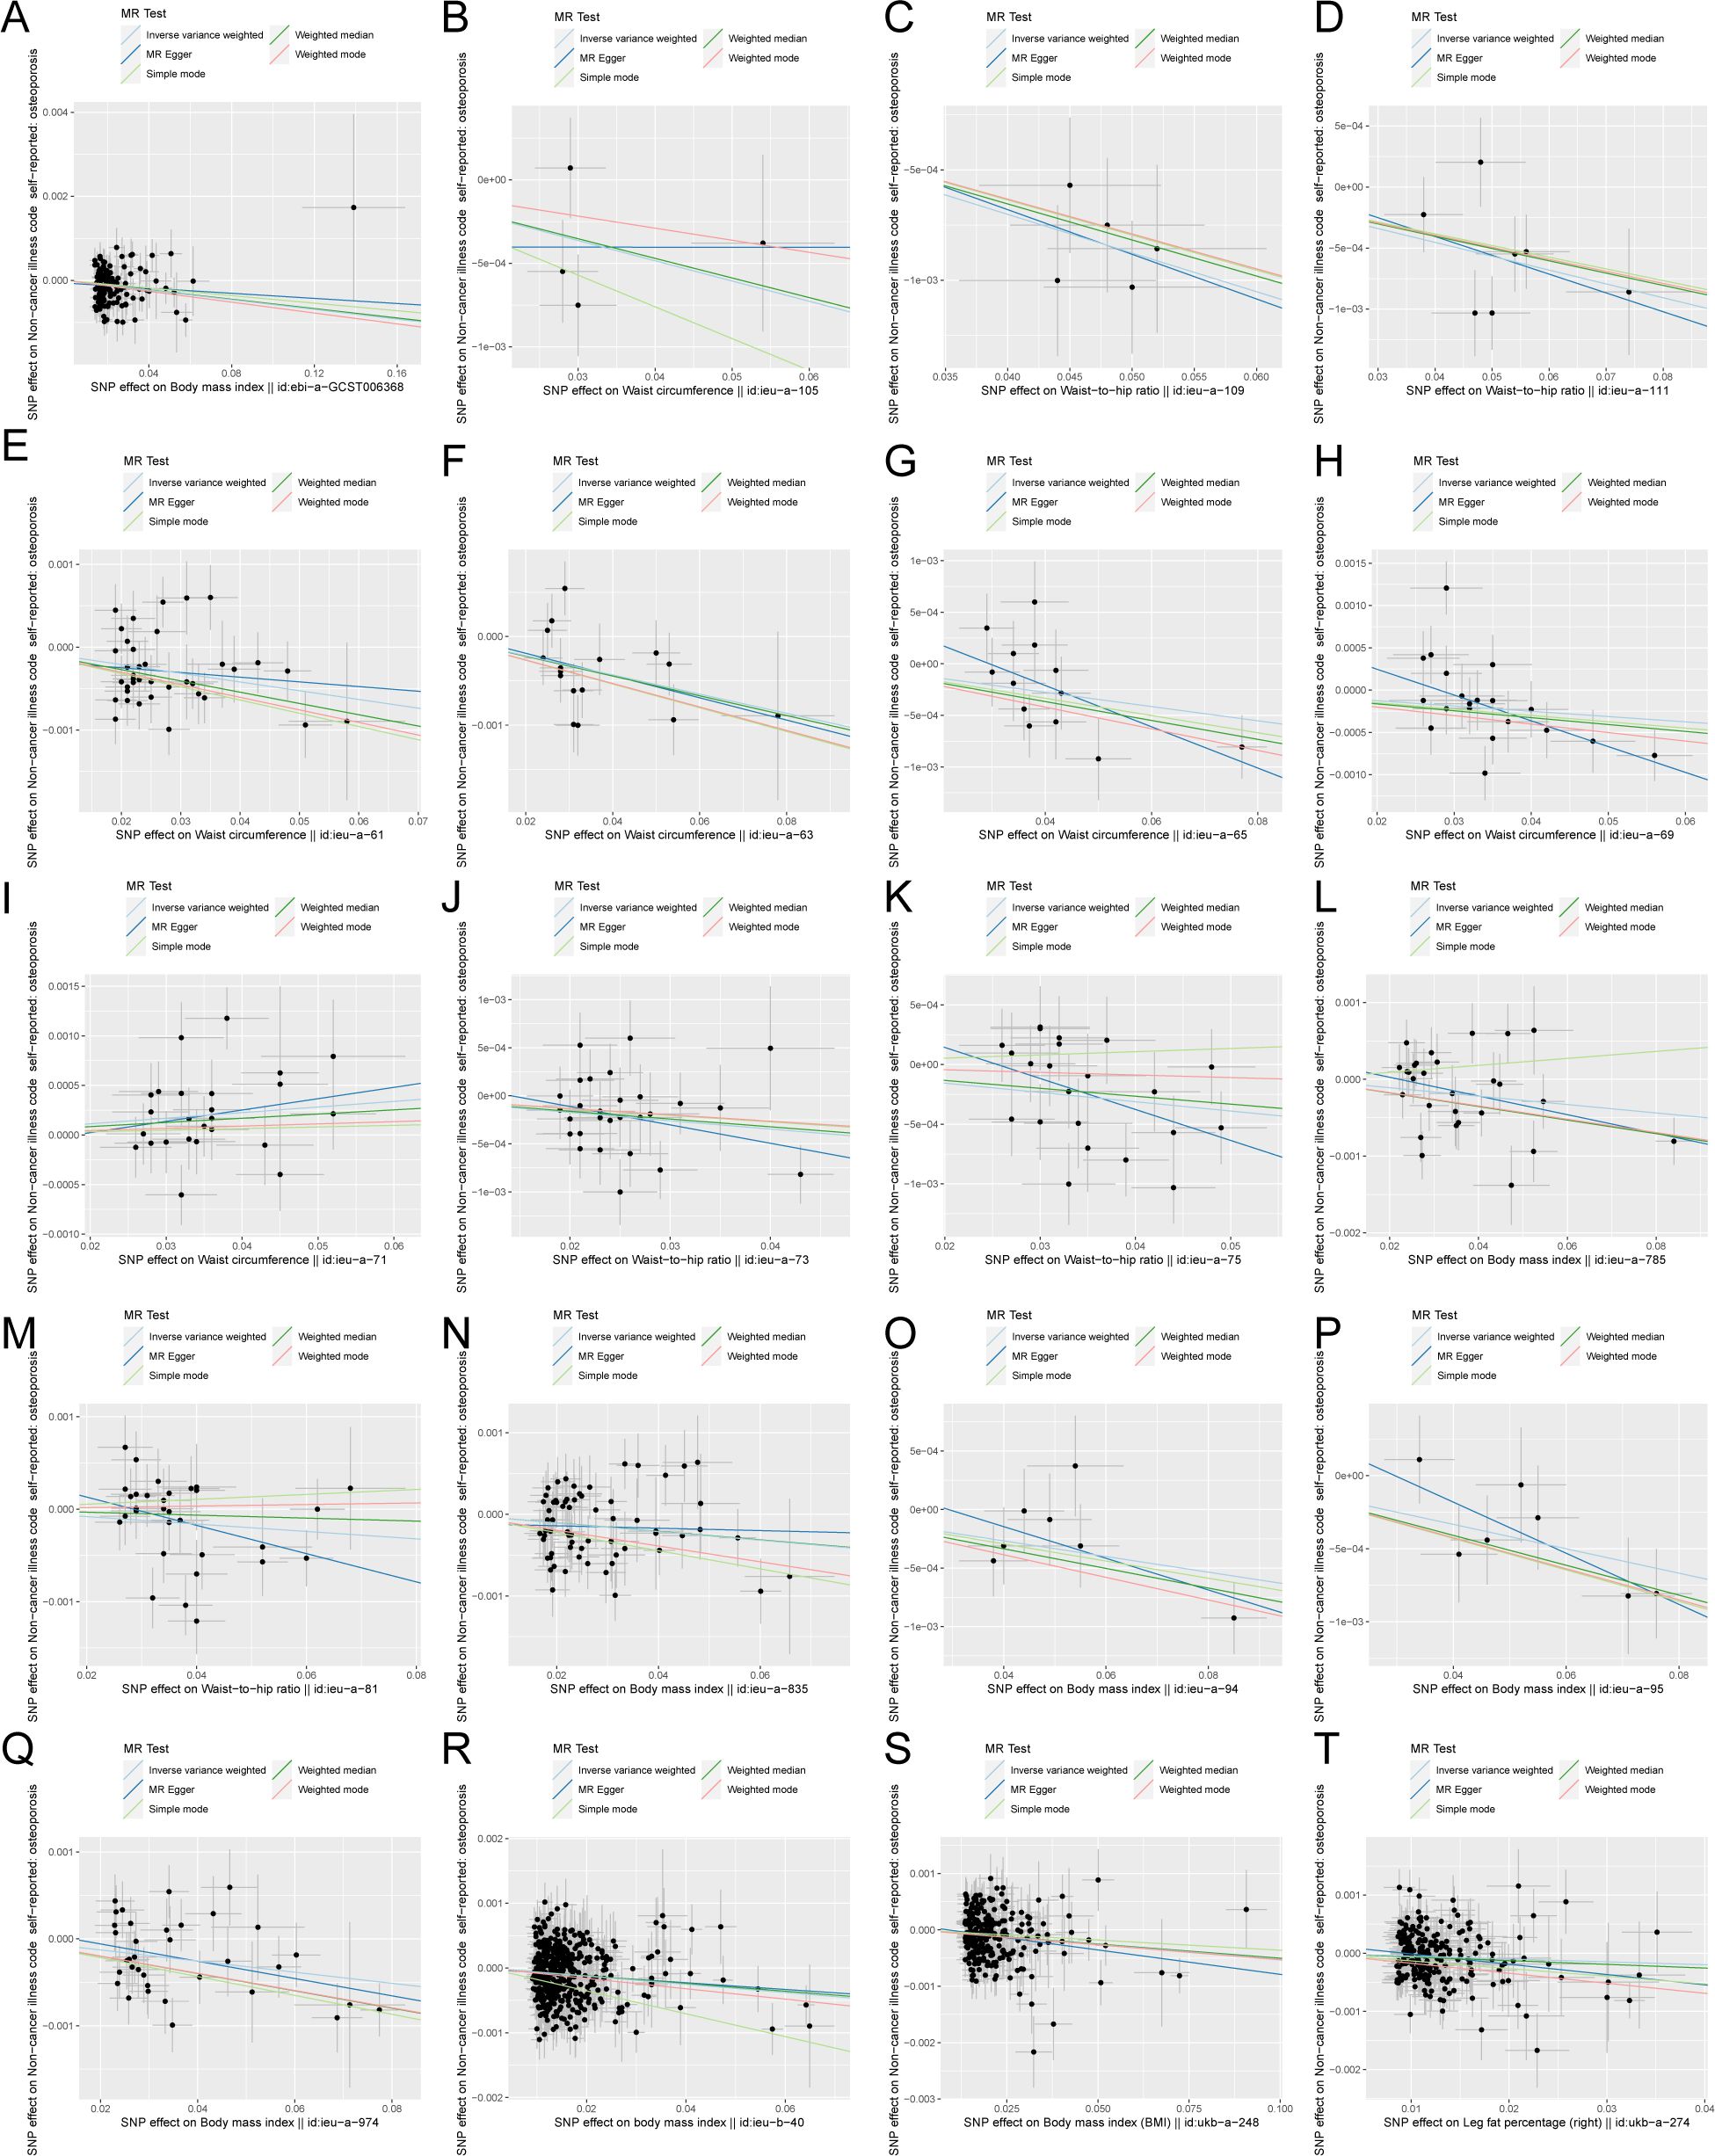
Figure 2. Scatter plot of correlation between obesity-related indicators (part 1) and osteoporosis. (A) Body mass index||id: ebi-A-GCST006368. (B) Waist circumference||id: ieu-A-105. (C) Waist-to-hip the wire||id: Ieu-a-109. (D) Waist-to-hip the wire||id: ieu-a-111. (E) Waist circumference||id: ieu-a-61. (F) Waist circumference||id: Ieu-a-63. (G) Waist circumference||id: ieu-a-65. (H) Waist circumference||id: ieu-a-69. (I) Waist circumference||id: Ieu-a-71. (J) Waist-to-hip the wire||id: ieu-a-73. (K) Waist-to-hip the wire||id: ieu-a-75. (L) Body mass index||id: Ieu-a-785. (M) Waist-to-hip the wire||id: ieu-a-81. (N) Body mass index||id: ieu-a-835. (O) Body mass index||id: Ieu-a-94. (P) Body mass index||id: ieu-a-95. (Q) Body mass index||id: ieu-a-974. (R) Body mass index||id: Ieu-b-40. (S) Body mass index (BMI)||id: ukb-a-248. (T) Leg fat percentage (right)||id: ukb-a-274. Light blue, IVW; green, weight median; dark blue, MR-Egger; light green, simple mode; pink, weighted model.
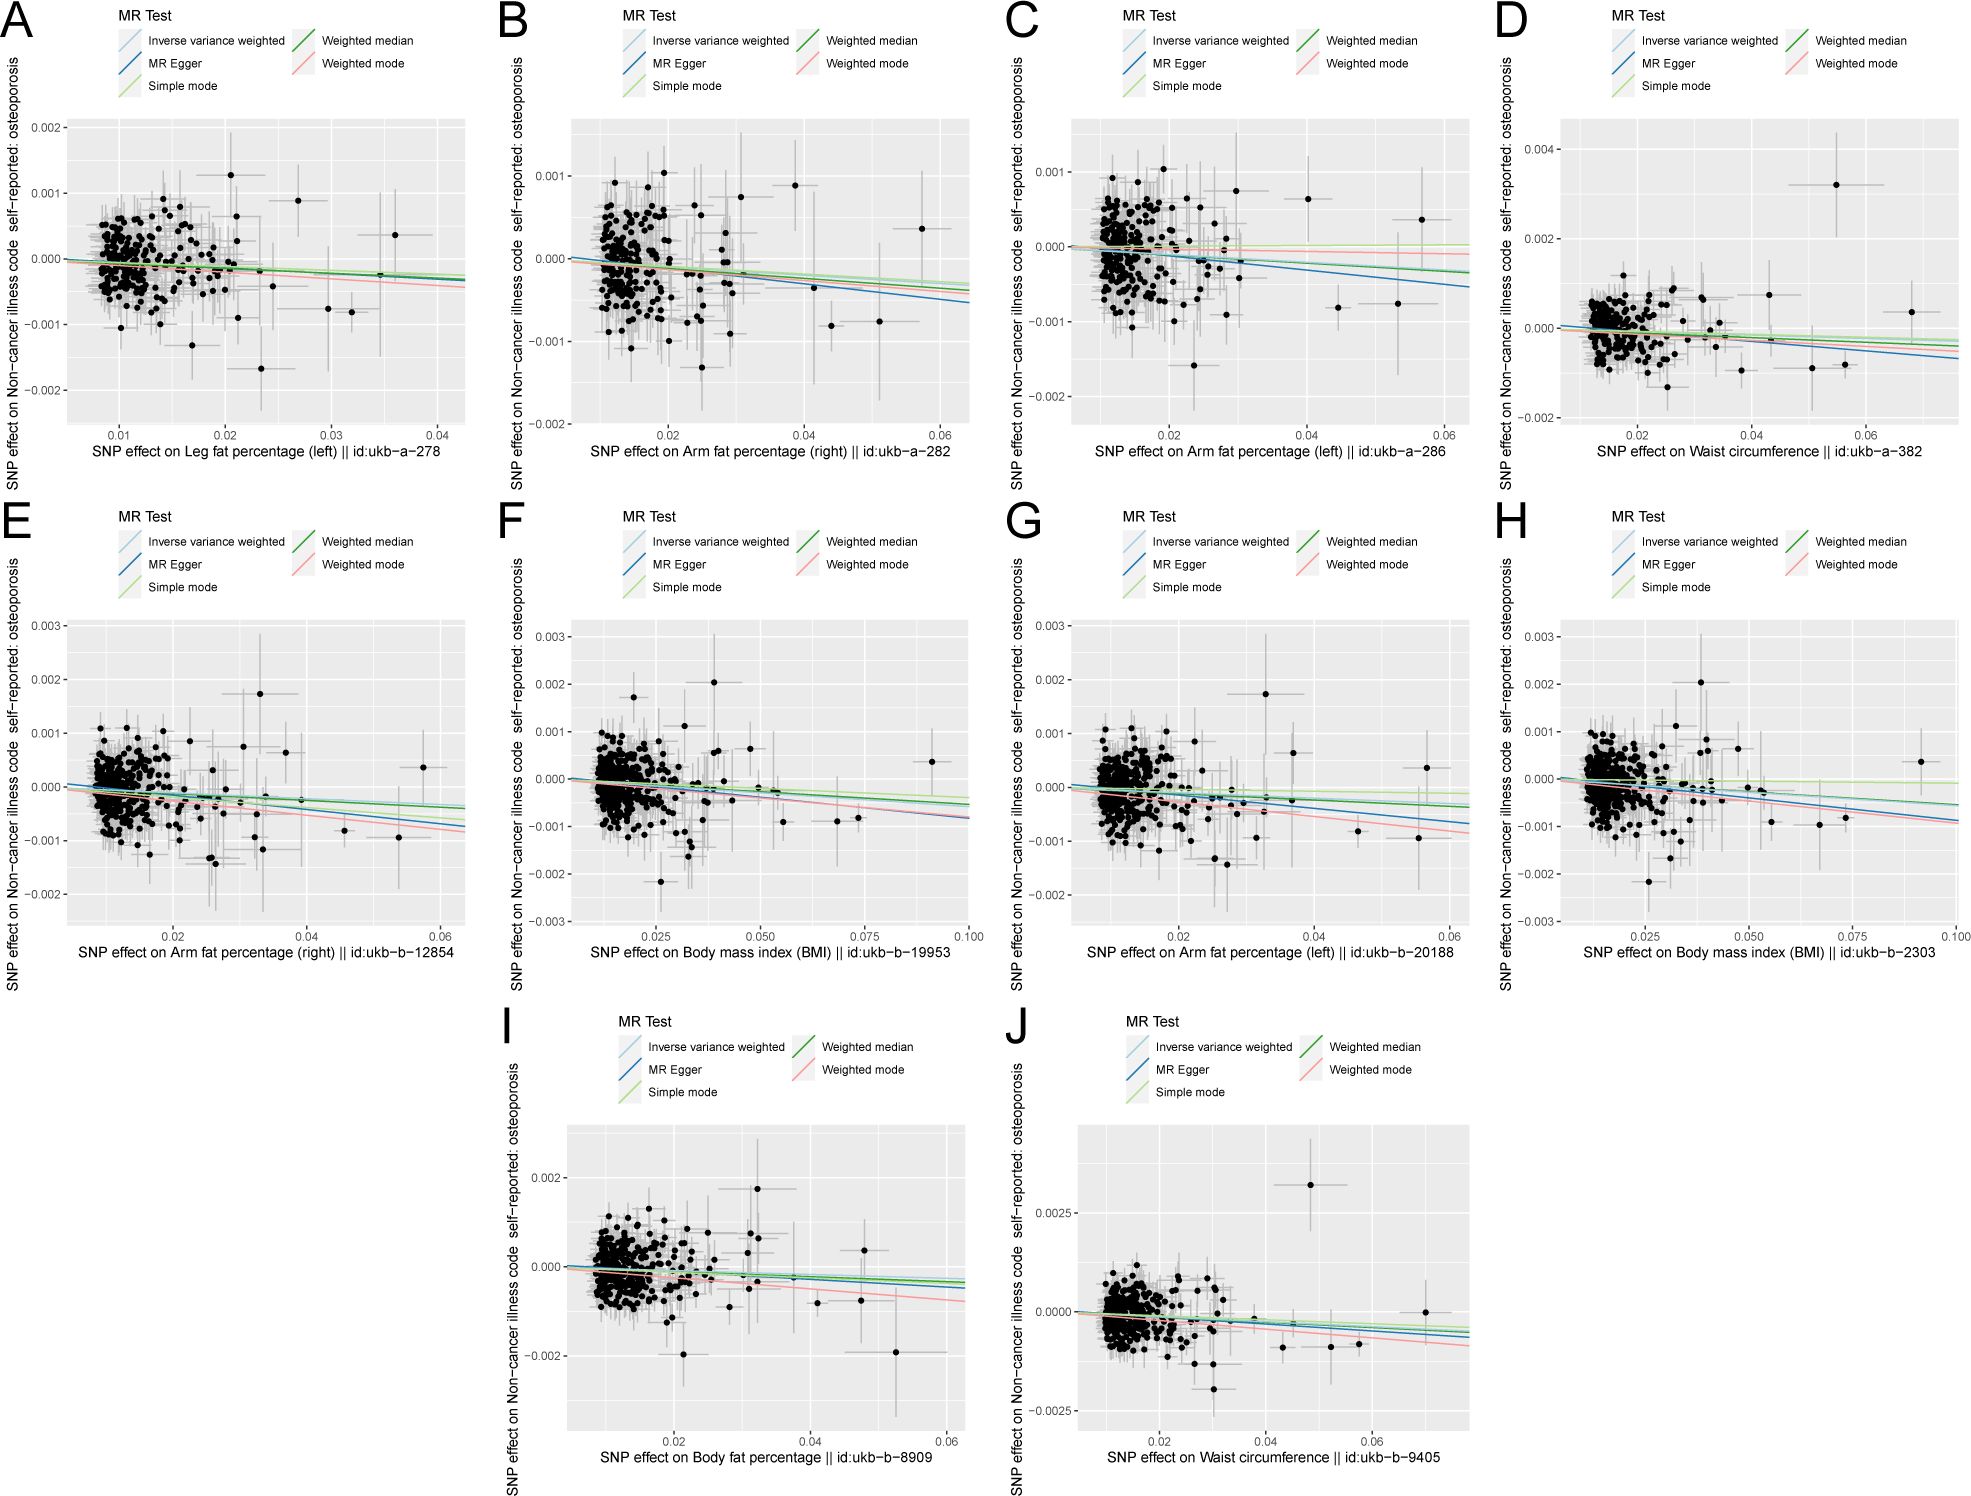
Figure 3. Scatter plot of correlation between obesity-related indicators (part 2) and osteoporosis. (A) Leg fat percentage (left)||id: ukb-A-278. (B) Arm fat percentage (right)||id: Ukb-a-282. (C) Arm fat percentage (left)||id: ukb-a-286. (D) Waist circumference||id: Ukb-a-382. (E) Arm fat percentage (right)||id: ukb-b-12854. (F) Body mass index (BMI)||id: Ukb-b-19953. (G) Arm fat percentage (left)||id: ukb-b-20188. (H) Body mass index (BMI)||id: Ukb-b-2303. (I) Body fat percentage with||id: ukb-b-8909. (J) Waist circumference||id: ukb-b-9405). Light blue, inverse variance weighted (IVW); green, weight median; dark blue, MR-Egger; light green, simple mode; pink: weighted model.
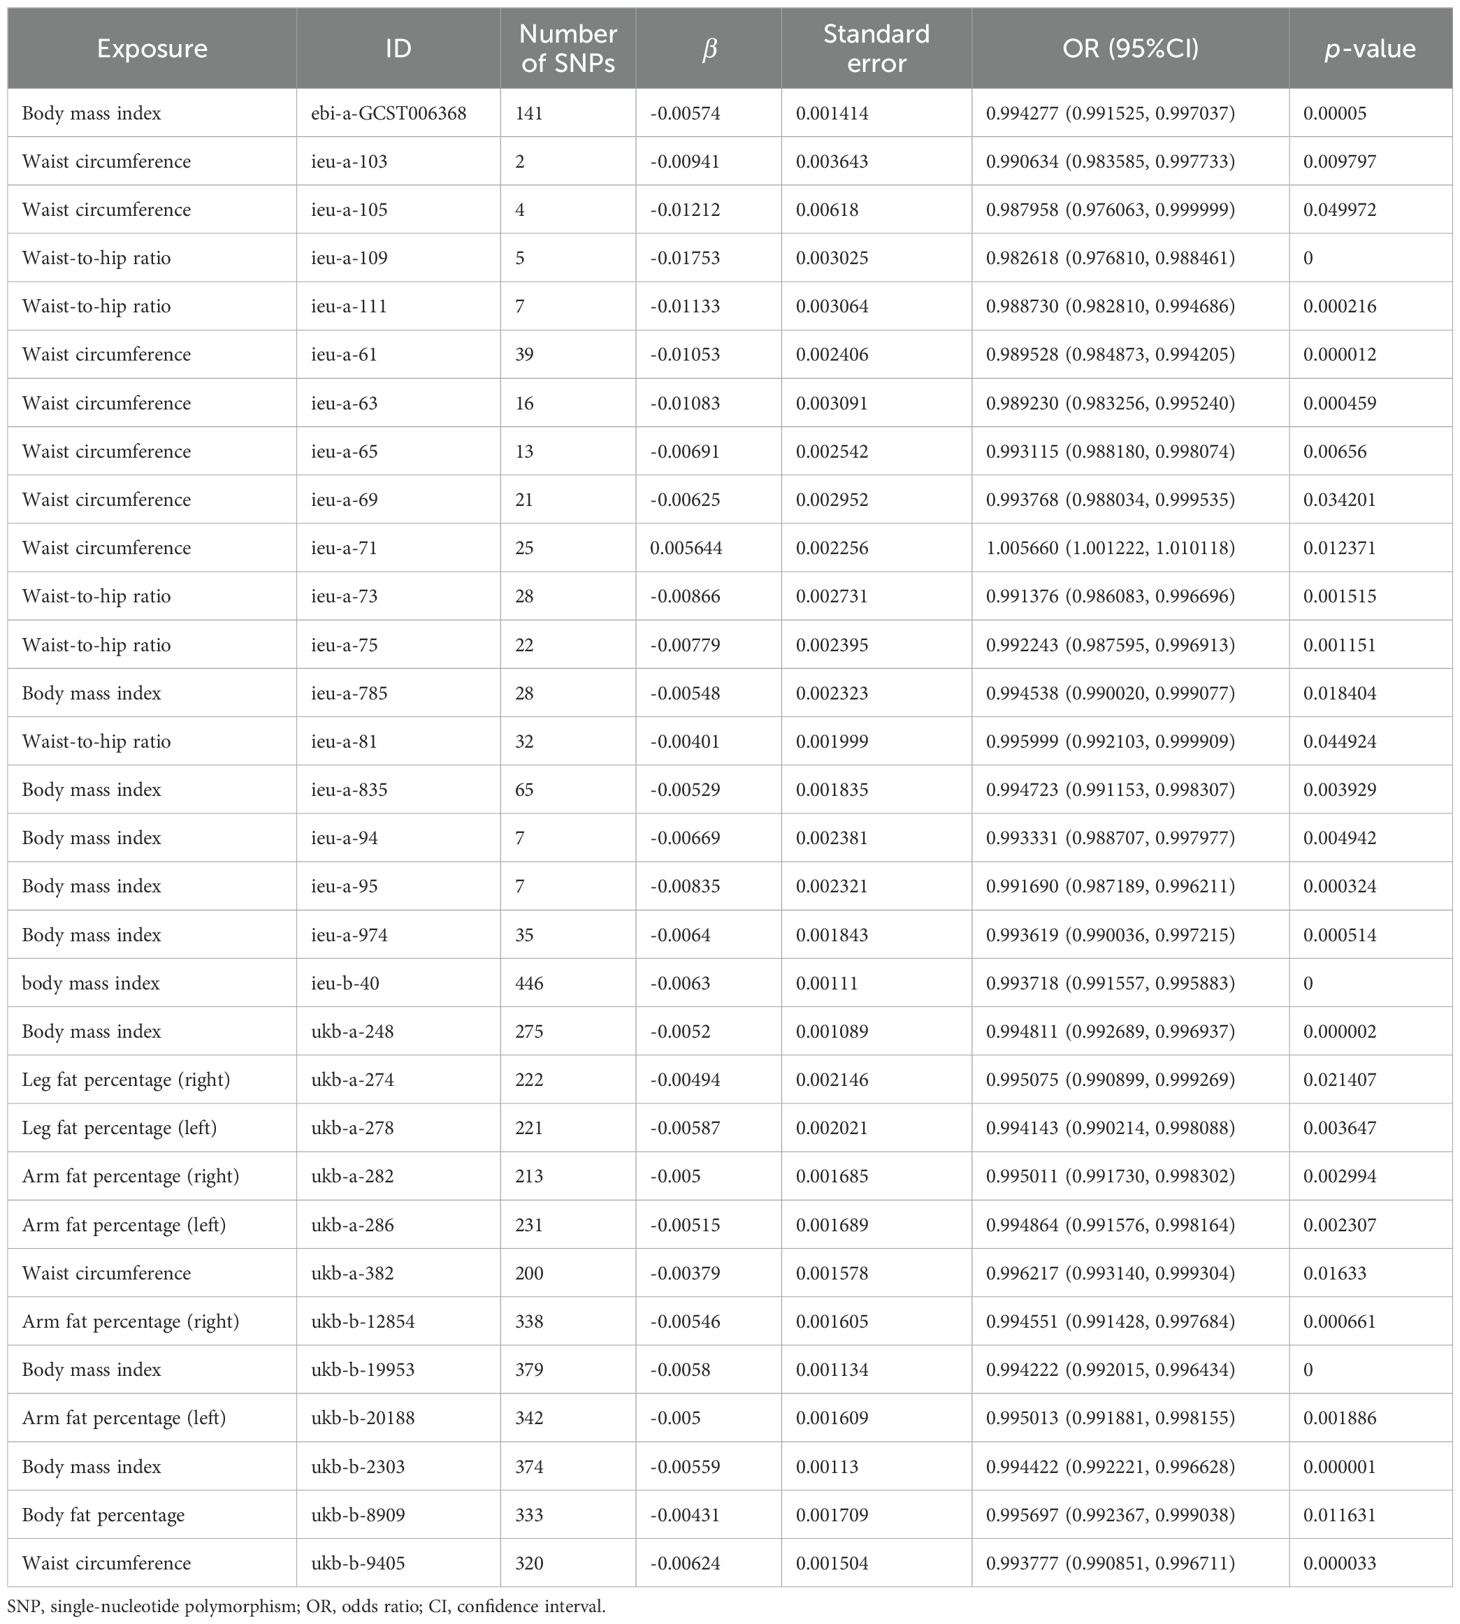
Table 1. Estimation of MR causal effects of obesity-related indicators on osteoporosis (IVW model).
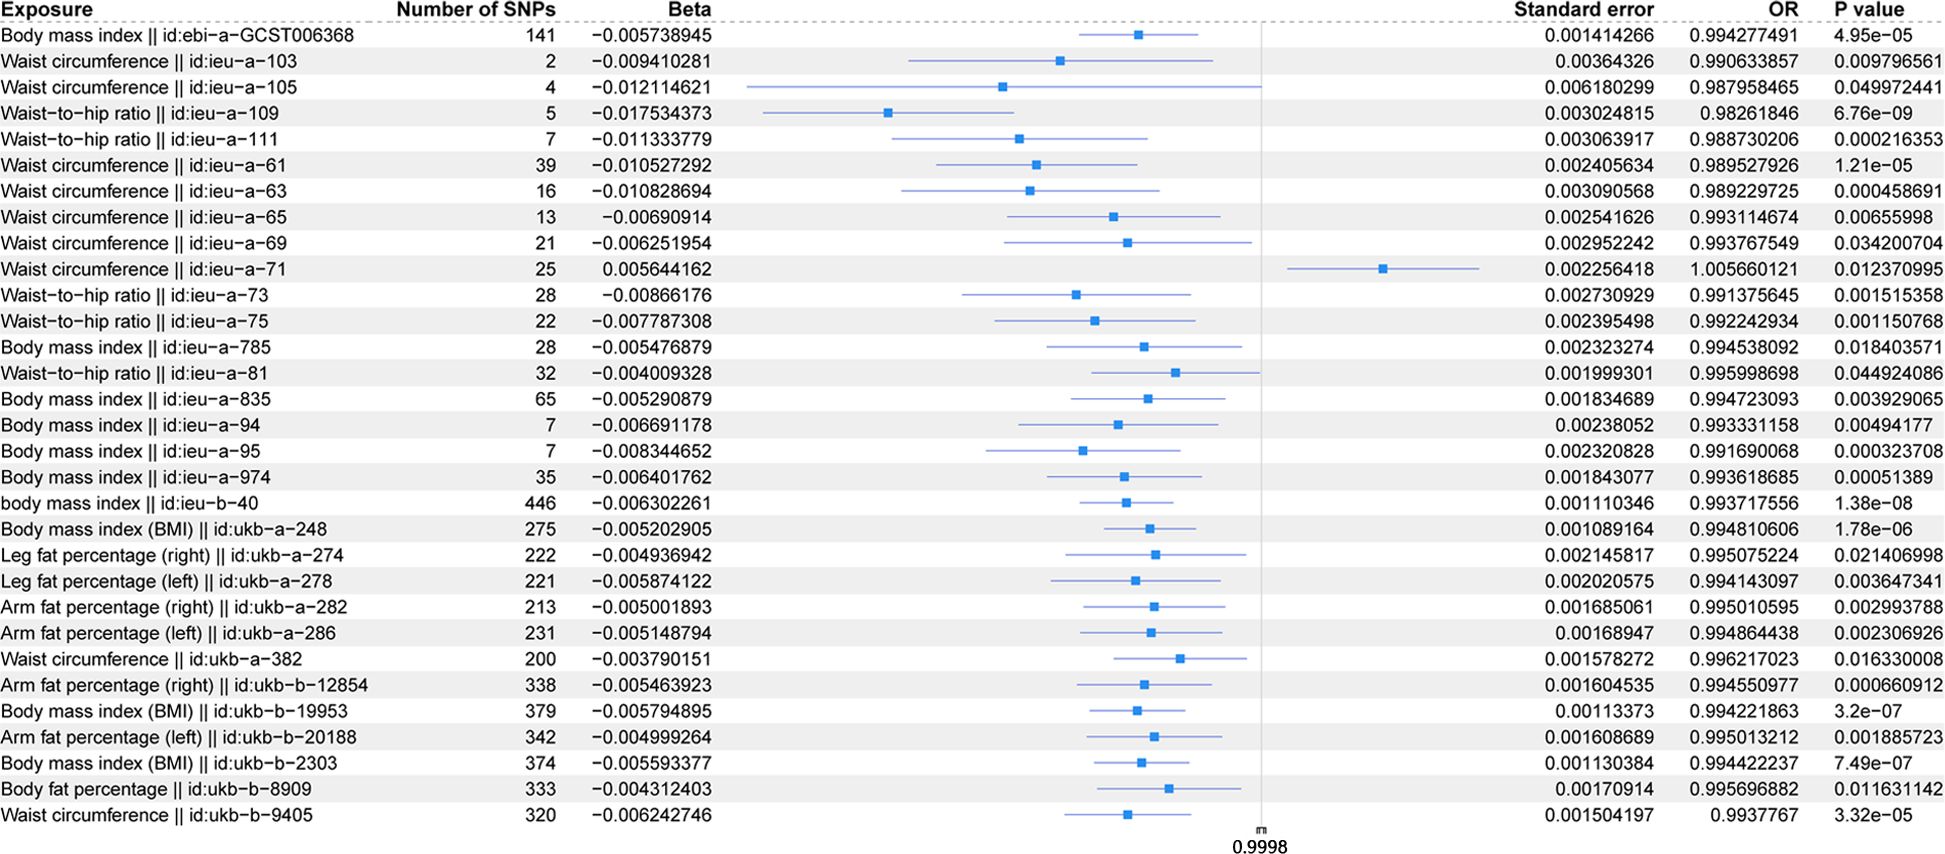
Figure 4. Forest plot of IVW model for MR of obesity-related indicators on osteoporosis.
Figure 5 shows the scatter plot of the SNP effect estimates following MR analysis of plasma proteins in relation to osteoporosis (only the results with more than two SNPs are shown in the figure). The scatter plot fitting curves of the five models generally align in direction, with a relatively consistent slope across most models, and the intercept of the IVW model approaches zero. Table 2 and Figure 6A show the results of the IVW model of plasma protein on osteoporosis. The IVW model results show that several plasma proteins exhibit a significant causal link with osteoporosis development (P < 0.05), including ankyrin repeat domain-containing protein 46 (ANKED46), glutamate receptor ionotropic delta-2, apolipoprotein M, immunoglobulin lambda-like polypeptide 1, interleukin-17 receptor B, integral NKG2-E type II protein, the killer cell lectin-like receptor subfamily F member 1 (KLRF1), ecto-ADP ribosyltransferase-4, lactoperoxidase (LPO), neural cell adhesion molecule 2, potassium-transporting ATPase subunit beta, platelet-derived growth factor receptor alpha, serine/threonine protein kinase pim-1, myeloblastin, estrogen sulfotransferase, transcobalamin-1, and transforming growth factor beta-induced protein ig-h3, thioredoxin domain-containing protein 12, zinc finger protein 175 (ZNF175), carbonic anhydrase 9 (CA9), and calcium/calmodulin-dependent protein kinase type 1, chordin-like protein 2, C-type lectin domain family 12 member A, histone lysine-N-methyltransferase EHMT2, and endothelial cell-selective adhesion molecule. Finally, we used the Steiger directionality test to validate the causal direction of plasma protein to osteoporosis (Supplementary Table S11). The Steiger directionally test calculated the variance explanation rate (r2) of SNPs for exposure and outcome, respectively; the results showed that the variance explanation rate of SNPs for exposure was greater than for outcome, both directions were TRUE, and the p-values were less than 0.05, confirming the correct causal direction.
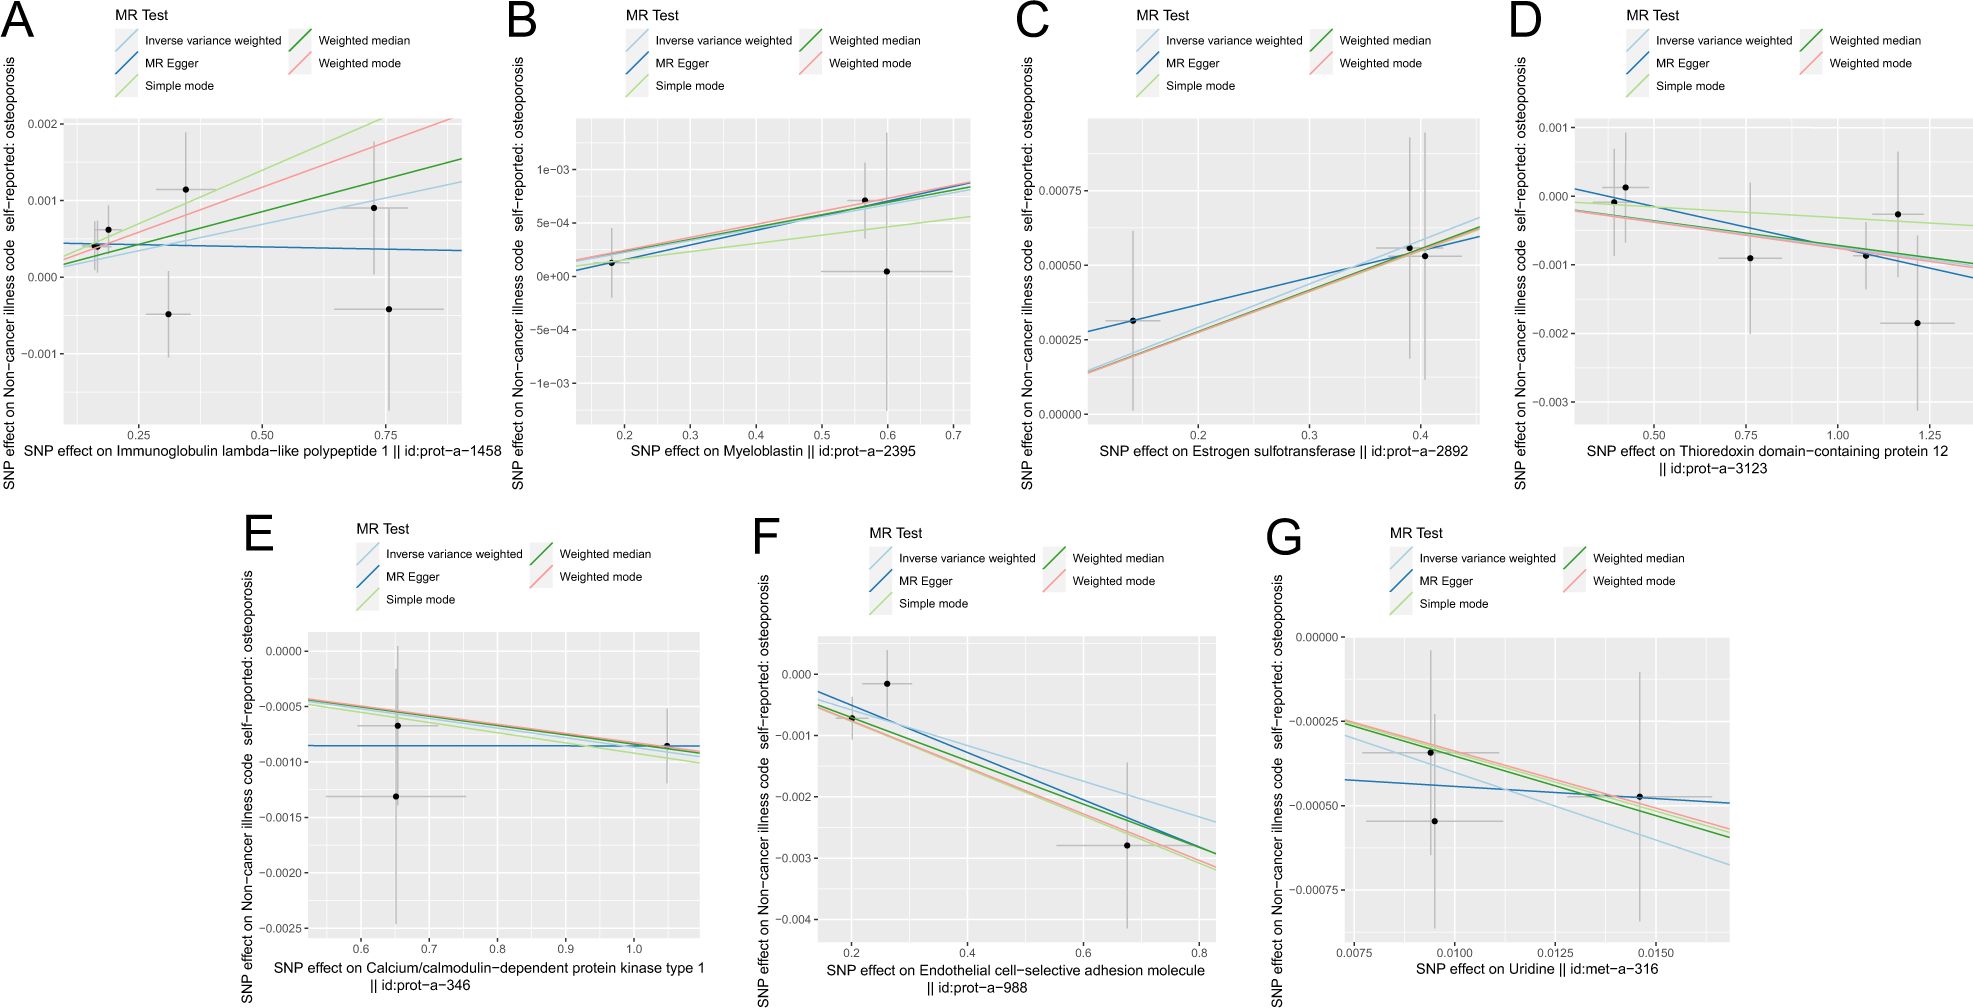
Figure 5. Scatter plot of correlation between plasma proteins, blood metabolites, and osteoporosis. (A) Plasma proteins in immunoglobulin lambda-like polypeptide 1||id: prot-A-1458. (B) Myeloblastin||id: Prot-a-2395. (C) Estrogen sulfotransferase||id: prot-a-2892. (D) Thioredoxin domain-containing protein 12||id: Prot-a-3123. (E) Calcium/calmodulin-dependent protein kinase type 1||id: Prot-a-346. (F) Endothelial cell-selective adhesion molecule||id: prot-a-988. (G) Uridine||id: met-a-316.) Light blue, IVW; green, weight median; dark blue, MR-Egger; light green, simple mode; pink, weighted model.
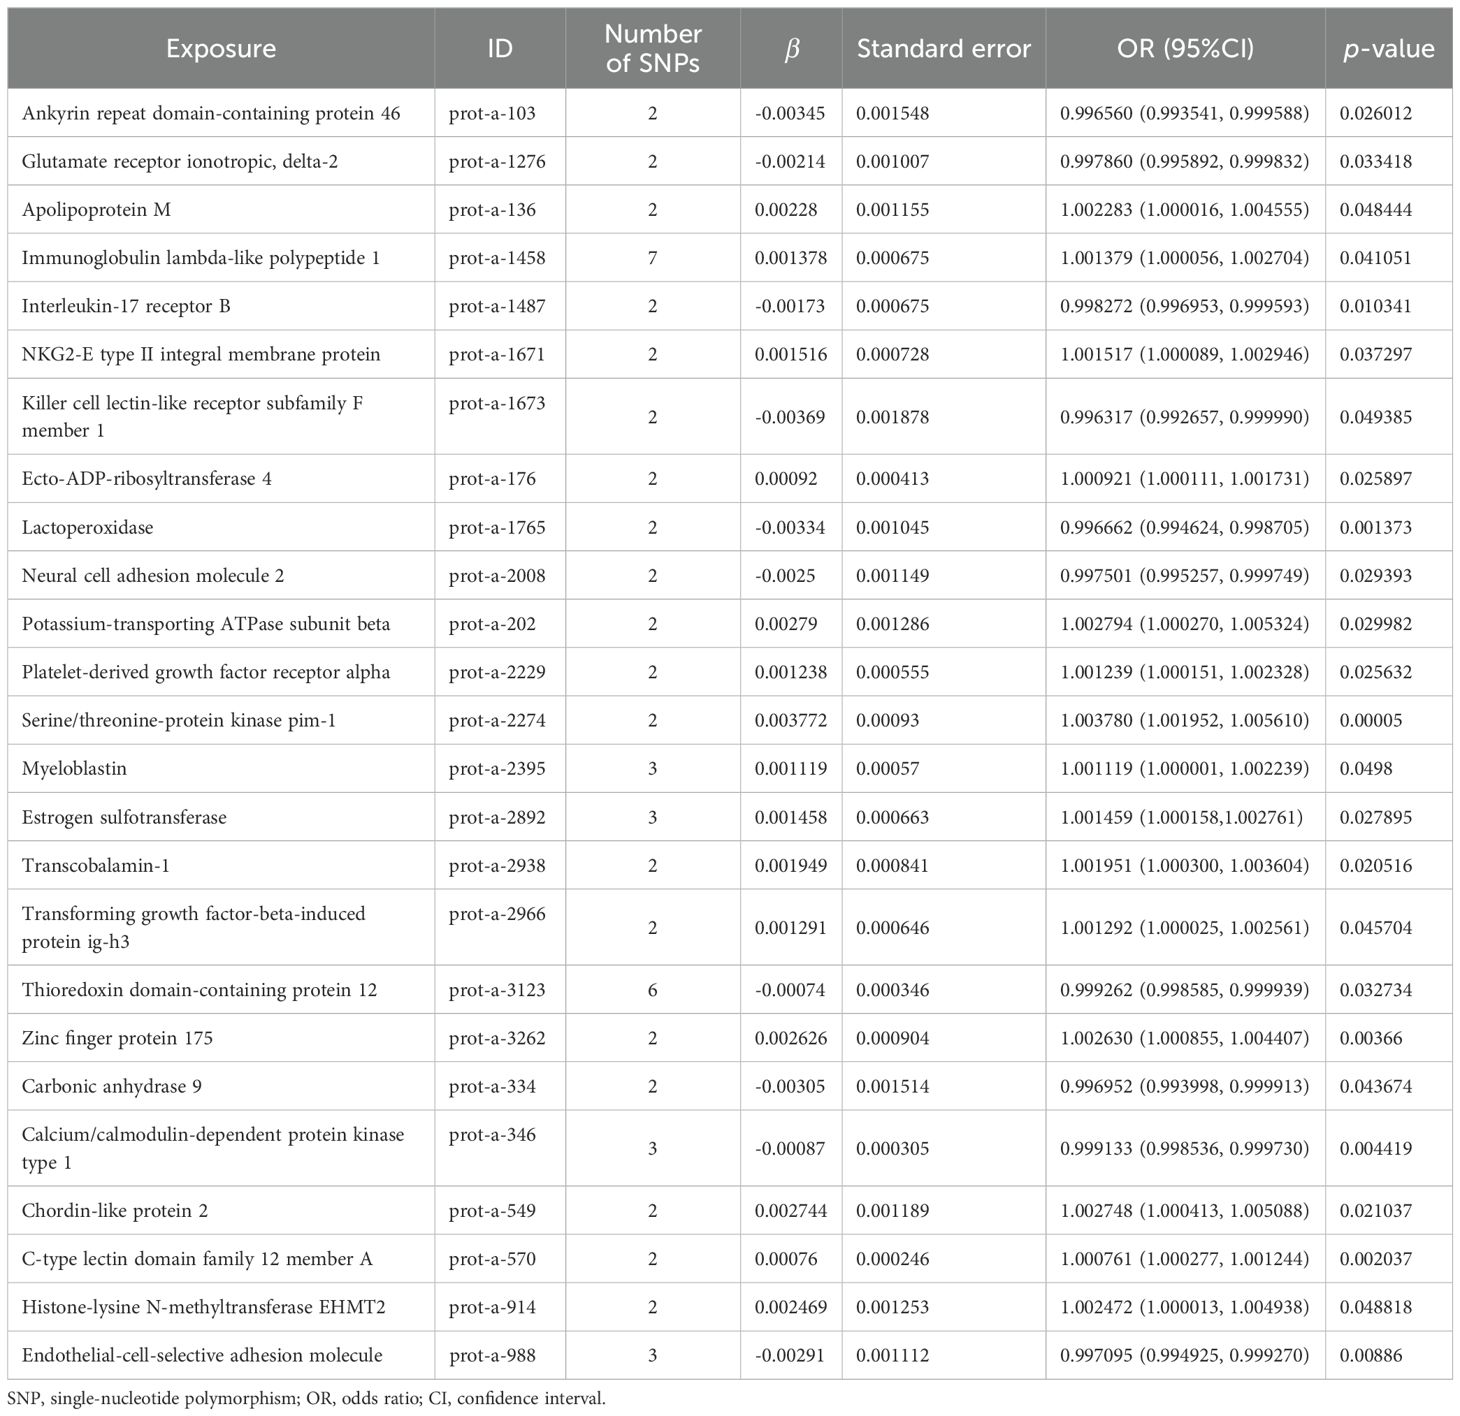
Table 2. MR causal effect estimation of plasma proteins and osteoporosis.
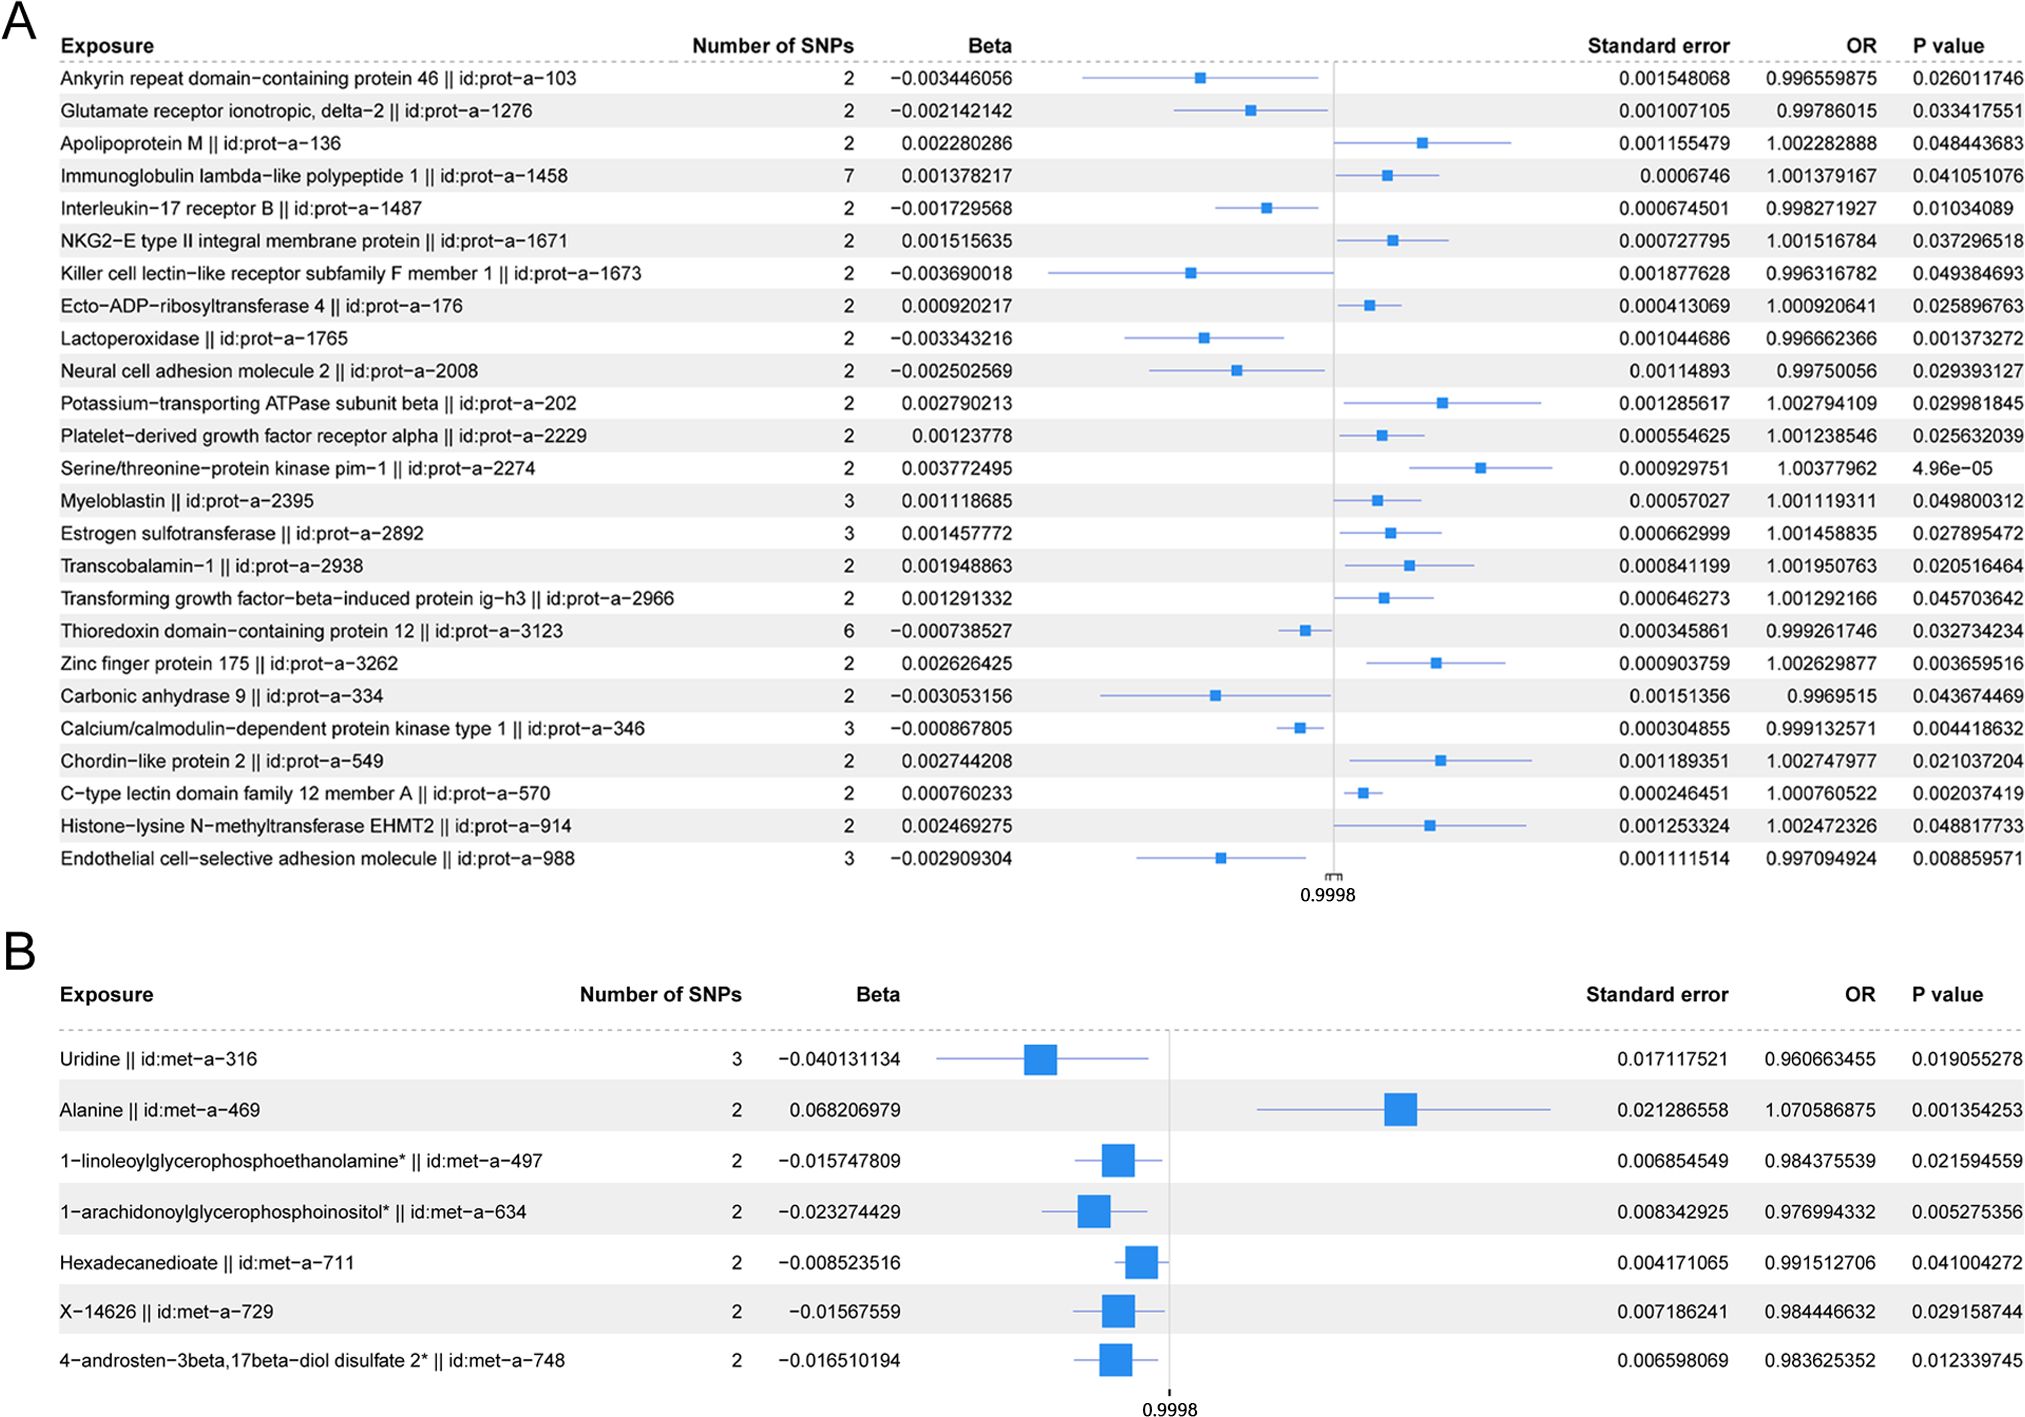
Figure 6. (A) Forest plot of the IVW model for plasma proteins on osteoporosis. (B) Forest plot of the IVW model for blood metabolites on osteoporosis.
The scatter plots of the estimated effect of the SNPs screened following the MR analysis of blood metabolism and osteoporosis are shown in Figure 5 (only the results of more than two SNPs are shown). All kinds of scatter diagram of the model fitting curves have the same direction, most of the models of slope are consistent, and the intercept of the IVW model is close to zero. As for blood metabolism, the results of the IVW model are shown in Table 3 and Figure 6B. The IVW model results show that the metabolism of blood of uridine, alanine, 1-linoleoylglycerophosphoethanolamine, 1-arachidonoylglycerophosphoinositol, hexadecanedioate, X-14626, 4-androsten-3 beta, and 17 beta-diol disulfate 2 has a significant causal relationship with the pathogenesis of osteoporosis (P < 0.05). Finally, the Steiger directionality test was used to ascertain the causal direction of blood metabolism to osteoporosis (Supplementary Table S12). The Steiger directionality test calculated the variance explanation rate (r2) of SNPs for exposure and outcome, respectively, and the results show that the variance for exposure is greater than for outcome, the direction is TRUE, and the p-values are less than 0.05, suggesting that the causal direction was correct.
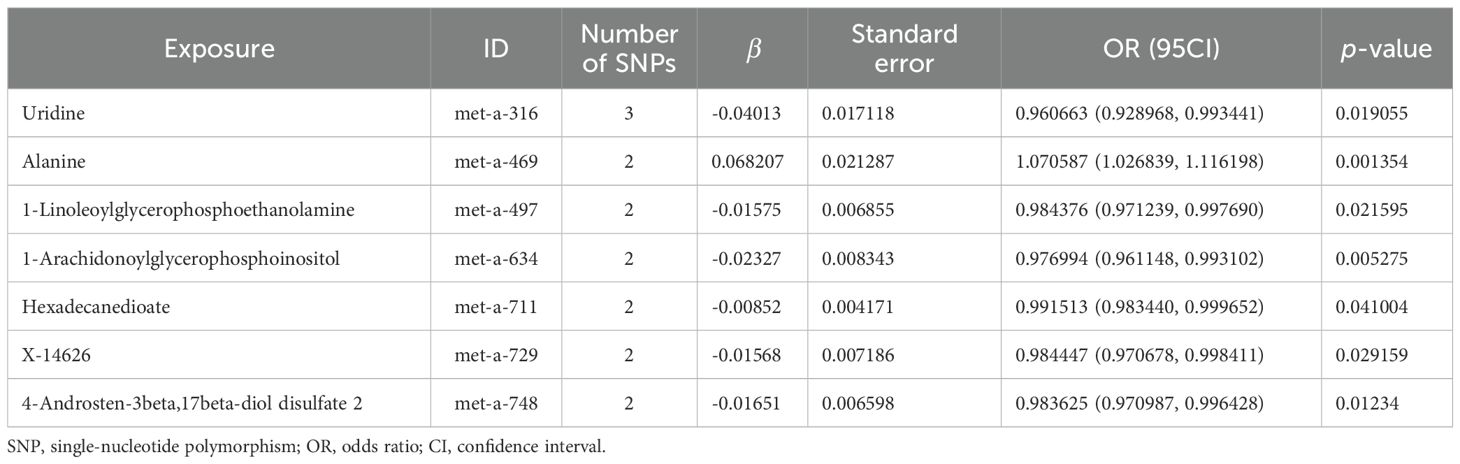
Table 3. MR causal effect estimation of blood metabolism and osteoporosis.
3.4 Sensitivity analysis3.4.1 Obesity-related indicatorsThe Cochran Q test and I2 statistic results (Supplementary Table S13) indicated that the heterogeneity of the MR results for most obesity-related indicators on osteoporosis was not significant (Cochran Q p-value >0.05) and the heterogeneity ratio was low (I2 < 50%). The funnel plots of the instrumental variables of most obesity-related indicators are shown in Supplementary Figures S1 and S2, which only show the results when the SNPs are more than two. The scatter points of causal association effects are essentially symmetrically distributed on both sides of the IVW model line, indicating that there is no potential bias in the results. Indicators with SNP numbers less than three could not be included for subsequent pleiotropic inspection and leave-one-out test. For a highly heterogeneous index, the IVW random-effects model was used to estimate the causal effect, with the results presented in Table 4.
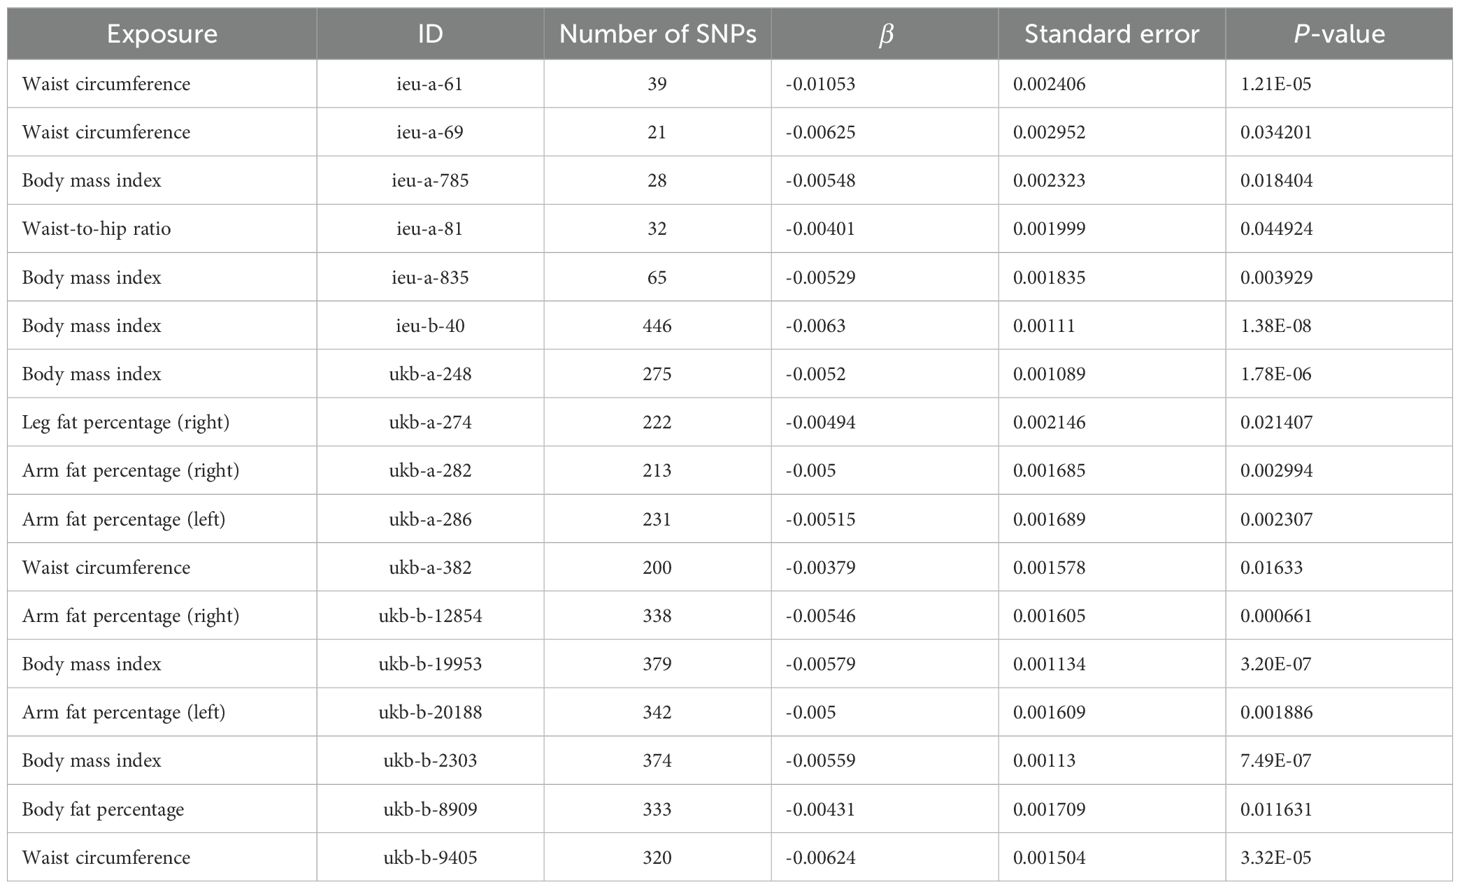
Table 4. IVW random-effects model analysis of obesity-related indicators on osteoporosis.
Based on the MR-Egger regression results, the p-values from the statistical hypothesis tests of the intercept terms for each index exceeded 0.05, and the intercept was close to zero. This implies that horizontal pleiotropy did not influence the causal inferences between obesity-related indicators and osteoporosis in this study (Supplementary Table S14).
The sensitivity analysis of the results using the leave-one-out test revealed no significant changes in the effect estimates for obesity-related measures, indicating the stability of the results (Supplementary Table S15, mr_leaveoneout_plot_obesity-related indicators.zip).
3.4.2 Plasma proteinThe Cochran Q test and I2 statistic results (Supplementary Table S16) showed that the heterogeneity of the MR results of the selected plasma proteins related to osteoporosis was not significant (Cochran Q p-value >0.05) and the heterogeneity ratio was low (I2 < 50%). The funnel plots of instrumental variables for most plasma proteins, as shown in Supplementary Figure S3 (only presenting the results for SNPs with a count greater than two), demonstrated that the causal correlation effect of scatter in the IVW model distribution is symmetrical on each side, suggesting that the result does not have potential bias. Indicators with SNP counts less than three were not included for subsequent pleiotropic inspection and leave-one-out test.
According to the MR-Egger regression results, the p-values from the statistical hypothesis tests for the intercept terms of each index were greater than 0.05, and the intercept was close to zero. This suggests that horizontal pleiotropy did not influence the causal inferences between plasma proteins and osteoporosis (Supplementary Table S17).
The sensitivity analysis of the results using the leave-one-out test revealed no significant changes in the effect estimates for plasma proteins, indicating the stability of the results (Supplementary Table S18, mr_leaveoneout_plot_ plasma proteins.zip).
3.4.3 Blood metabolitesBased on the Cochran Q test and I2 statistic results (Supplementary Table S19), we observed that the MR analysis of most blood metabolites selected on osteoporosis was with no significant heterogeneity (Cochran Q p-value >0.05) or relatively low heterogeneity (I2 < 50%). The funnel plot of the instrumental variables of blood metabolites is shown in Supplementary Figure S4 (only shows the results when the number of SNPs is more than two), and the scatter of the causal association effect is essentially symmetrically distributed on both sides of the IVW model line, suggesting that there is no potential bias in the results. Indicators with fewer than three SNPs could not undergo subsequent horizontal pleiotropy test and leave-one-out test.
According to the MR-Egger regression results, the p-values from the statistical hypothesis tests of the intercept terms for each index were greater than 0.05, and the intercept was close to zero. This implies that horizontal pleiotropy did not influence the causal inferences between blood metabolites and osteoporosis (Supplementary Table S20).
The sensitivity analysis of the results using the leave-one-out test did not show significant changes in the effect estimates for blood metabolites, suggesting the stability of the results (Supplementary Table S21, mr_leaveoneout_plot_blood metabolism.zip).
3.5 Multivariate MR analysisBased on the abovementioned results, we identified obesity-related indicators, plasma proteins, and blood metabolites that have a significant causal relationship with osteoporosis. We then conducted MR analysis of obesity-related indicators for plasma proteins and blood metabolites, respectively (Tables 5, 6). Combinations with significant causality in the IVW model, positive Steiger directivity test results, and p-values less than 0.05 were selected and presented (Supplementary Tables S22, S23).
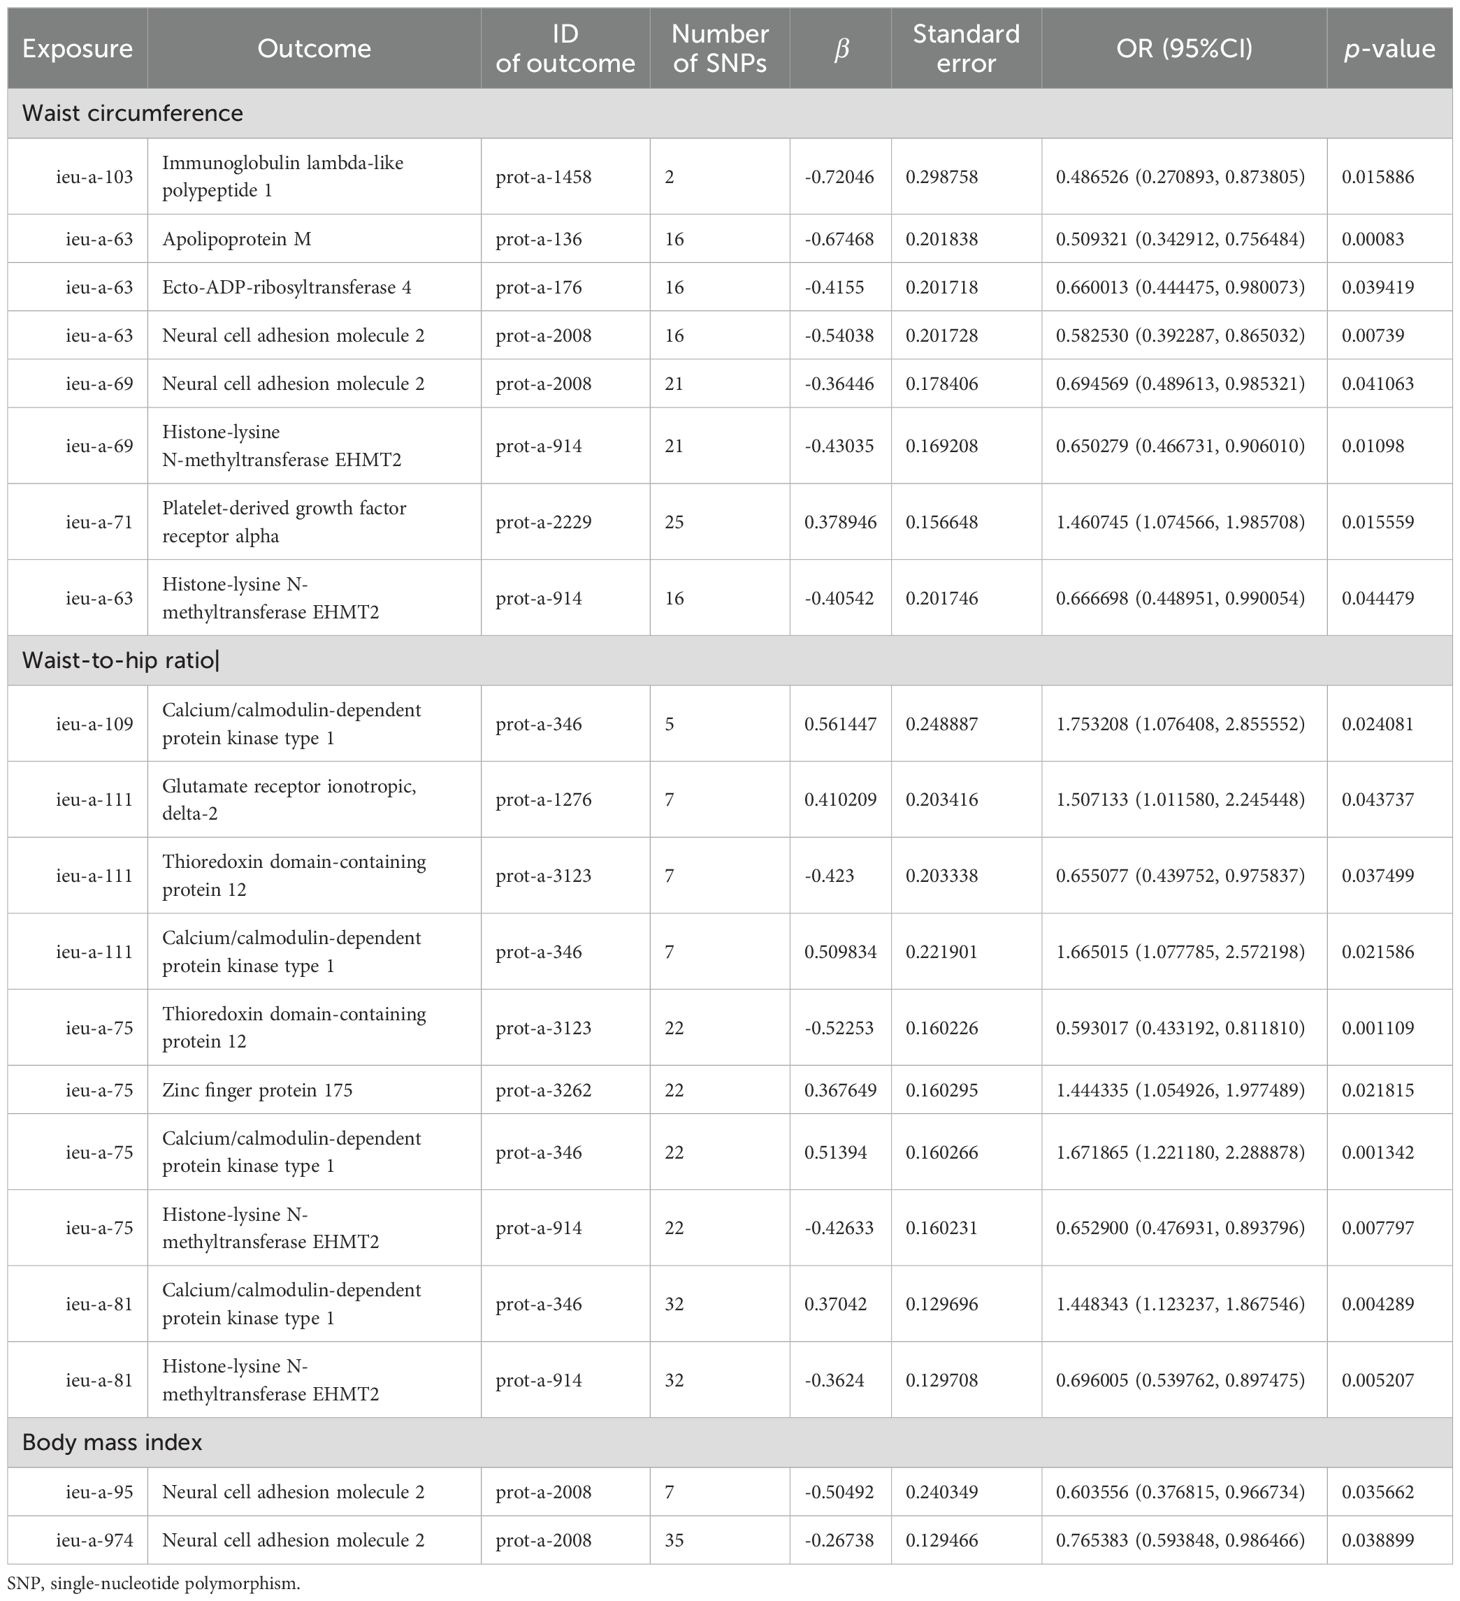
Table 5. MR causal effect estimation of obesity-related indicators and plasma proteins.
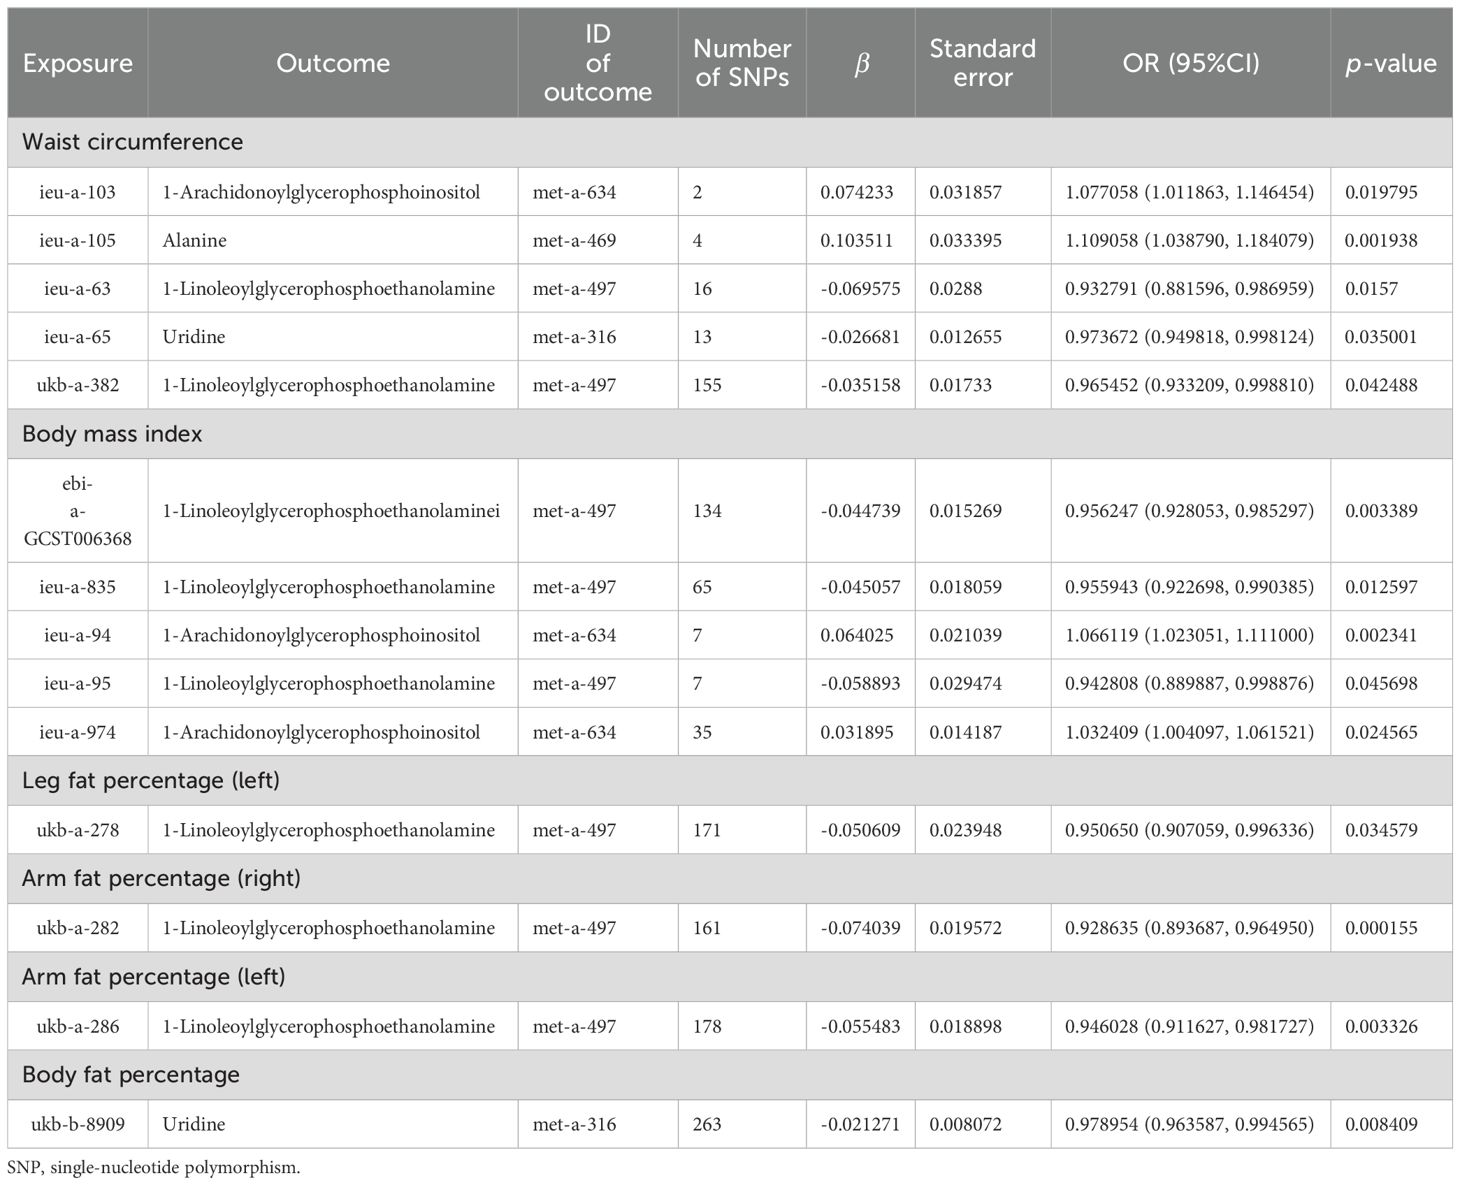
Table 6. MR causal effect estimation of obesity-related indicators and blood metabolites.
Taking these significant results as exposure, we conducted a separate MVMR analysis for osteoporosis, excluding the combinations that could not be used for MVMR analysis. We obtained 20 significant MVMR models for the effect of plasma protein-mediated obesity-related indicators on osteoporosis (Table 7). The results show that the relationship between plasma proteins and osteoporosis in model 11 is significant (P < 0.05), while the relationships in the remaining models are not significant (P > 0.05). For the effect of blood-metabolite-mediated obesity-related indicators on osteoporosis, we identified 14 meaningful MVMR models (Table 8). The results show that the relationship between blood metabolites and osteoporosis in model 23 is significant (P < 0.05), while the relationships in the other models are not significant (P > 0.05).
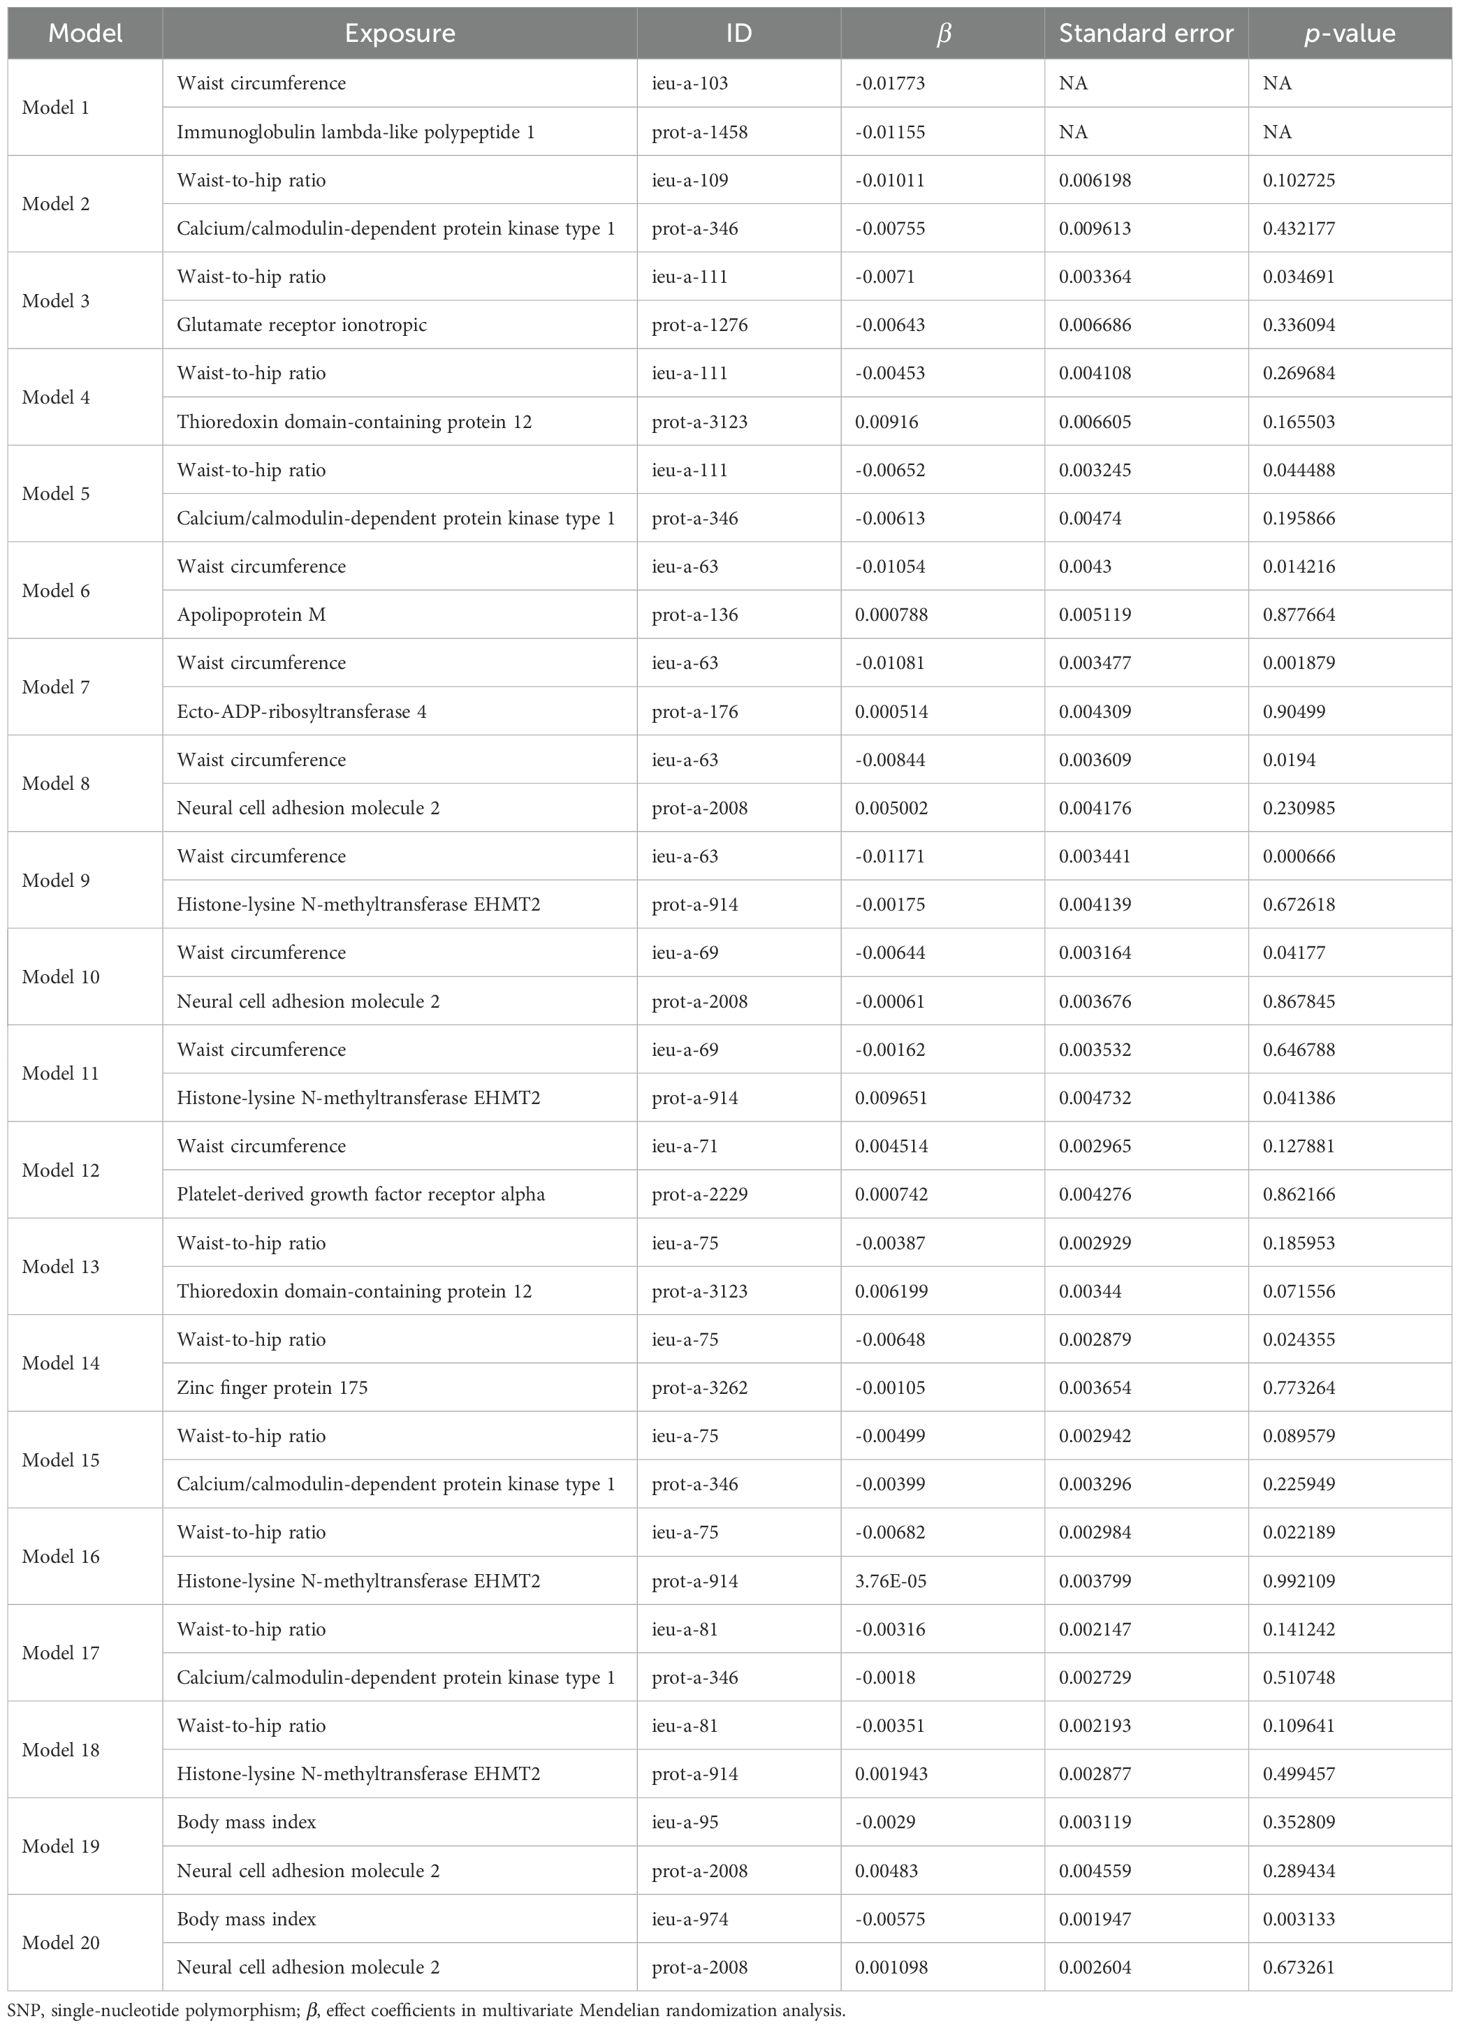
Table 7. Results of MVMR analysis of the effect of plasma proteins and obesity-related indicators on osteoporosis.
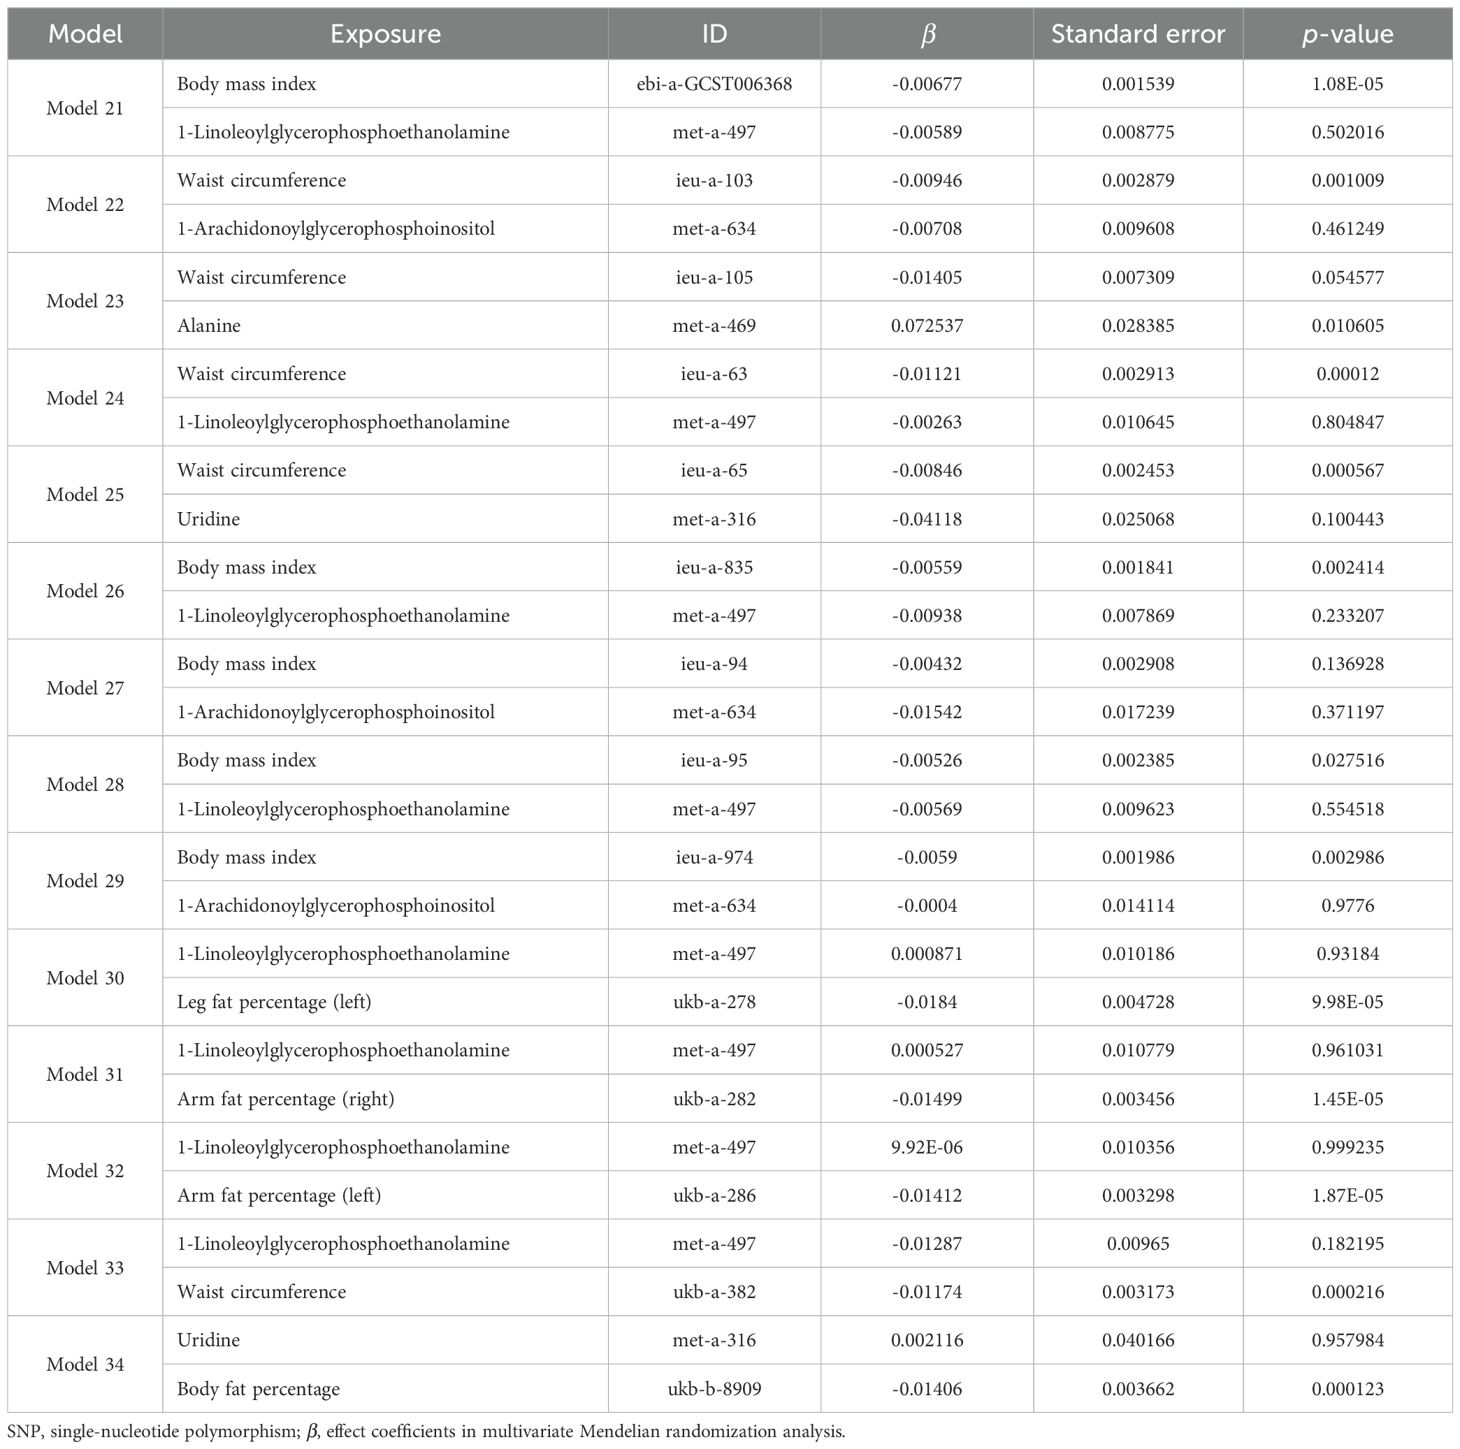
Table 8. Results of MVMR analysis of the effects of blood metabolites and obesity-related indicators on osteoporosis.
3.6 Mediation effect analysisIn the MVMR analysis, models demonstrating a significant causal relationship between mediating factors and outcomes were evaluated for mediating effects. The Sobel test was employed to determine whether the mediating effects were significant for the remaining models, and the mediating effects were evaluated for those models that showed significance. Among the effect models of obesity-related indicators mediated by plasma proteins on osteoporosis, only model 11 showed significant effects between plasma protein and osteoporosis (P < 0.05), while the Sobel test results (Supplementary Table S24) indicated no significant mediating effects in the remaining models (P < 0.05). Therefore, we only discuss the possible mediating effects in model 11. Since there was no significant causal relationship between obesity-related indicators and osteoporosis in model 11 (P < 0.05), model 11 might represent a case of complete mediation, and the results are shown in Table 9. Among the effect models of obesity-related indicators mediated by blood metabolites on osteoporosis, only model 23 showed significant effects between blood metabolites and osteoporosis (P < 0.05), while the Sobel test results (Supplementary Table S25) show no significant mediating effects in the remaining models (P < 0.05). Therefore, we only discuss the possible mediating effects in model 23. Given the absence of a causal relationship between obesity-related indicators and osteoporosis in model 23 (P < 0.05), model 23 may represent a case of complete mediation, and the results are shown in Table 9.
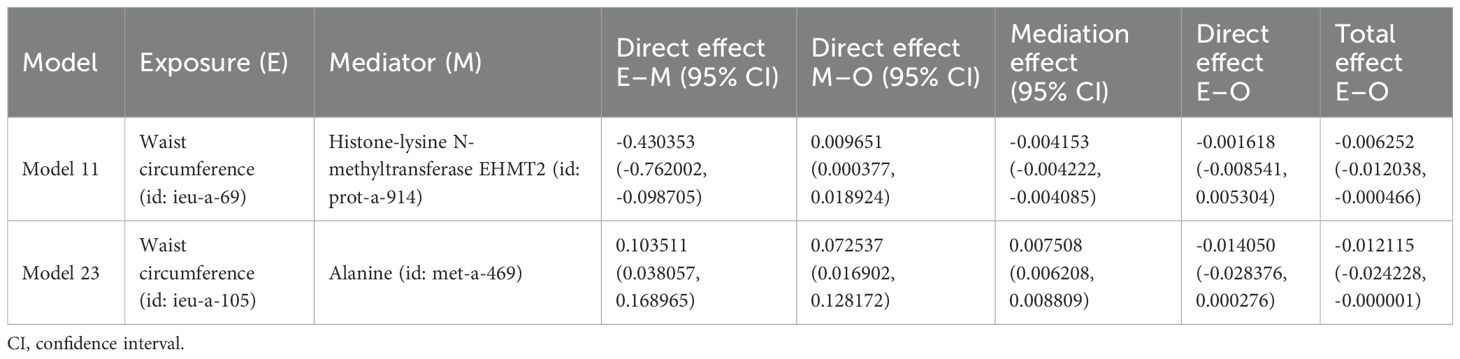
Table 9. Effect of plasma proteins and blood metabolites mediating obesity-related indicators on osteoporosis through MR.
4 DiscussionIt is reported that osteoporosis has become a major global health problem. Historically, obesity was considered protective against osteoporosis (30). Recently, the study of biomarkers related to osteoporosis in proteomics and metabolomics has attracted many researchers (31, 32). We performed the first comprehensive two-sample MR analysis to evaluate the causal relationships and potential mediating factors between obesity-related indicators and osteoporosis. The results indicate that 31 obesity-related indicators may have a causal relationship with osteoporosis. Most of the obesity-related indicators, including BMI, waist circumference, waist-to-hip ratio, fat percentage, arm fat percentage, and body fat percentage, may reduce the risk of osteoporosis. There may be a causal relationship between 25 plasma protein markers and osteoporosis, among which serine/threonine-protein kinase pim-1, ATP1B1, ZFP175, and chordin-like protein 2 may significantly increase the risk of osteoporosis, while ANKED46, KLRF1, LPO, and CA9 may significantly reduce the risk of osteoporosis. There may be a causal relationship between seven blood metabolite markers and osteoporosis. Alanine may increase the risk of osteoporosis, while uridine and 1-linoleoylglycerophosphoethanolamine may lower the risk of osteoporosis. The causal relationship between obesity-related indexes, plasma protein, blood metabolites, and osteoporosis was confirmed. In the sensitivity analysis, the heterogeneity of obesity-related indicators, plasma proteins, and blood metabolites was not significant and was not affected by horizontal pleiotropy, indicating stability. In the MVMR analysis, the reduced risk of osteoporosis caused by obesity-related indicators may be mediated by EHMT2 among plasma proteins and alanine among blood metabolites.
Previous studies have shown that obesity could prevent osteoporosis (33). It is reported that a low BMI is considered as an important risk factor for osteoporosis (34, 35). A cross-sectional study involving 3,774 men over 50 and 4,982 postmenopausal women found that when BMI increased by 1 kg/m2, men and women reduced their risk of osteoporosis by 28% and 13%, respectively (36). In our MR study, the genetic prediction of BMI is closely related to osteoporosis. The increase in BMI could reduce the risk of osteoporosis, which is consistent with the results of previous studies. Our research shows that waist circumference (id: ieu-a-
留言 (0)