
記住我
Clear cell renal cell carcinoma (ccRCC) constitutes approximately 70%–80% of renal cell carcinoma (RCC) and has the highest morbidity among kidney malignant neoplasms. It has a poor prognosis in advanced stages and is insensitive to conventional radiotherapy and chemotherapy (Li M. et al., 2023; Choueiri et al., 2020; Li T. et al., 2023). Although recent advancements in targeted therapies and innovative immunotherapies have significantly transformed the treatment paradigm for advanced ccRCC patients, many patients are unresponsive to therapies (Li et al., 2022; Choueiri et al., 2017), underscoring the necessity for further investigation into the biological characteristics and potential therapeutic biomarkers for ccRCC.
Existing studies have increasingly suggested that ccRCC is a heterogeneous disease, and its prognosis is not only influenced by clinical and pathological factors, but also closely related to immune status within tumor microenvironment (TME) (Lee et al., 2019; Bi et al., 2021). The activation and suppression states of the immune system directly impact patients’ response to immunotherapy (Kumari and Choi, 2022). As a result, developing an immune model that can accurately predict patient prognosis and identifying effective small molecule compounds are vital for formulating precise and individualized treatment strategies for ccRCC patients.
The development of prognostic models relies on comprehensively understanding patient biological features and identifying genes associated with tumor progression (Gogas et al., 2009). The prognosis of malignant tumors is intricately linked to immune responses, which encompass processes such as antigen presentation, phagocytosis, and lymphocyte activation (Phillips et al., 2019). To date, several immune-related prognostic models for ccRCC have been established. For instance, one study reveals novel features derived from macrophage marker genes through single-cell transcriptome data analysis, and identifies IFI30, FUCA1, TIMP1, NAT8, and SMIM24 as the potential prognostic biomarkers (Chen et al., 2024). Moreover, investigations into lactate-related genes demonstrate that models constructed based on these genes significantly contribute to evaluating the prognosis and immune response in ccRCC (Sun et al., 2022). These multifactorial prognostic models, which incorporate various risk-related genes, can accurately predict the patient overall survival (OS) and progression-free survival (PFS).
Screening small molecule compounds can offer promising avenues for the treatment of ccRCC. Small molecule inhibitors targeting immune checkpoints (ICIs), such as LAG-3 inhibitors (specifically SA-15-P), identified through focused screening and the “SAR by catalog” approach, can block LAG-3/MHCII and LAG-3/FGL1 interactions. This mechanism assists T cells in regaining cytotoxicity while diminishing the immunosuppressive effect of regulatory T cells (Tregs), thereby highlighting their potential for clinical translation in immunotherapy for multi-organ solid tumors (Abdel-Rahman et al., 2023). Comparable investigations also encompass STING agonists identified via high-throughput screening, including Benzothiazine-6-carboxamide (Sali et al., 2015), which holds promising prospects for immunotherapeutic applications.
Network pharmacology integrates systems biology, network science and bioinformatics analysis to analyze drug-target molecular interactions at a systemic level. This approach systematically elucidates the drug action mechanisms, identifies novel drug targets, and optimizes drug design (Liu et al., 2021). Molecular docking technology is the pivotal tool used in computer-aided drug design (CADD), which is critical for forecasting interaction patterns and affinities between drug molecules and their targets (Bell and Zhang, 2019). Collectively, these methodologies establish the fundamental framework for applying small molecule compounds in anti-cancer therapy.
Therefore, based on this rationale, in this study, we used ccRCC data from The Cancer Genome Atlas (TCGA) and Gene Expression Omnibus (GEO) datasets to construct an 8-gene immune prognostic model for assessing ccRCC prognosis. Additionally, Connectivity map (CMap) database-based drug screening was conducted in conjunction with network pharmacology as well as in vivo and in vitro experimental validation to elucidate the anti-cancer efficacy of a novel small molecule compound. Figure 1 illustrates the key aspects and workflow of this study.
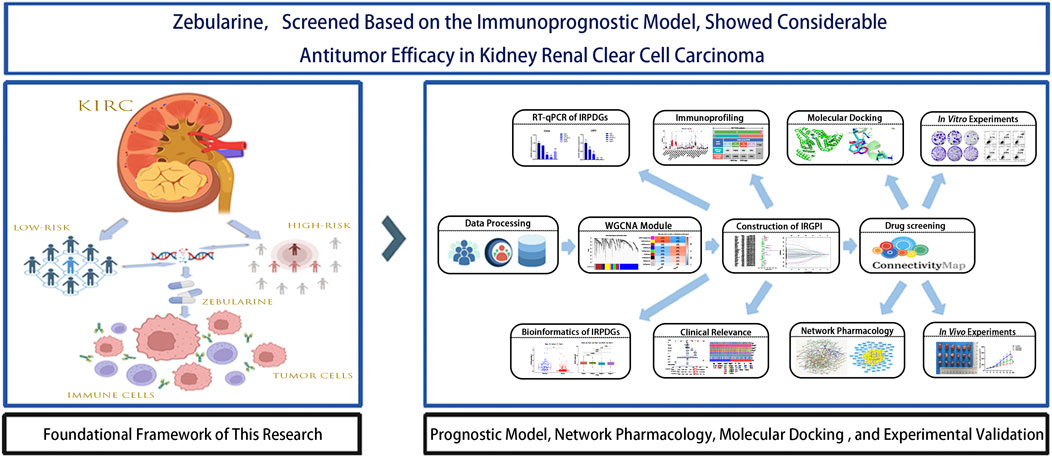
Figure 1. Flowchart of data collection and study design.
2 Methods2.1 Raw datasets acquisitionThe gene expression profiles and clinical data of ccRCC were downloaded from the TCGA database (https://portal.gdc.cancer.gov/, July 2024) (Stephen et al., 2014), which consist of 72 normal samples and 542 tumor samples. After excluding duplicate samples, we adopted a total of 537 ccRCC samples. Among them, 70% were randomized as the model training set, while the remaining 30% were combined with the GSE29609 dataset (consisting of 39 tumor samples with recorded survival times) from the GEO database (https://www.ncbi.nlm.nih.gov/geo/, July 2024) (Edgar and Barrett, 2006) as the test set to validate the model predictive ability. Following quality control, all datasets were standardized to ensure that the expression values were converted to comparable levels for further analysis. The detailed baseline clinical pathological data of patients with ccRCC are summarized in Table 1. Totally 3179 immune-related genes (IRGs) were obtained, including 1793 in ImmPort (https://www.immport.org/) (Bhattacharya et al., 2018) and 1698 in InnateDB (https://www.innateDB.com/) (Lynn et al., 2008) databases.

Table 1. Clinicopathological Characteristics of ccRCC Patients Examined in This Study.
2.2 Immune-related core module genes identificationFor identifying differentially expressed genes (DEGs) in ccRCC tumor versus non-carcinoma samples, “limma” package of R software 4.4.1 was employed for screening DEGs from a training set comprising 376 ccRCC samples and 72 non-carcinoma samples upon the thresholds of P < 0.05 and |log2FC| > 1. Subsequently, these DEGs were intersected with IRGs downloaded to obtain immune-related differentially expressed genes (IRDEGs). Thereafter, key module genes were extracted from the IRDEGs by weighted gene co-expression network analysis (WGCNA) (Xu et al., 2022). Specifically, through Pearson test, sample cluster analysis was conducted according to the correlation coefficients between two genes. Later, an unsigned co-expression network was constructed in line with optimum soft-thresholding power β. The co-expression similarity was calculated, later, the similarity matrix was transformed to the weighted adjacency matrix. Afterwards, this adjacency matrix was further transformed to the Topological Overlap Matrix (TOM) for detecting network gene connectivity. Furthermore, genes with a distance of 1-TOM were clustered to construct different visual gene modules, and finally, genes from the significantly correlated modules were chosen in subsequent analyses.
2.3 Development and verification of the immune-related gene prognostic index (IRGPI)To identify the OS-related independent and significant prognostic genes, univariate Cox (uni-COX) regression was performed. To mitigate model complexity and multicollinearity, Least Absolute Shrinkage and Selection Operator (LASSO) regression (McEligot et al., 2020) was carried out with R package “glmnet” and multivariate Cox (multi-Cox) regression for constructing an optimal immune-related prognostic differential genes (IRPDGs) model. Afterwards, risk score (RS) was determined through linearly combining gene expression and corresponding weighted regression coefficients obtained from multi-Cox regression. To be specific, the RS was computed below:
RS=∑n=18Expressiongenen×coefficientgenenAll samples were classified as high- or low-risk group according to median RS. At last, Kaplan-Meier survival and risk assessment were conducted on both training and test sets. Additionally, receiver operating characteristic (ROC) curves were plotted with “timeROC” package, with area under the curve (AUC) values being calculated to comprehensively assess and validate the predictive capability of IRGPI (Bilar et al., 2021).
In the training set, Chi-square test was employed for examining the relationship of prognosis with clinicopathological parameters (including age, gender, tumor stage, and grade). Additionally, RS and clinicopathological parameters were used for nomogram construction using “regplot” and “rms” packages. Thereafter, uni-Cox and multi-Cox regression were completed for assessing the independent predictive capability of IRGPI.
2.4 Analysis of mutant gene landscapes and immune characteristicsMutation data were downloaded from the TCGA database and divided as high- or low-risk subgroup. The “maftools” package was employed for analyzing somatic mutations of each sample. Tumor mutation burden (TMB), survival analysis, and waterfall plots were utilized for evaluating somatic mutation difference between the two risk subgroups (Jardim et al., 2021). Thereafter, the “org.Hs.eg.db” and “clusterProfiler” packages were employed based on the reference gene set (c2.cp.kegg.v7.4.symbols.gmt) for gene set enrichment analysis (GSEA) of both risk subgroups (Zohair et al., 2023).
To explore the difference in immune characteristics, we implemented CIBERSORT analysis (https://CIBERSORT.stanford) for assessing relative proportions of 22 immune-related cells in the two risk subgroups. In addition, “survival” and “survminer” packages were adopted for survival analysis associated with immune cells, while “GSVA” package was utilized for single sample GSEA (ssGSEA) for 29 immune-related functional indicator levels. Furthermore, immune subtype datasets downloaded from TCGA database were utilized to match samples in the risk subgroups, thus assessing different immune subtypes in both risk subgroups, while TME-related scores were derived using the “estimate” package (Li H. et al., 2023). At last, the prognostic relevance of risk subgroups to immunotherapy and immune evasion was investigated by examining the difference in microsatellite instability (MSI), tumor immune dysfunction and exclusion (TIDE) score (https://tide.dfci.harvard.edu/), T-cell exclusion effects, and T-cell dysfunction (Qin et al., 2023).
2.5 Drug sensitivity analysis and small molecule drugs screeningFor analyzing the ccRCC sensitivity to the common anti-cancer drugs, we utilized “pRRophetic” package for exploring sensitivity difference in both risk groups (Shi et al., 2023). Next, based on IRGPI subgroup classification, “limma” package was adopted for identifying model IRDEGs (mIRDEGs) from 188 high-risk and 188 low-risk samples (P < 0.05, |log2FC| > 0.5). Subsequently, 101 downregulated and 80 upregulated genes were uploaded to CMap database (https://clue.io) to identify potential therapeutic compounds (Subramanian et al., 2017). The screening results included negative changes in gene expression profiles of multiple cell lines, which were caused by 31,128 small molecule compounds, and the compound with the lowest negative score was selected as the candidate drug for high-risk ccRCC patients.
2.6 Acquisition of drug and disease targetsBriefly, the unique predicted targets for Zebularine (Zeb) were obtained from The Comparative Toxicogenomics Database (CTD, http://ctdbase.org/), STITCH 5.0 (http://stitch.embl.de/), DrugBank 6.0 (https://go.drugbank.com/), PharmMapper (http://www.lilab-ecust.cn/pharmmapper/), and SwissTargetPrediction (http://www.swisstargetprediction.ch/) databases (Davis et al., 2023; Szklarczyk et al., 2016; Knox et al., 2024; Wang et al., 2017; Daina et al., 2019). Besides, the DrugBank (https://go.drugbank.com/), GeneCards (https://www.genecards.org/), OMIM (https://www.OMIM.org/), and PharmGkb (https://www.pharmgkb.org/) databases (Shalar et al., 2005; Filatova et al., 2023; Altman, 2007) were searched with the keyword “clear cell renal cell carcinoma” to identify disease-related targets. Then, UniProt ID was transformed into Gene Symbol using UniProt database (https://www.uniprot.org/uploadlists/) (Apeweiler et al., 2004), the drug and disease targets were intersected after duplicates were removed, and the Venn diagrams were visualized utilizing the “venn” package.
2.7 Construction of the protein-protein interaction (PPI) network for core hub genes and pathway enrichment analysisTo identify overlapping targets, The intersection of DEGs (P < 0.05, |log2FC| > 1)from the TCGA-KIRC cohort with the established drug targets and disease genes were determined, and the results were visualized with a Venn diagram. Then, these target genes were imported into the Search Tool for the Retrieval of Interacting Genes/Proteins (STRING) database (https://cn.string-db.org/), whereas Cytoscape 3.10.2 software (https://www.cytoscape.org/) was applied in constructing the PPI network diagram (Szklarczyk et al., 2023). By using the CytoNCA plugin, the betweenness centrality (BC), closeness centrality (CC), degree centrality (DC), eigenvector centrality (EC), local average connectivity (LAC), and network centrality (NC) were calculated. Only genes with scores exceeding the median value across each metric column through two iterations of this process were retained as the core hub genes. Ultimately, Gene Ontology (GO) as well as Kyoto Encyclopedia of Genes and Genomes (KEGG) analysis was carried out for visualizing corresponding results of the core hub genes.
2.8 Vina molecular dockingFor assessing binding energies of Zeb to its core hub targets and elucidate its interaction profile, two-dimensional (2D) Zeb structure was retrieved based on PubChem database (https://pubchem.ncbi.nlm.nih.gov/) before optimization with Chem3D (https://www.3dchem.com/) to obtain a three-dimensional (3D) conformation. In addition, the receptor crystal structure was sourced based on RCSB Protein Data Bank (PDB, https://www.rcsb.org/), while PyMOL 3.0 software (https://www.pymol.org/) was utilized to remove water molecules and extraneous ligands out of this structure. Molecular docking studies were then conducted utilizing AutoDock Tools 1.5.6 (http://autodock.scripps.edu/) and AutoDock Vina 1.1.2 (https://vina.scripps.edu/), and docking energy results were visualized. Furthermore, the key ligand-receptor interactions, including hydrogen bonds, hydrophobic interactions, and π-π stacking, were characterized using Protein-ligand Interaction Profiler (PLIP) database (http://plip-tool.biotec.tu-dresden.de/plip-web/plip/index/), followed by visualization with PyMOL (Ruan et al., 2023).
2.9 Comprehensive multi-faceted validation of the IRPDGsWe conducted an analysis on the expression difference of IRPDGs between tumor tissues and adjacent non-tumor tissues, utilizing the mRNA expression profile and clinically relevant data from TCGA-KIRC, employing the 'limma' package in R software. Additionally, we generated box plots using the “ggplot2” and “ggpubr” packages. The correlation between IRPDGs and clinical pathological factors was assessed through the “limma” package in R software. Subsequently, we retrieved immunohistochemistry (IHC) results for IRPDGs in normal versus tumor tissues from the Human Protein Atlas (HPA, https://www.proteinatlas.org/). Finally, we investigated the expression of IRPDGs across various cell clusters within single-cell datasets GSE111360, GSE139555, GSE121636, GSE159115 and GSE171306 sourced from the TISCH database (https://tisch.comp-genomics.org/).
2.10 Cell cultureThe ccRCC cell lines 786-O, OS-RC-2, A498, 769-P and the human normal renal tubular epithelial cell line HK2 were maintained in the complete medium (90% RPMI-1640, 10% fetal bovine serum (FBS), and 1% penicillin-streptomycin), and inoculated into culture dishes or flasks for incubation under 37°C with 5% CO₂, with medium change at 2–3-day intervals. After reaching around 80%–90% of confluency, cells were digested using 0.25% trypsin and passaged or harvested for further experiments as per the experimental requirements.
2.11 RNA extraction and real-time quantitative polymerase chain reaction (RT-qPCR)Total RNA was extracted from ccRCC cell lines 786-O, OS-RC-2, A498, 769-P, and the normal cell line HK2 using TRIzol reagent (Takara, Shiga, Japan). Complementary DNA (cDNA) synthesis was performed with the ABScript Neo Master Mix for qPCR with gDNA Remover (Abclone, Wuhan, China). Following the manufacturer’s instructions, RT-qPCR was conducted utilizing the 2X Universal SYBR Green Fast qPCR Mix kit (Abclone) along with specific primers designed for model genes. The relative expression of RNA was analyzed using the LightCycler®480 real-time fluorescence quantitative PCR system (Roche, Basel, Switzerland). All primer sequences were obtained from Tsingke Biotechnology Co., Ltd. (Beijing, China), with GAPDH being an internal reference gene. Primer sequences are provided in Supplementary Table.
2.12 3-(4, 5-dimethyl-2-thizolyl)-2, 5 diphenyltetrazolium bromide (MTT) toxicity assayIn brief, 786-O and OS-RC-2 cells (3000/well) were uniformly inoculated into 96-well plates. For evaluating in vitro effects of Zeb (MedChemExpress, NJ, United States) on the viability of ccRCC cell lines, Zeb at varying concentrations (0, 2.5, 5, 10, 20, 40, 80, and 160 μM) was used to treat both cell lines for 24, 48, and 72 h. Afterwards, every well was introduced 10 μL MTT reagent (Beyotime, Shanghai, China), followed by plate incubation for additional 4 h to facilitate formation of deep purple Formazan crystals. Subsequently, to dissolve the deep purple crystals completely, every well was introduced 100 μL Formazan solubilization solution (Beyotime, Shanghai, China). After complete crystal dissolution, absorbance was measured with the microplate reader at 570 nm. Then, cell viability curves and half maximal inhibitory concentration (IC50) were analyzed to illustrate the impact of the drug on cell viability.
2.13 Colony formation assayThe 786-O and OS-RC-2 cells (1000/well) were inoculated into 6-well plates and exposed to Zeb treatment at varying concentrations (20, 50, and 100 μM) for 2 weeks, with medium change every 3 days. Thereafter, phosphate-buffered saline (PBS) was added to wash the colonies before 20 min of fixation using 4% paraformaldehyde (v/v) and additional 30 min of crystal violet (0.1%, w/v, Beyotime, Shanghai, China) staining. Photographs was taken and colony number (>50 cells/colony) was counted with ImageJ software (Wayne Rasband, Bethesda, MD, United States).
2.14 Cell apoptosis assayTo assess whether Zeb induced apoptosis of ccRCC cells, 786-O and OS-RC-2 cells (5 × 10⁵/well) were inoculated into 6-well plates for overnight incubation. Subsequently, Zeb at varying concentrations (20, 50, and 100 μM) was added for 24 h of cell treatment, followed by trypsin digestion to prepare single-cell suspensions. After washing twice with cold PBS, the cells were stained using Annexin V-FITC and propidium iodide (PI). Cell apoptosis was analyzed through Cytoflex flow cytometry (Beckman Coulter, Brea, CA, United States).
2.15 Scratch assayOn reverse side of each well in the 12-well plate, three horizontal lines were delineated as reference markers. Later, the logarithmic-phase 786-O and OS-RC-2 cells were cultivated within the 12-well plate until the cell confluency grew to approximately 80%–90%. Subsequently, three parallel scratches perpendicular to the reference markers were made with the 200 µL pipette tip. Cells were exposed to 24 h of Zeb treatment at 20, 50 and 100 µM. The inverted microscope (Nikon, Tokyo, Japan) was employed to capture images of the scratched areas at 0 h (baseline) and 24 h (post-treatment), and relative migration rates were analyzed utilizing ImageJ software (Wayne Rasband).
2.16 Transwell assaysTo perform the Transwell assays, we inoculated 786-O and OS-RC-2 cells (5 × 10⁴/well, 200 µL) in the upper chambers (pore size: 8 μm; Biofil, Guangzhou, China) pre-coated or uncoated with Matrigel (Beyotime, Shanghai, China), using serum-free RPMI-1640 medium. To facilitate chemotaxis, 10% FBS was added into the lower chambers as a chemical attractant to draw cells through the membrane. At 24 h post-incubation, a wet cotton swab was used to gently remove non-invading cells on the upper surface. While invading cells on the bottom side were subjected to 20 min of 4% paraformaldehyde fixation and 30 min of crystal violet solution (0.1%, w/v) staining. Upright microscopic examination (Olympus, Tokyo, Japan) was then conducted to capture images, while ImageJ software (Wayne Rasband) was employed for quantifying invading cell number within every field.
2.17 Western blotPhenylmethylsulfonyl fluoride (PMSF, Servicebio, Wuhan, China) was added to RIPA lysis buffer (Servicebio) at a ratio of 1:100 for the lysis of both cells and tumor tissues. Protein concentrations were determined using a standard quantification method. Subsequently, proteins were separated by sodium dodecyl sulfate polyacrylamide gel electrophoresis (SDS-PAGE) and transferred onto polyvinylidene fluoride (PVDF) membranes (Servicebio). Membranes were blocked with 5% non-fat milk in Tris-buffered saline with Tween 20 (TBST) for 1 h at room temperature. Primary antibodies against Akt (1:1000; Abmart, T55561S, Shanghai, China), phosphorylated-Akt (p-Akt; 1:1000; Abmart, TA0016S, Shanghai, China), PI3K (1:1000; Affinity, AF6242, Changzhou, China), phosphorylated-PI3K (p-PI3K; 1:1000; UpingBio, YP-Ab-17845, Hangzhou, China) and β-actin (1:5000; Protaintech, 81115-1-RR, Wuhan, China) were incubated overnight at 4°C according to the manufacturer’s instructions. Following this, membranes were incubated with horseradish peroxidase (HRP)-conjugated secondary antibodies (1:5000; Servicebio, GB23303) for 30 min at room temperature. Protein bands were visualized using a ChemiScope S6 chemiluminescence imager (Clinx, Shanghai, China). The intensity of the relevant bands was quantified using ImageJ software (Wayne Rasband).
2.18 Xenograft modelsThe six-week-old female BALB/c nude mice were obtained from Changzhou Cavensis Experimental Animal Co., Ltd. (Changzhou, Jiangsu, China). All procedures involving animals were approved by the Institutional Animal Care and Use Committee of Chongqing Medical University (IACUC-CQMU), and approval number is IACUC-CQMU-2024-0664. The OS-RC-2 cell line xenograft model was employed to assess the efficacy of Zeb in inhibiting ccRCC growth. Briefly, OS-RC-2 cells were subcutaneously injected into the right dorsal flank of BALB/c nude mice at a concentration of 2.5 × 10⁶ cells per 100 µL PBS. Once tumor volumes reached 50 mm³, the mice were stratified into three groups, each consisting of six animals. Mice in the experimental groups received oral administration of Zeb at doses of 250 mg/kg and 500 mg/kg every other day, while those in the control group were treated with PBS. Upon reaching predetermined tumor sizes, mice were euthanized; tumors were excised, photographed, measured, weighed, and recorded. The tumor volume (V) was calculated using the following formula: V (mm3) = 0.5 × length × width × width. The heart, liver, lung, spleen, kidney tissues along with tumors were fixed in 4% paraformaldehyde and subsequently embedded in paraffin for further analysis including hematoxylin-eosin (H&E) staining (ZSGB-BIO, Beijing, China), Ki67 immunohistochemistry (HUABIO, Hangzhou, China) and TUNEL fluorescence assay (Beyotime, Shanghai, China). Finally, we conducted a toxicity evaluation of Zeb in relation to commonly used first-line agents for metastatic ccRCC utilizing the ProTox database (https://tox.charite.de/).
2.19 Statistical analysisThis study completed statistical analysis with GraphPad Prism 10.3 (Inc., CA, United States). Data were represented as mean ± standard deviation (SD). Among-group differences were compared by one-way or two-way analysis of variance (ANOVA). P < 0.05 stood for statistical significance.
3 Results3.1 Core immune-related gene identificationDEGs related to ccRCC were extracted from the training set and intersected with IRGs identified by ImmPort and InnateDB, as a result, altogether 1,065 IRDEGs were identified (Supplementary Figure S1A). Upon GO annotation, the circular diagram is presented in Figures 2A, 10 most significantly enriched pathways in biological processes (BP), cellular components (CC), and molecular functions (MF) are delineated in Figure 2B (P < 0.001). Meanwhile, the gene-pathway interaction network (Figure 2C) and 30 most significantly enriched pathways were acquired from KEGG analysis (P < 0.001; Figure 2D). Subsequently, WGCNA was employed to cluster the IRGEGs based on sample data. By using a scale-free topology model, an optimal soft threshold of 3 was determined for this study, corresponding to a correlation coefficient of 0.9 (Figure 2E). Genes were later clustered according to their distance matrix, allowing for dynamic identification of neighboring genes and module formation. Modules with high similarity were merged, therefore, IRDEGs were assigned into nine distinct modules, as shown in Figures 2F, G. Ultimately, the yellow module that exhibited the most significant association with tumor status was identified based on P-value (P = 4e−93), and altogether 142 core immune-related genes were obtained for further investigation.
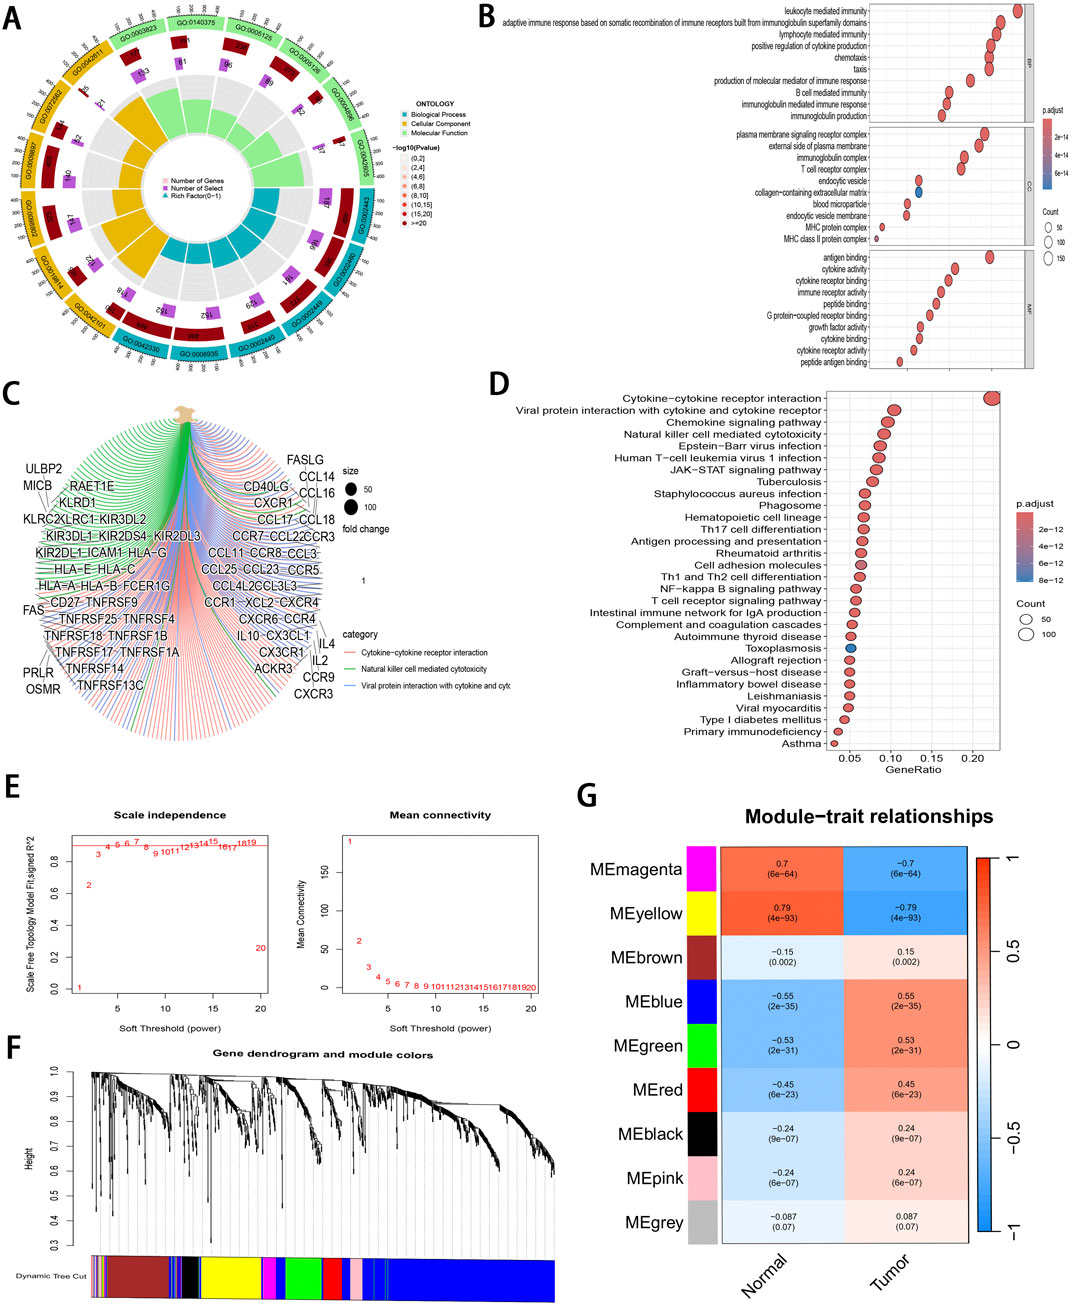
Figure 2. Pathway enrichment analysis and WGCNA of IRDEGs. (A) A circle diagram of GO annotation. (B) Top 10 terms in BP, CC, and MF categories of GO annotation of IRDEGs in training set. (C) A gene-pathway interaction network diagram based on KEGG analysis. (D) Top 30 pathways identified by KEGG analysis of IRDEGs in training set. (E) Scale independence and mean connectivity metrics for IRDEGs in training set. (F) A dendrogram illustrating gene clustering for IRDEGs in training set. (G) Merged modules and correlation analyses obtained from WGCNA for IRDEGs in training set.
3.2 Development and validation of the IRGPI and analysis of its clinical relevanceThrough uni-Cox regression analysis, 49 IRGs significantly related to ccRCC prognosis were obtained and illustrated using a forest plot (P < 0.05; Figure 3A). Subsequently, LASSO regression (Figures 3B, C) combined with multi-Cox regression confirmed 8 IRPDGs (CLDN4, VAV3, CHGA, GREM1, TEK, USP2, WNT9B, and CTSH) as the core genes of the IRGPI (P < 0.05). The survival analyses of each core gene within the model are presented in Supplementary Figure S1B (P < 0.001), while those for the remaining 41 prognosis-related genes are illustrated in Supplementary Figure S2 (P < 0.01). Figure 3D illustrates the chromosome circle maps of the eight IRPDGs, The Principal Component Analysis (PCA) distribution plot demonstrates that the eight-gene model effectively distinguishes the normal and tumor groups (Figure 3E).The RS was calculated as follows: CLDN4 expression × (−0.204339644182801) + VAV3 expression × (−0.208148784601721) + CHGA expression × (0.293414690410473) + GREM1 expression × (0.27431516170263) + TEK expression × (−0.268132296798697) + USP2 expression × (−0.12985305134718) + WNT9B expression × (−0.3531340919342) + CTSH expression × (−0.202002927826549). Samples were stratified as high- or low-risk subgroup according to the median RS, The low-risk subgroup showed significantly superior prognosis to high-risk subgroup (P < 0.01; Figures 3F–I). Moreover, as indicated by ROC curves, 1-, 3- and 5-year AUCs were 0.782, 0.736, and 0.750, separately (Figure 3J), demonstrating that the constructed IRGPI model exhibited strong predictive performance. Furthermore, the results from the test set used for validation were consistent with those obtained from the training set (Figures 3K–O).
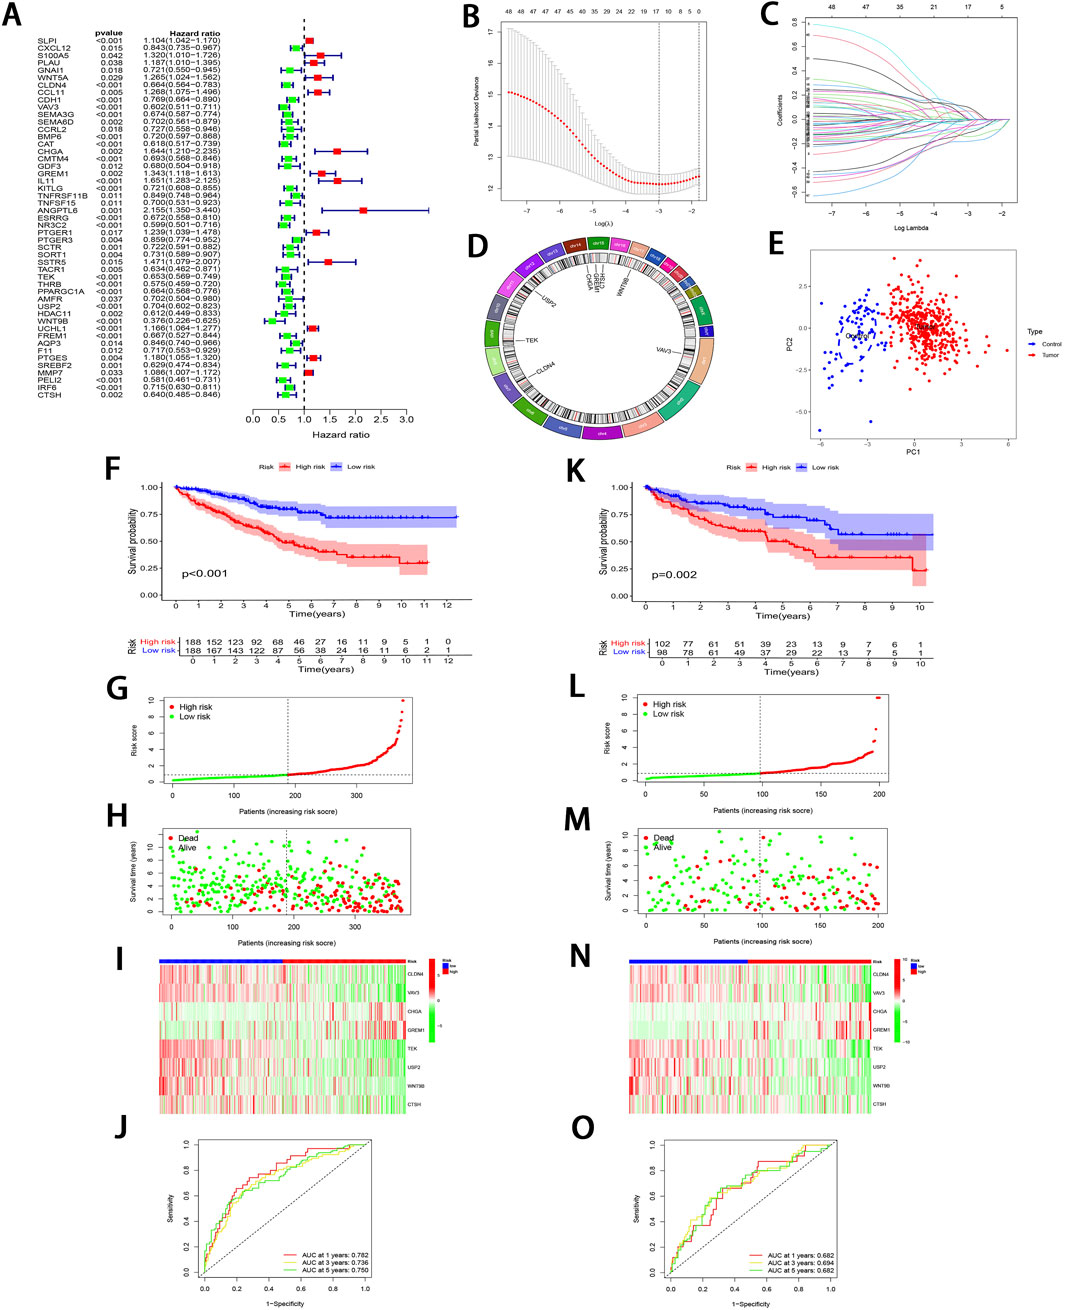
Figure 3. Development and validation of IRGPI. (A) Forest plot illustrating the uni-Cox regression analysis of 49 IRDEGs based on OS. (B) A profile plot showing the coefficients for the logarithmic (λ) sequence. (C) LASSO coefficient profiles for candidate genes among IRDEGs. (D) A chromosomal localization map of the eight IRPDGs. (E) PCA distribution plot in the normal and tumor groups. (F) Comparative analysis of survival curves between two patient subgroups in training set. (G, H) RS and survival status distribution in all samples of training set based on IRGPI. (I) Heatmap showing 8 IRPDGs expression among all samples in training set according to IRGPI. (J) ROC curves representing 1-, 3-, and 5-year OS in training set. (K–O) Model accuracy validated in the test set using methods analogous to those described in (F–J).
To further validate the significant role of IRGPI in ccRCC, Cox regression was carried out for exploring the relationships of prognosis with clinicopathological parameters. Uni-Cox regression identified age, grade, stage, and RS as the high-risk factors for ccRCC prognosis (P < 0.01; Figure 4A). Additionally, multi-Cox regression analysis demonstrated that, compared with other variables, these parameters functioned as the independent prognostic factors (P < 0.01; Figure 4B). From Chi-square tests for clinical correlation analysis, there were significant difference in gender, grade, and stage (including T and M stages) between the two subgroups (P < 0.01; Figures 4C, D). By integrating all parameters, a nomogram that exhibited excellent concordance with the observed OS was developed (Figures 4E, F).
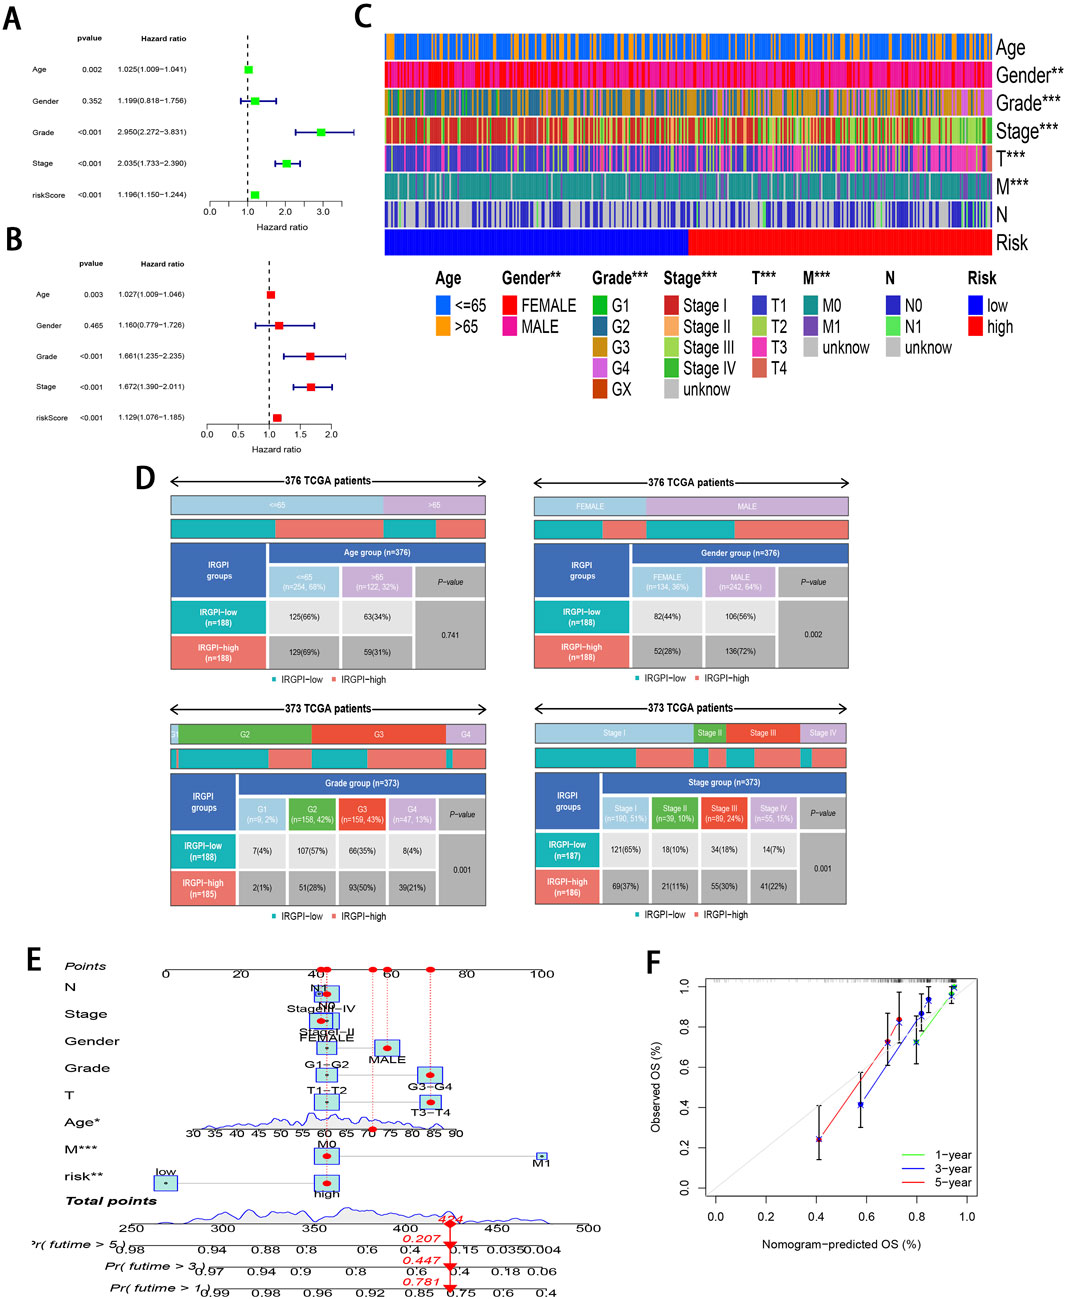
Figure 4. Clinical relevance analysis of subgroups. (A, B) Uni-Cox and multi-Cox regression exploring relationship of clinicopathological factors and RS with OS. (C, D) Heatmap and tabulated representation of the distribution of clinicopathological factors across subgroups. (E) Nomograms for predicting 1-, 3-, and 5-year survival according to clinicopathological factors and RS. (F) Calibration curves comparing the observed OS with predicted survivals at 1, 3, and 5 years.
3.3 GSEA and TMBTo investigate the pathways in the two risk groups, GSEA was carried out. It was found that fatty acid metabolism, PPAR signaling pathway, proximal tubule bicarbonate reclamation, renin angiotensin system, and the degradation of specific amino acids were significantly enriched in the low-risk group (P < 0.001; Figure 5A). On the contrary, pathways associated with complement and coagulation cascades, cytokine receptor interactions, P53 signaling pathway, systemic lupus erythematosus, and vibrio cholerae infection were markedly enriched in the high-risk group (P < 0.05; Figure 5B).
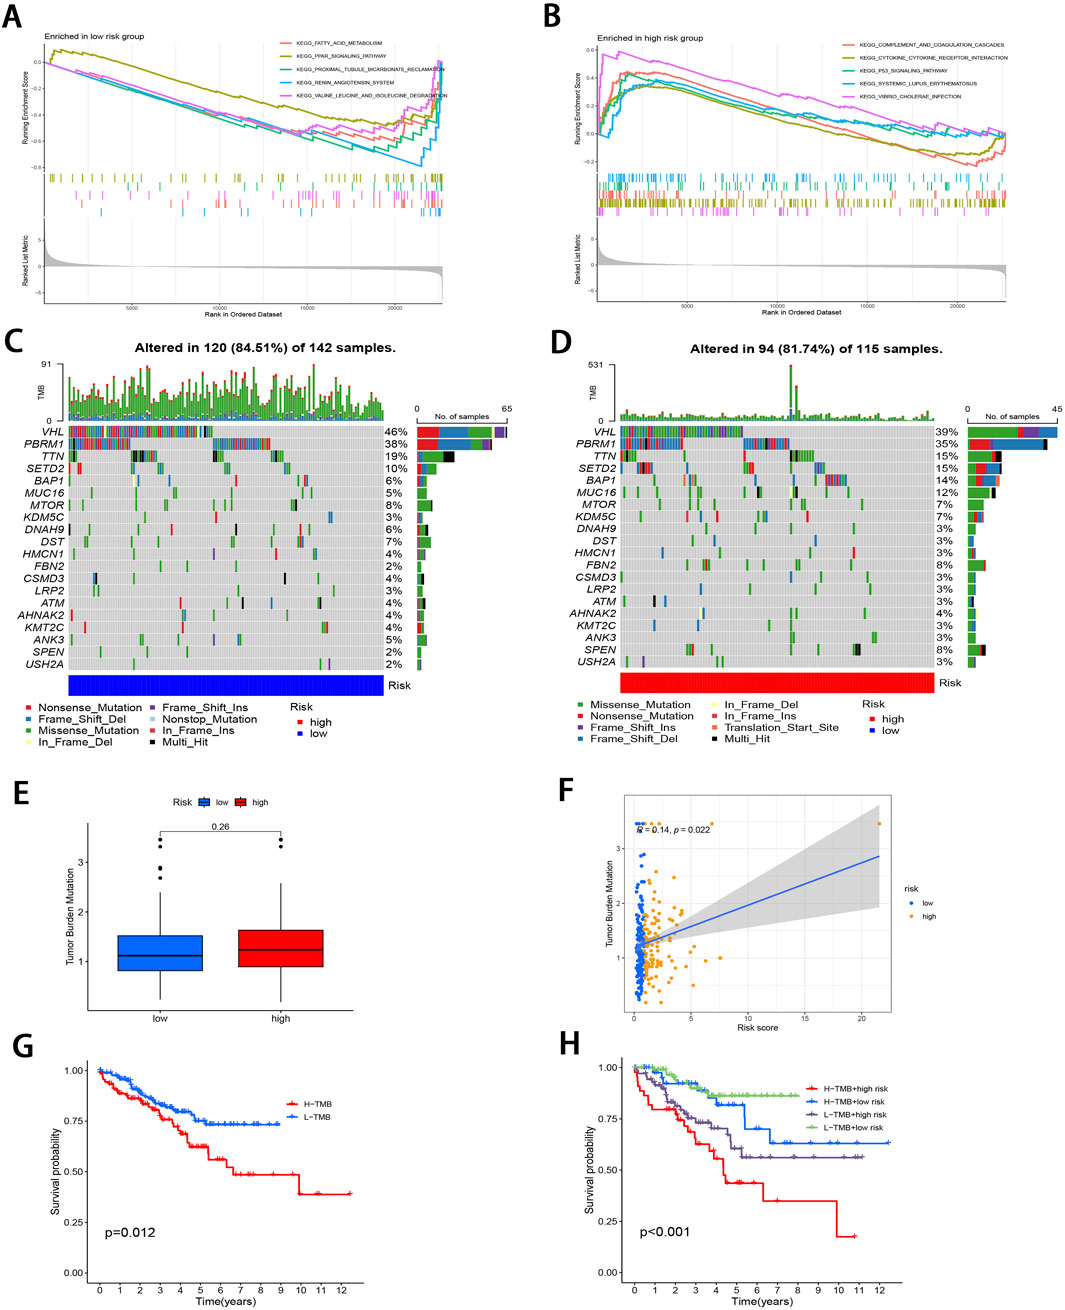
Figure 5. Molecular characterization of subgroups. (A, B) GSEA of two subgroups. (C, D) Mutation landscape plots depicting 20 most highly mutated genes in two subgroups. (E) Comparative analysis of difference in TMB of both subgroups. (F) Correlation distribution between RS and TMB. (G) Survival curves comparing the high- and low-TMB groups. (H) Stratified survival curves for the combinations of RS and TMB.
Subsequently, “maftools” package was utilized to analyze the distribution patterns of those 20 most frequent somatic mutation genes between the two subgroups, which revealed distinct landscape variations (Figures 5C, D). Notably, VHL, PBRM1, TTN, SETD2, and BAP1 emerged as the most frequently mutated genes. TMB, defined as the number of mutated bases per million bases in tumor tissue samples, has surfaced as the candidate prognostic biomarker (Singal et al., 2019). As illustrated in Figure 5E, the TMB level elevated in high-risk subgroup relative to low-risk subgroup, with no significant difference (P = 0.26). However, TMB level was significantly and positively related to RS (r = 0.14; P < 0.05; Figure 5F). To delve deeper into the synergistic prognostic implications of TMB and RS, it was found that the lower TMB level was related to the higher survival probability (P < 0.05; Figure 5G). Moreover, the combination of TMB level and RS demonstrated superior stratified prognosis prediction capability for ccRCC patients (P < 0.001; Figure 5H).
3.4 Immunological profilingThe 22 immune cell proportions were quantified across all samples using CIBERSORT (Figure 6A). It was found that resting CD4 memory T cells, monocytes, M1 macrophages, resting mast cells, and resting dendritic cells were significantly infiltrated in the low-risk group. Conversely, follicular helper T cells, activated CD4 memory T cells, M0 macrophages and regulatory T cells were significantly infiltrated in the high-risk group (P < 0.05), suggesting that ccRCC progression was closely related to these cell types. Furthermore, nearly all factors of significant immune-related functions were markedly expressed in the high-risk group, such as antigen-presenting cell (APC) co-stimulation, activated dendritic cells (aDCs), checkpoint pathways, cytolytic activity, chemokine receptor signaling (CCR), inflammation promotion mechanisms, macrophage activity, para-inflammation processes, T cell co-stimulation dynamics as well as follicular helper T cells, T helper cell 1 (TH1), and T helper cell 2 (TH2) responses alongside tumor-infiltrating lymphocytes (TIL) (P < 0.05; Figure 6B). Survival analysis pertaining to 10 immune cell types is illustrated in Supplementary Figure S3 (P < 0.05). Figure 6C; Supplementary Figure S4 illustrate the relative distribution of various immune cell types with RS across different algorithms (P < 0.05).
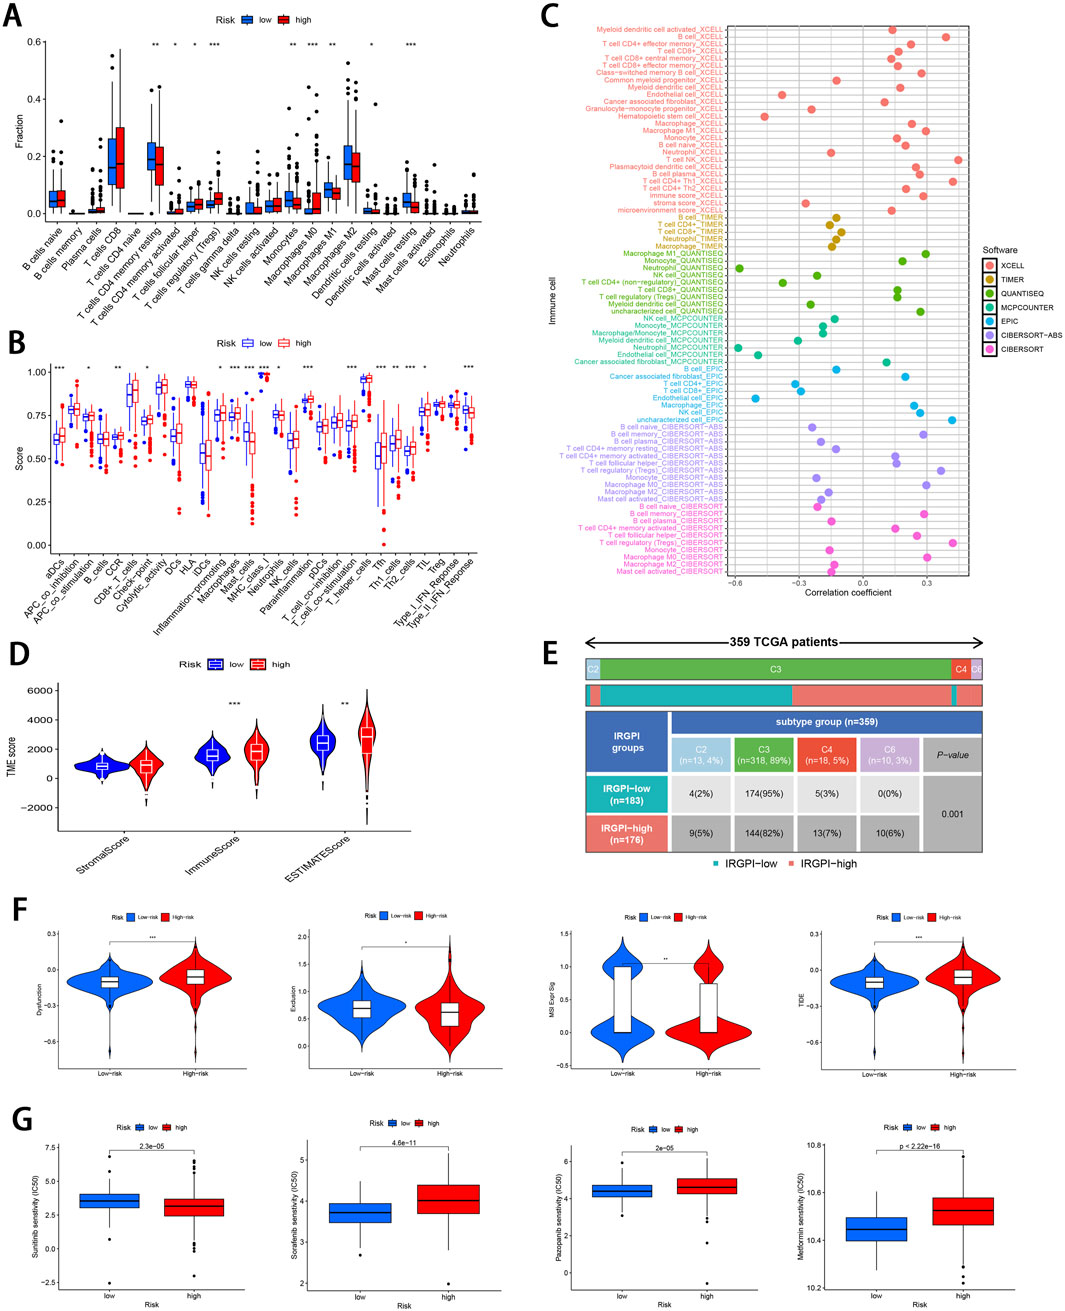
Figure 6. Comprehensive immune cell profiling of different subgroups. (A) Distribution of 22 immune cell types between the two subgroups. (B) Variations in the distribution of 29 immune-related functions between the two subgroups. (C) Correlation distribution between RS and various immune cell types as calculated by different algorithms. (D) Comparative analysis of TME-related indicator scores between the two subgroups. (E) Tabulated distribution of immune subtypes (C2, C3, C4, and C6) in the subgroups. (F) Difference in T-cell dysfunction, exclusion, MSI, and TIDE scores between the two subgroups. (G) Difference in the sensitivity to primary first-line therapies for ccRCC and Metformin between the two subgroups (*p < 0.05, **p < 0.01, ***p < 0.001).
Subsequently, the “estimate” package was employed to calculate stromal/immune/estimate scores within TME of both subgroups. As illustrated in Figure 6D, individuals in the high-risk group showed markedly higher immune scores and estimate scores (P < 0.01), revealing a reduced proportion of tumor cells, and the increased immune cell and immune-related molecule diversity. Previous studies have identified 6 kinds of distinct infiltrating immune cell subtypes in cancer patients that may either promote or inhibit tumor cell proliferation (Tamborero et al., 2018). In this investigation, the C3 subtype (Inflammatory) was predominant in the low-risk group, whereas C2 (IFN-γ dominant), C4 (lymphocyte depleted), and C6 (TGF-β dominant) subtypes were predominantly observed in the high-risk group (P < 0.001; Figure 6E). Moreover, it was observed that the C3 subtype was correlated with favorable prognosis, while C4 and C6 subtypes were linked to poor outcomes (Vesteinn et al., 2018), underscoring the validity of immune subtyping based on the IRGPI.
Finally, the TIDE score was adopted to assess the potential for immune escape. As illustrated in Figure 6F, the high-risk group showed elevated TIDE and Dysfunction scores, signifying the greater propensity for immune evasion and reduced sensitivity to ICIs (P < 0.001). For the low-risk group, MSI and T cell exclusion were the predominant factors (P < 0.05).
3.5 Comparison of drug sensitivity and identifying small molecule compoundsTo evaluate the efficacy of targeted therapies in the two risk subgroups and to identify new therapeutic agents for ccRCC, the sensitivity of first-line therapies for metastatic ccRCC was analyzed between the two subgroups utilizing the “pRRophetic” package. As illustrated in Figure 6G, Sorafenib (P = 4.6e−11) and Pazopanib (P = 2e−5) demonstrated superior treatment sensitivity in the low-risk subgroup, whereas Sunitinib exhibited a contrasting effect (P = 2.3e−5). Notably, the hypoglycemic agent Metformin seemed to show an enhanced efficacy in low-risk patients compared with Sorafinib and Pazopanib (P = 2.22e−16). The potential small molecule compounds that might be beneficial for high-risk individuals were screened by analyzing mIRDEGs (P < 0.05; |log2FC| > 0.5; Supplementary Figures S5A, B) using the CMap platform. The top 10 therapeutic agents are summarized in Table 2. Zeb, with the lowest score among the evaluated therapeutic agents was identified. Zeb is a DNA methyltransferase inhibitor that can induce cell cycle arrest and apoptosis through intrinsic apoptotic pathway by activating BAX and BAK (Ruiz-Magana et al., 2012). There are currently no reports addressing whether Zeb influences the progression of ccRCC. Therefore, the role of Zeb was investigated in the following experiments.
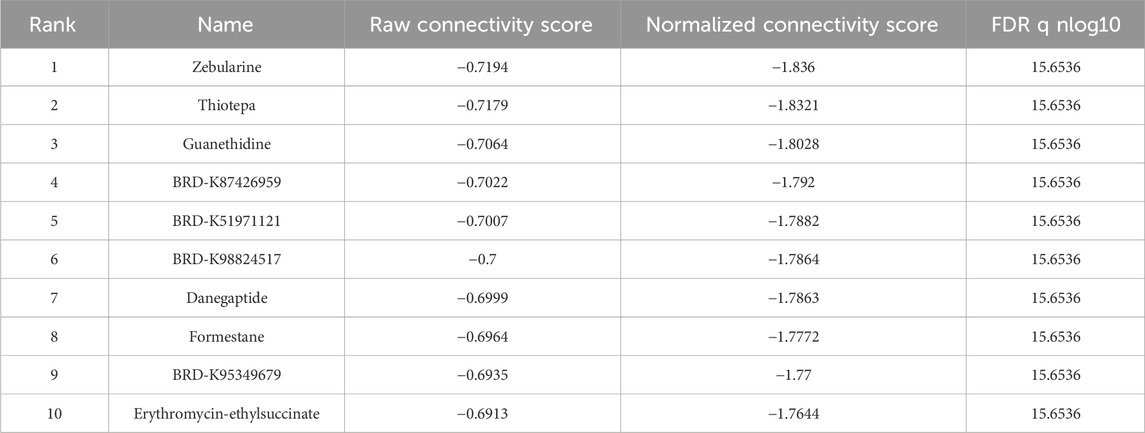
Table 2. CMap platform small molecule compound screening.
3.6 Prediction of core targets of Zeb in ccRCC and establishment of PPI networkZeb’s targets were obtained from the CTD, STITCH 5.0, DrugBank, PharmMapper, and SwissTargetPrediction databases. Thereafter, these targets were converted from UniProt identifiers to standardized gene names and duplicates were removed, resulting in a total of 335 unique targets (Figure 7A). Additionally, 12,069 ccRCC-related targets were also identified based on DrugBank, GeneCards, OMIM, and PharmGkb databases (Figure 7B). By intersecting 12,788 DEGs derived from TCGA database of 537 tumor samples and 72 adjacent samples with both the 355 targets of Zeb and the 12,069 targets of ccRCC, a set of 90 common targets was obtained (Figure 7C).
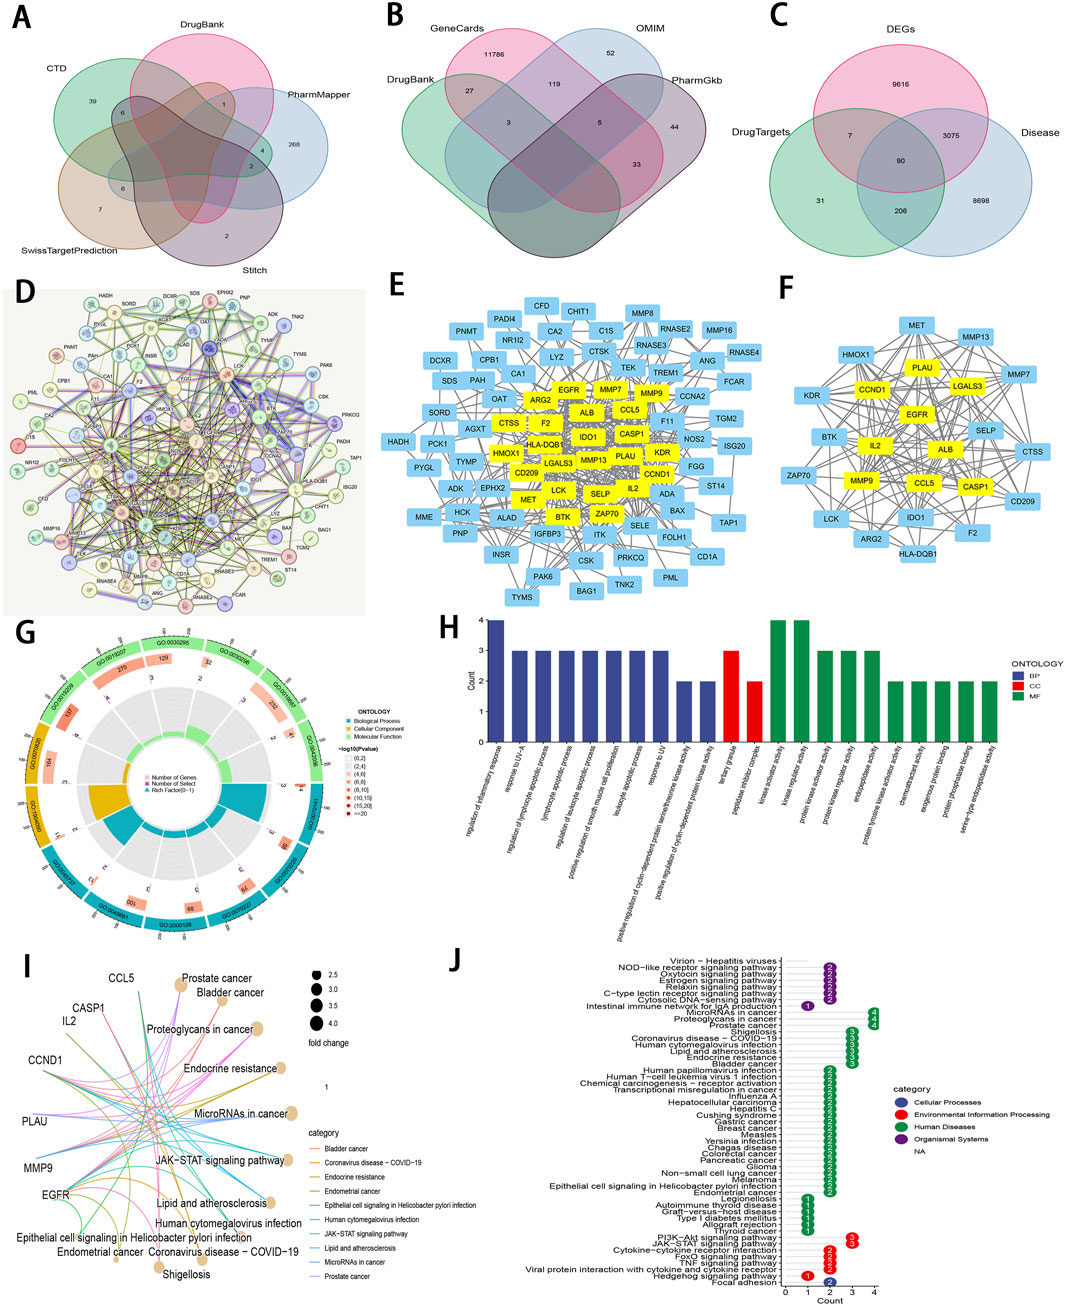
Figure 7. An integrative network pharmacology analysis of Zeb targeting ccRCC (A) The Venn diagram illustrating Zeb’s target based on different databases. (B) A Venn diagram depicting targets of ccRCC-related genes from multiple databases. (C) A Venn diagram illustrating the intersections between Zeb and ccRCC-related targets, as well as DEGs from TCGA-KIRC. (D) A PPI network generated by the STRING platform for the intersected targets of Zeb and ccRCC, with the medium confidence being set to >0.4 and free nodes being hidden. (E) The PPI network established based on Cytoscape software and interaction file for the intersected targets obtained from STRING platform. (F) A PPI network of core hub genes obtained after CytoNCA screening. (G) A circle diagram of GO annotation for core hub genes. (H) Top 10 terms in BP, CC, and MF categories from GO annotation of core hub genes. (I) A gene-pathway interaction network diagram of core hub genes from KEGG analysis. (J) A total of 51 distinct pathways obtained by KEGG enrichment of core hub genes.
These 90 shared targets were imported into STRING online platform (with Homo sapiens being the organism, medium confidence >0.4). After concealing the free-floating nodes (genes), the PPI network including 83 nodes and 706 edges (interactions) was acquired (Figure 7D), suggesting that Zeb might exert its influence on ccRCC through these genes. This PPI network file was uploaded in Cytoscape 3.10.2, where CytoNCA plugin was used to calculate BC, CC, DC, EC, LAC, and NC scores. High-score nodes were identified according to their scores exceeding the median value for each metric through two rounds of iterations, ultimately yielding 9 core targets, namely, ALB (albumin), CASP1 (caspase-1), CCL5 (C-C motif chemokine ligand 5), CCND1 (cyclin D1), EGFR (epidermal growth Factor Receptor), IL2 (interleukin-2), LGAL3 (galectin-3), MMP9 (matrix metalloprotease-9), and PLAU (plasminogen activator, urokinase) (Figures 7E, F).
3.7 GO and KEGG analysis for the core targetsThose 9 core genes identified were subjected to GO and KEGG analysis, leading to 497 GO terms and 51 KEGG pathways. Among them, the core targets mainly participated in the regulation of inflammatory response, response to UV−A, lymphocyte apoptotic process, regulation of lymphocyte apoptotic process, and regulation of leukocyte apoptotic process in BP. Regarding CC, these core targets were mainly related to tertiary granule and peptidase inhibitor complex. The MF terms enriched by these core targets included kinase regulator activity, kinase activator activity, protein kinase regulator activity, protein kinase activator activity, and endopeptidase activity (P < 0.01; Figures 7G, H).
The gene-pathway interaction network (Figure 7I) and 51 significant pathways were visualized through KEGG analysis (P < 0.01; Figure 7J). Within the 4 categories of KEGG, Organismal Systems encompassed pathways such as Virion-Hepatitis viruses, NOD-like receptor signaling pathway, Oxytocin signaling pathway. Human Diseases comprised MicroRNAs in cancer, proteoglycans in cancer, prostate cancer, bladder cancer, endocrine resistance, lipid and atherosclerosis, and more. PI3K-Akt signaling pathway, JAK-STAT signaling pathway, cytokine-cytokine receptor interaction, FoxO signaling pathway, TNF signaling pathway, viral protein interaction with cytokine and cytokine receptor, and hedgehog signaling pathway were classified under Environmental Information Processing, while Focal adhesion was categorized within Cellular Processes. Notably, PI3K−Akt, JAK−STAT, and TNF signaling pathways are important for ccRCC occurrence and development (Miao et al., 2018), (Liu et al., 2022). The corresponding schematic representations of the three pathways are illustrated in Supplementary Figure S5C.
3.8 Molecular dockingTo evaluate the binding affinity of Zeb to its core targets, we conducted molecular docking studies. First, Figure 8A illustrated both the 2D and 3D structures of Zeb. Thereafter, the PDB IDs for the major receptors were retrieved from PDB database. AutoDock Tools was employed to define the active site pockets and grid dimensions. Subsequently, molecular docking simulations were performed using AutoDock Vina, with the resulting 3D interaction diagrams presented in Figures 8B–J. Detailed binding parameters are summarized in Table 3. The binding energies of all Zeb-receptor complexes were consistently below −5 kcal/mol, with an average binding energy of −6.5 kcal/mol across the nine receptor systems. These results indicate that Zeb exhibits robust and stable binding interactions with its core targets, highlighting the potential for downstream signaling pathway activation.
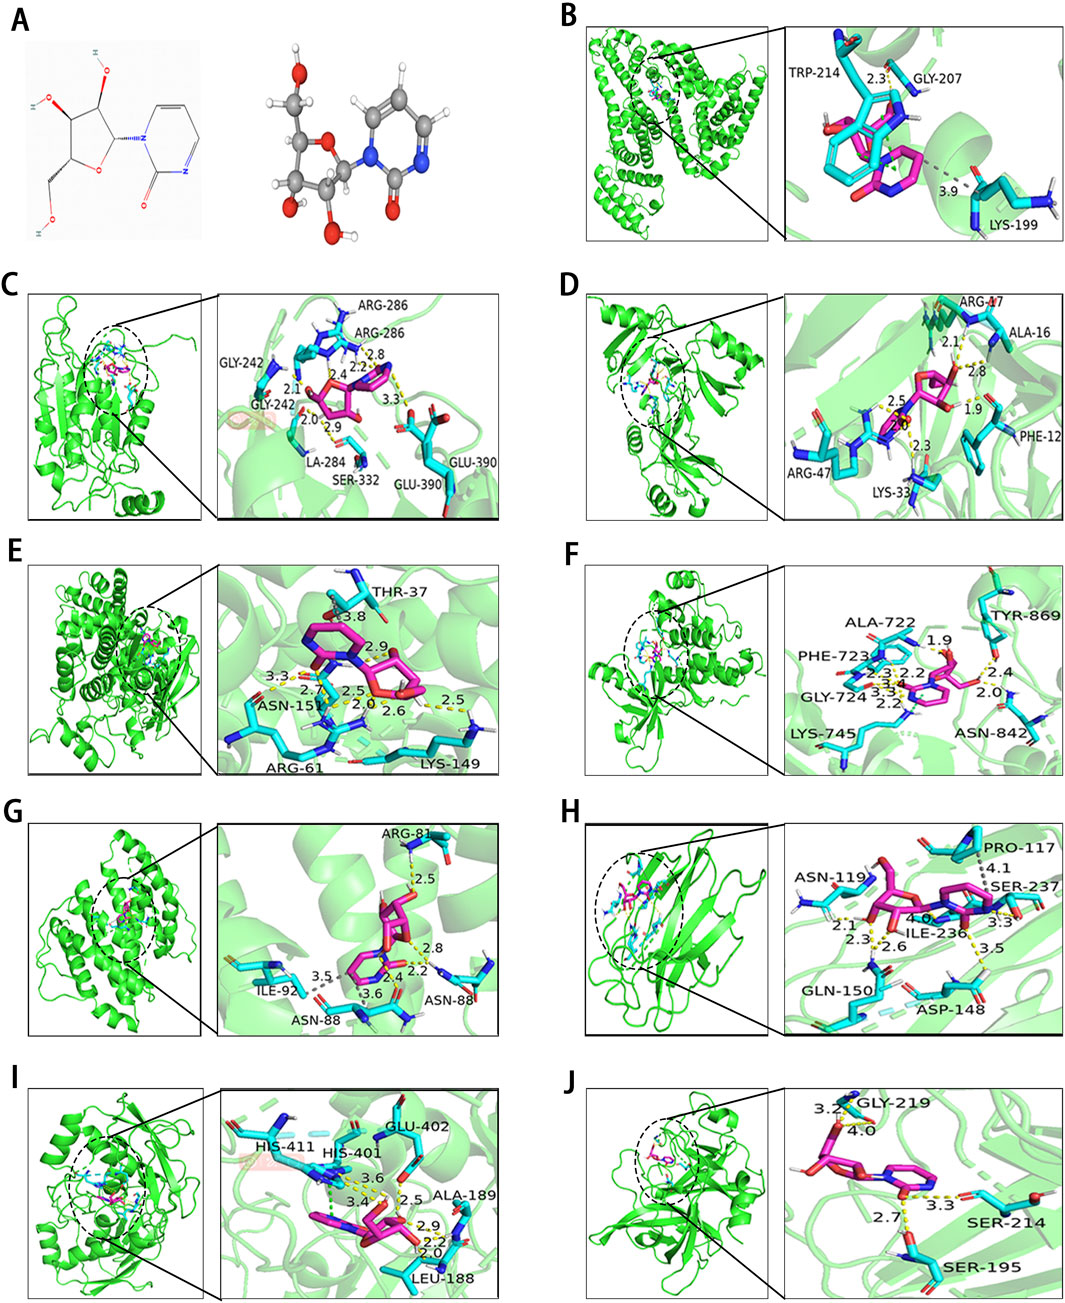
Figure 8. Results of molecular docking between receptors and ligands. (A) Visualization of Zeb’s 2D and 3D structures based on the PhbChem database. (B–J) Molecular docking results of Zeb targeting the core hub genes: (B) ALB, (C) CASP1, (D) CCL5, (E) CCND1, (F) EGFR, (G) IL-2, (H) LGALS3, (I) MMP9, and (J) PLAU. (Yellow, gray and green dashed lines indicate hydrogen bonds, hydrophobic interactions, and π-π stacking separately).
留言 (0)