
記住我
Pulmonary nodules (PNs) are non-transparent lesions that are surrounded by the lung parenchyma and are not attributable to pleural effusion, atelectasis, or mediastinal lymphadenopathy (1–3). The two types of nodules include solid PNs (SPNs) and subsolid PNs, which require different management strategies as per the Fleischner guidelines (4). For > 8 mm SPNs, tissue sampling is advised (5–7). The thorough preoperative assessment of these SPNs is essential before the biopsy or video-assisted thoracoscopic surgery (VATS)-based wedge resection.
The benign and malignant SPNs are generally distinguished based on the clinical data, computed tomography (CT) findings, and tumor marker levels for each patient (8–10). Several efforts have been made to establish predictive models that can assess SPN malignancy risk by combining several predictors associated with malignant nodules (9), yielding models with 84% - 91% sensitivities and 74% - 80% specificities, along with the area under the curve (AUC) values between 0.83-0.89 (9). Therefore, more accurate predictive models are required for SPN assessment.
Radiomics has emerged as a novel approach for processing clinical images to extract high-dimensional quantitative data, thereby allowing for the characterization of tissue features undiagnosable (11, 12). Several radiomics-based models have also been designed to identify benign and malignant PNs based on their CT features (13–15). However, the assessment of SPNs is generally performed in a manner stratified based on nodule size (8, 16–18), with ≤ 20 mm SPNs being classified as small SPNs (8, 16, 17). The malignancy rates associated with different SPN sizes vary, suggesting that extant CT radiomics-based models may not be appropriate for evaluating small SPNs.
In this study, a CT radiomics-based model was designed to distinguish between benign and malignant small SPNs.
MethodsThis study was authorized by the Ethics Committee of Xuzhou Central Hospital, and the requirement of written informed consent was waived.
Study designThis study enrolled small SPN patients consecutively from January 2019 to November 2021. The inclusion criteria included patients who indicated: (i) small SPNs ≤ 20 mm, (ii) a confirmed pathological SPN diagnosis after surgical resection, and (iii) a < 2-week interval between SPN detection and surgical resection. Patients were excluded if they had: (i) poor image quality; (ii) a history of malignancy, (iii) SPNs < 6 mm in diameter, or (iv) incomplete clinical data. Eligible patients were randomly assigned to training and testing cohorts at an 8:2 ratio.
Clinical dataClinical data were collected for all the patients including demographic factors (age, gender, smoking history), CT features (location, diameter, lobulation, spiculation, pleural retraction sign, CT bronchus sign, and calcification), and the levels of tumor markers [carcinoembryonic antigen (CEA), squamous cell carcinoma antigen (SCC), neuron-specific enolase (NSE), serum gastrin, cytokeratin 19 fragment (CYFRA21-1)]. The size of the SPNs was measured as the largest diameter on the axial CT images.
CT images acquisitionA 64-row CT instrument (Brilliance 64 CT, Philips) was used for all CT imaging with the following settings: tube voltage = 120 kVp, tube current = 160-220 mAs, pitch = 0.97, and collimation = 0.6×128 mm. Images were reconstructed using a medium sharp (B50) reconstruction algorithm with a 1.0 - 1.25 mm thickness. The images of the lung (width = 1600 HU; level = -600 HU) and mediastinal (width = 450 HU; level = -50 HU) windows were analyzed. CT imaging features were assessed individually by two chest radiologists (JXS and XXZ) with 7 and 12 years of relevant experience, respectively, who were blinded to the pathological results for each patient.
Feature extractionA chief radiologist (YJY) with 7 years of experience manually segmented target 3D SPNs with the Radcloud platform (http://radcloud.cn) and remained blinded to patient pathological results. Further, the Radcloud platform was used for extracting the radiomics feature. Observer consistency was assessed using intra- and inter-class coefficient (ICC) values. Briefly, CT images from 20 randomly selected individuals in the training cohort were independently segmented by two radiologists (JXS and XXZ). Moreover, Reader 1 (JXS) repeated the segmentation of tumors from these 20 patients following a one-week interval. Repeatable features were regarded as those with an ICC ≥ 0.8, which were elected for subsequent evaluation. All remaining images were segmented by Reader 1 (JXS).
Feature selectionFeatures with > 0.8 variances were identified with the variance threshold method for further analysis. Furthermore, based on the Selec-K-Best method analysis, features with a p-value of < 0.05 were then retained for a final step in which, features associated with malignant SPNs were selected using a least absolute shrinkage and selection operator (LASSO) regression model. These characteristics were employed to formulate a radiomics signature, enabling the computation of radiomics scores for each respective patient.
Development and validation of a CT radiomics-based modelTo distinguish between malignant and benign small SPNs, a CT radiomics-based model was established. Briefly, univariate analysis (UA) and multivariate logistic regression analysis (MLRA) were carried out to select risk factors related to SPN malignancy in the training cohort. Then, a nomogram incorporating these risk factors and radiomics scores was established. Subsequently, the AUC values for receiver operating characteristic (ROC) curves were employed to assess the accuracy of the developed model. Moreover, the model was validated using data from the patients in the testing cohort.
Clinical benefit assessmentThe clinical application of the predictive model was assessed via a decision curve analysis of the training and testing cohorts.
Statistical analysesThe statistical analysis was carried out using the SPSS 25.0 and R 4.1.2 software. Eligible patients were randomly assigned to training and testing cohorts at an 8:2 ratio using the Radcloud platform. The comparison of categorical data was carried out via Fisher’s exact test or χ2 test, while for continuous data, an independent sample t-test or Mann-Whitney U test was carried out. UA and MLRA were performed to identify factors that are associated with SPN malignancy. In the MLRA, particularly in UA, variables indicating a P-value < 0.1, were then selected. The comparison of AUC values was implemented using the DeLong test, and the predictive model’s performance was evaluated via calibration curves and the Hosmer-Lemeshow test. The statistical significance threshold was set as P < 0.05.
ResultsPatients’ criteriaThis study recruited 323 patients with small SPNs who underwent surgical resection procedures in our hospital from January 2019 to November 2021. Of these 323 patients, 210 were selected for further analyses (Figure 1). Each patient had a single SPN with a pathological diagnosis confirmed following surgical resection. All the participants were categorized into training (n = 168) and testing (n = 42) groups in an 8:2 ratio. Table 1 indicates detailed information on the characteristics of selected patients.
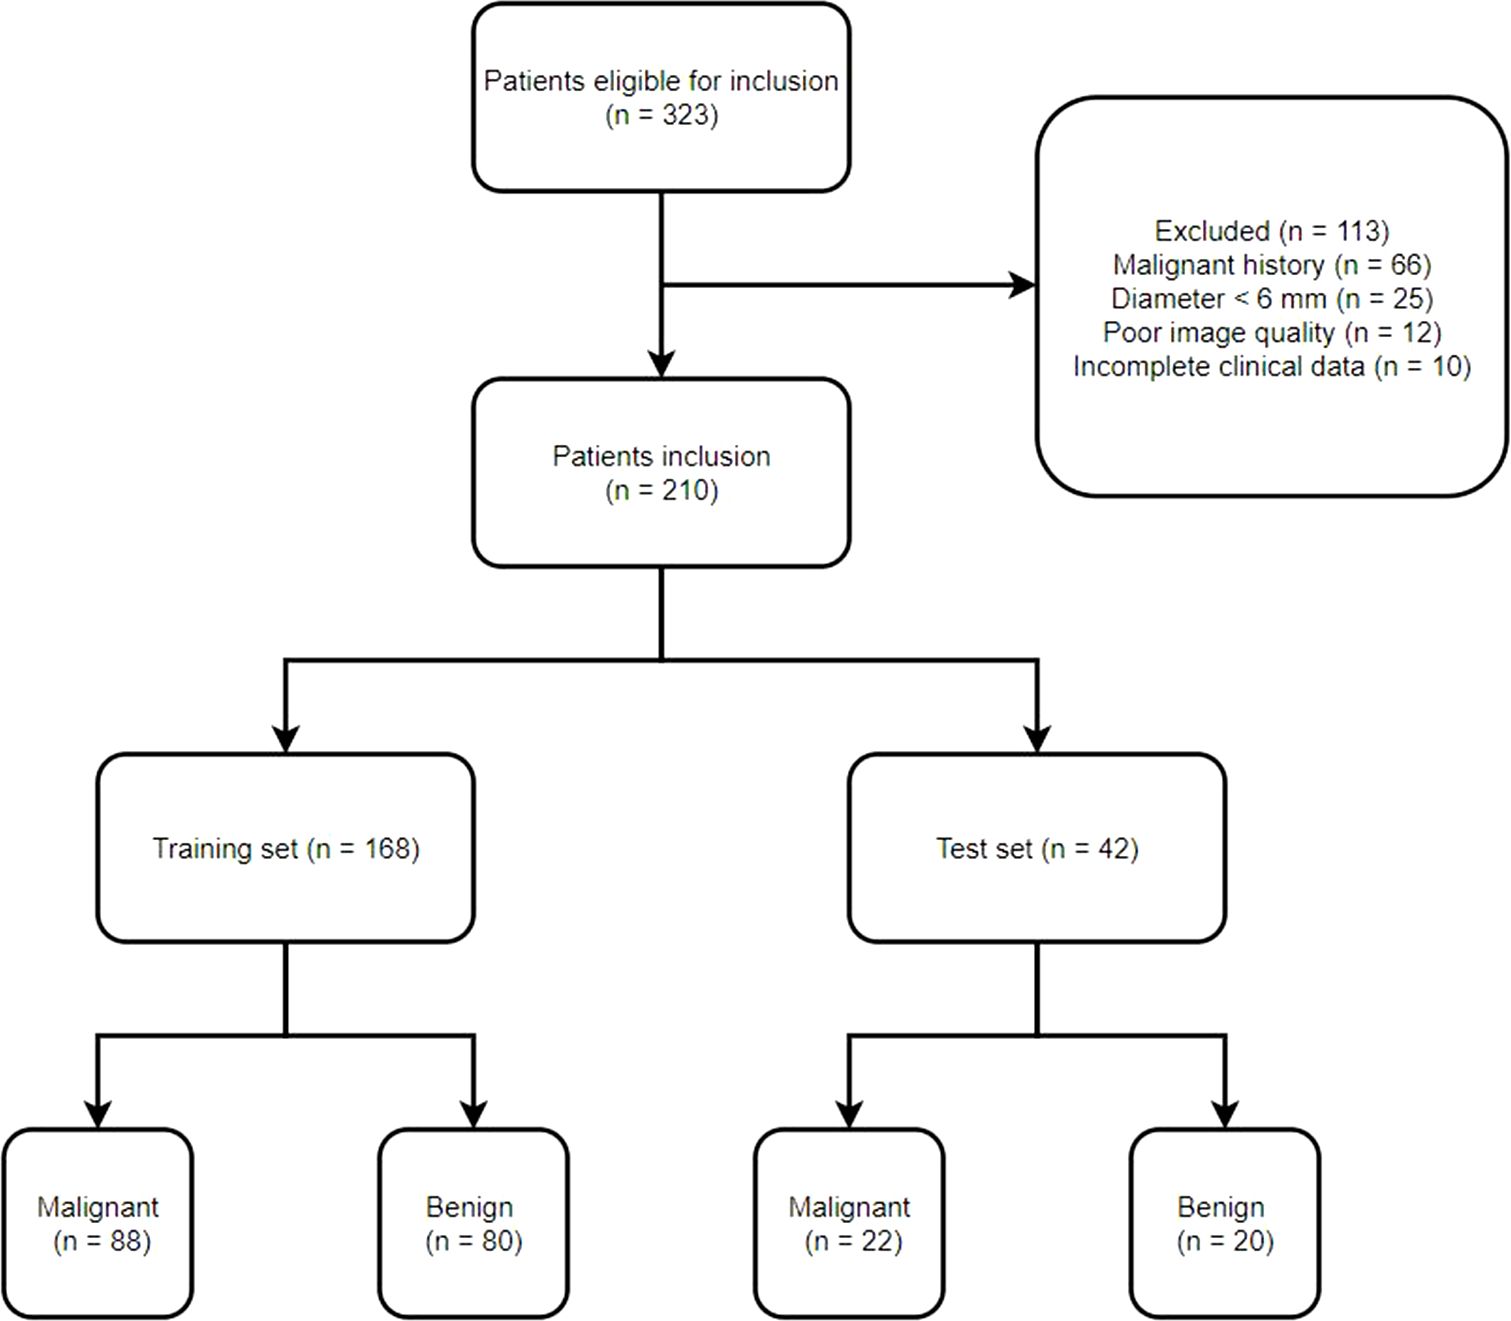
Figure 1. Study flowchart.
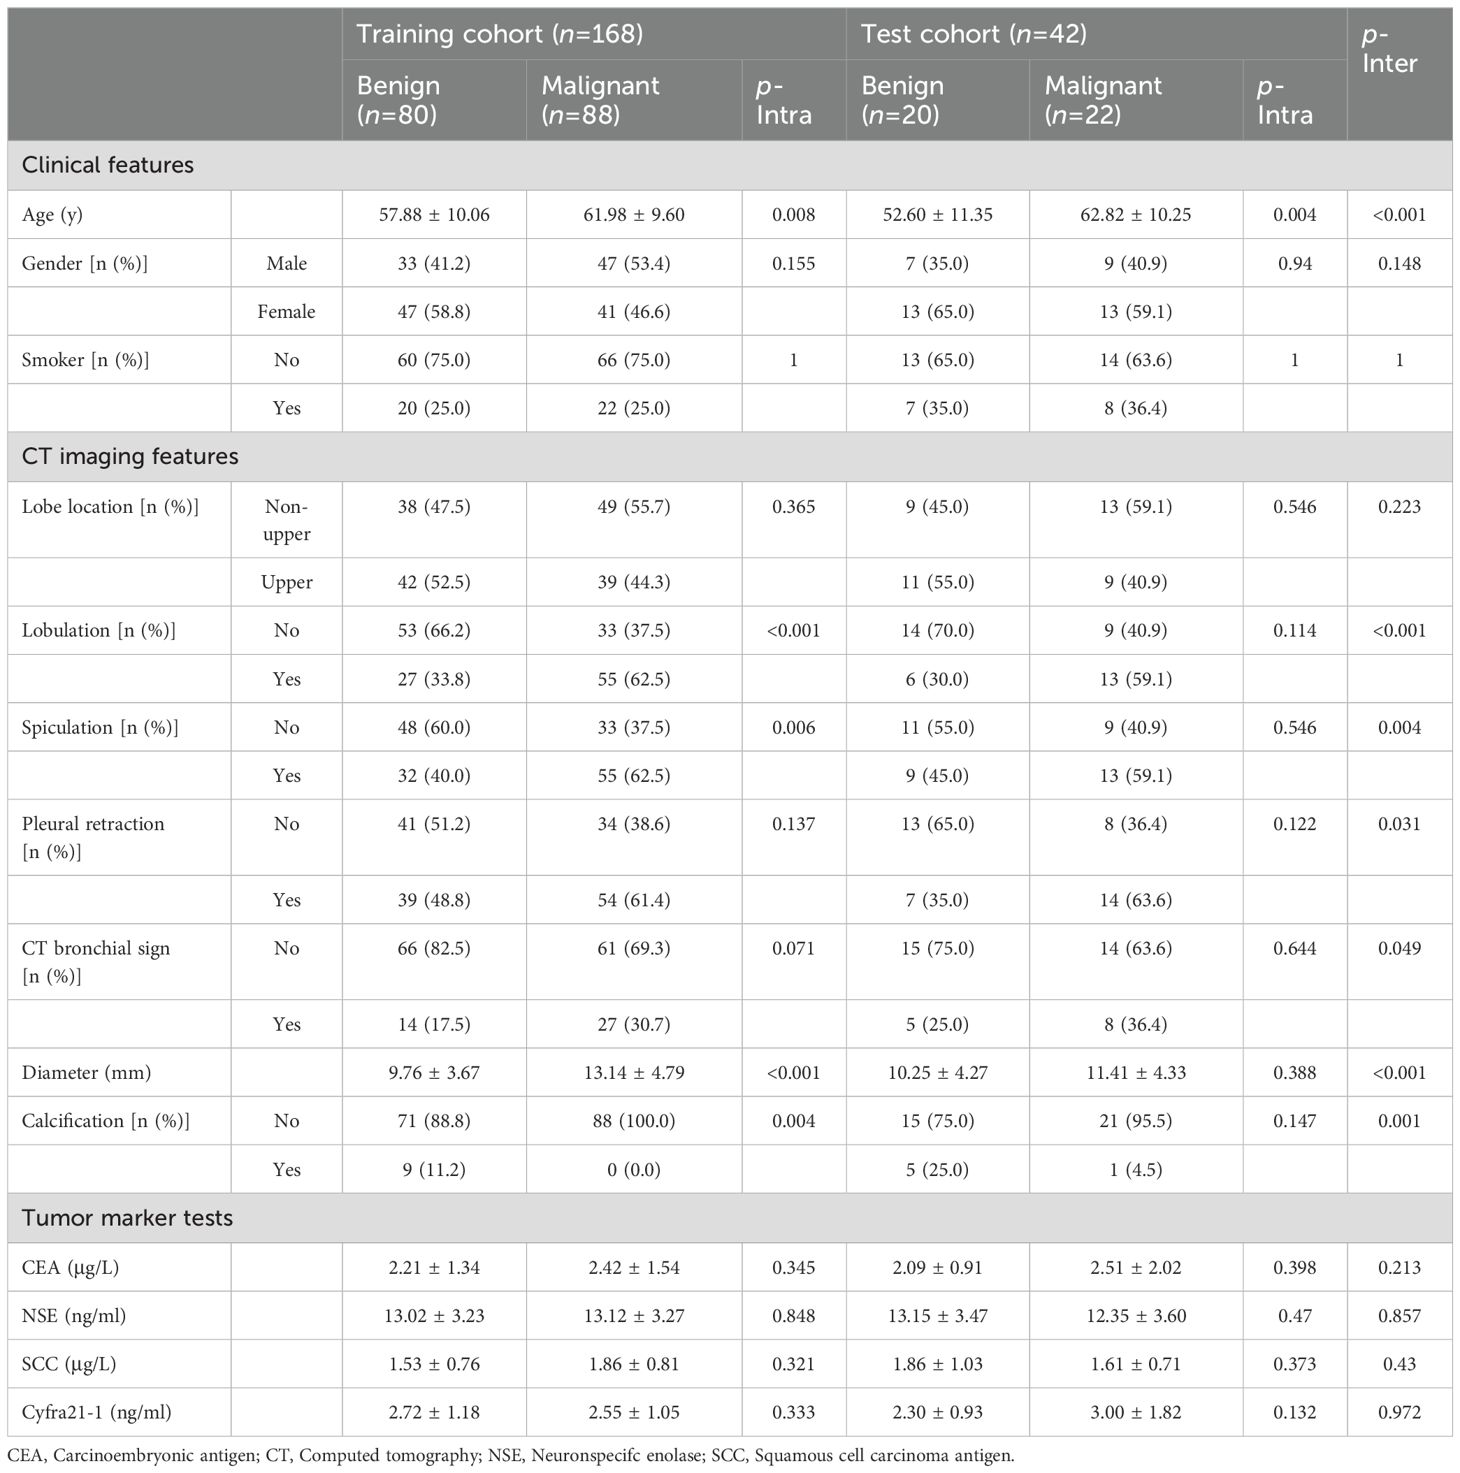
Table 1. Baseline data of the patients.
Feature selection and radiomics scoringInitial analyses identified 1409 radiomics features. Then, to develop a radiomics score, a stepwise process was then employed (Supplementary Table S1), which revealed 9 features for radiomics score calculation (Supplementary Table S2). Coefficient values for all features as well as the mean square error for the combined sequences are presented in Supplementary Figure S1.
Identification of malignancy-related clinicoradiological factorsThe clinicoradiological features associated with malignant SPNs were assessed in the training cohort. The data revealed that the training cohort comprised 88 and 80 malignant and benign SPNs patients, respectively. UA identified older age (P = 0.01), lobulation (P < 0.001), spiculation (P < 0.001), and larger SPN diameter (P < 0.001) as being associated with a risk of SPN malignancy. Furthermore, MLRA confirmed that lobulation (P < 0.001), spiculation (P < 0.001), and larger SPN diameter (P < 0.001) were associated with a greater risk of SPN malignancy (Table 2).
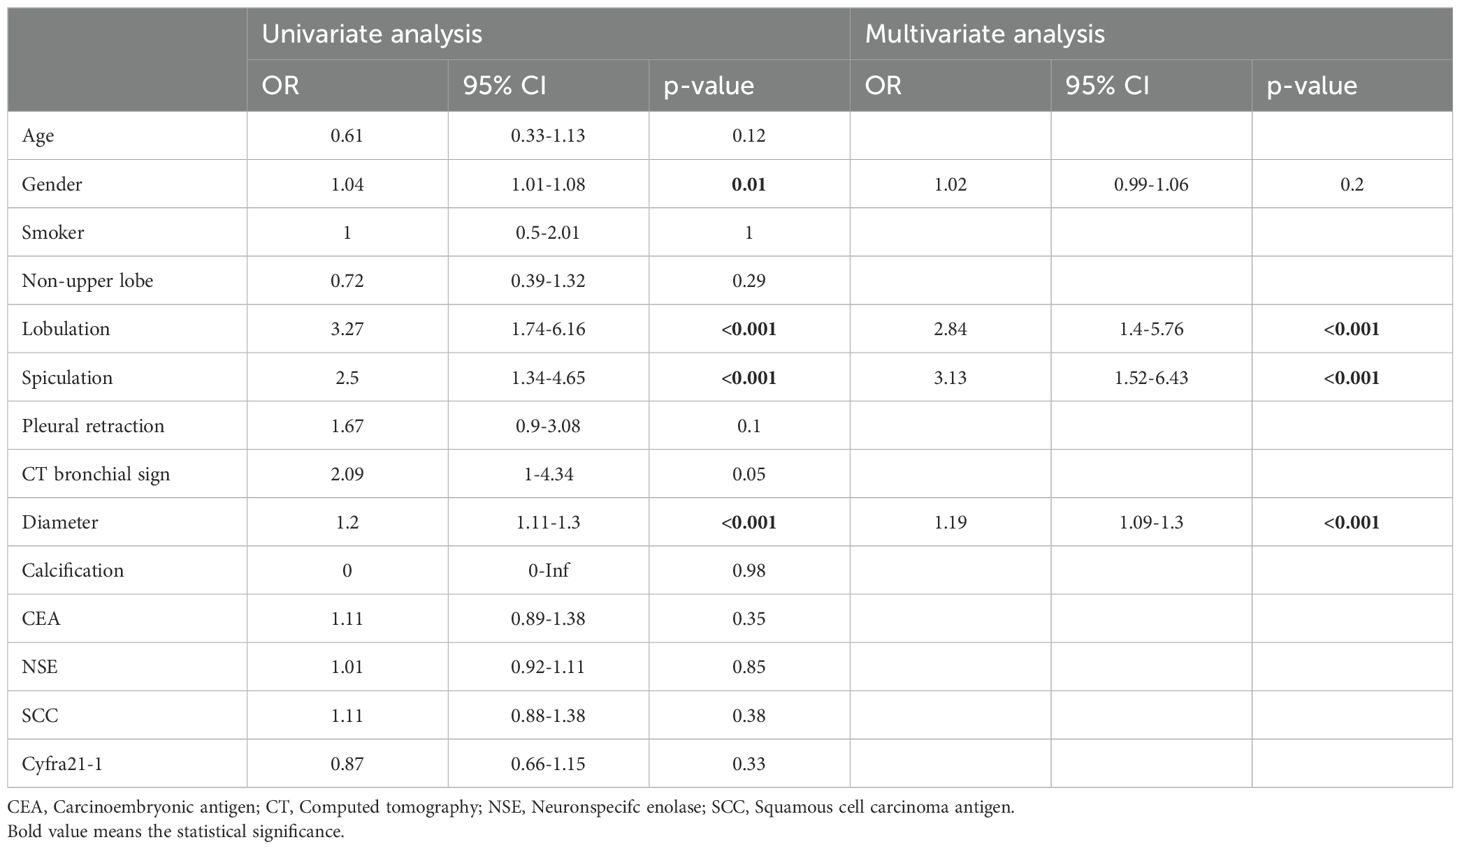
Table 2. Predictors of malignancy in the training cohort (malignancy: 88/benign: 80).
Predictive model developmentThe identified clinicoradiological factors and radiomics score were used to establish a predictive model with the following formula: X = -6.773 + 12.0705×radiomics score+2.5313×lobulation (present: 1; no present: 0)+3.1761×spiculation (present: 1; no present: 0)+0.3253×diameter. A nomogram was also developed with this CT radiomics-based model (Figure 2). Furthermore, individual clinicoradiological and radiomics score models were also developed. Sensitivity, specificity, accuracy, and AUC measurements for these models are presented in Table 3. AUC values for the CT radiomics-based model, CT radiomics score, and clinicoradiological score were 0.957, 0.945, and 0.853 (Figure 3A). Moreover, the AUC values of the CT radiomics-based model were significantly higher those for both CT radiomics scores (P = 0.035) and clinicoradiological scores (P = 0.021).
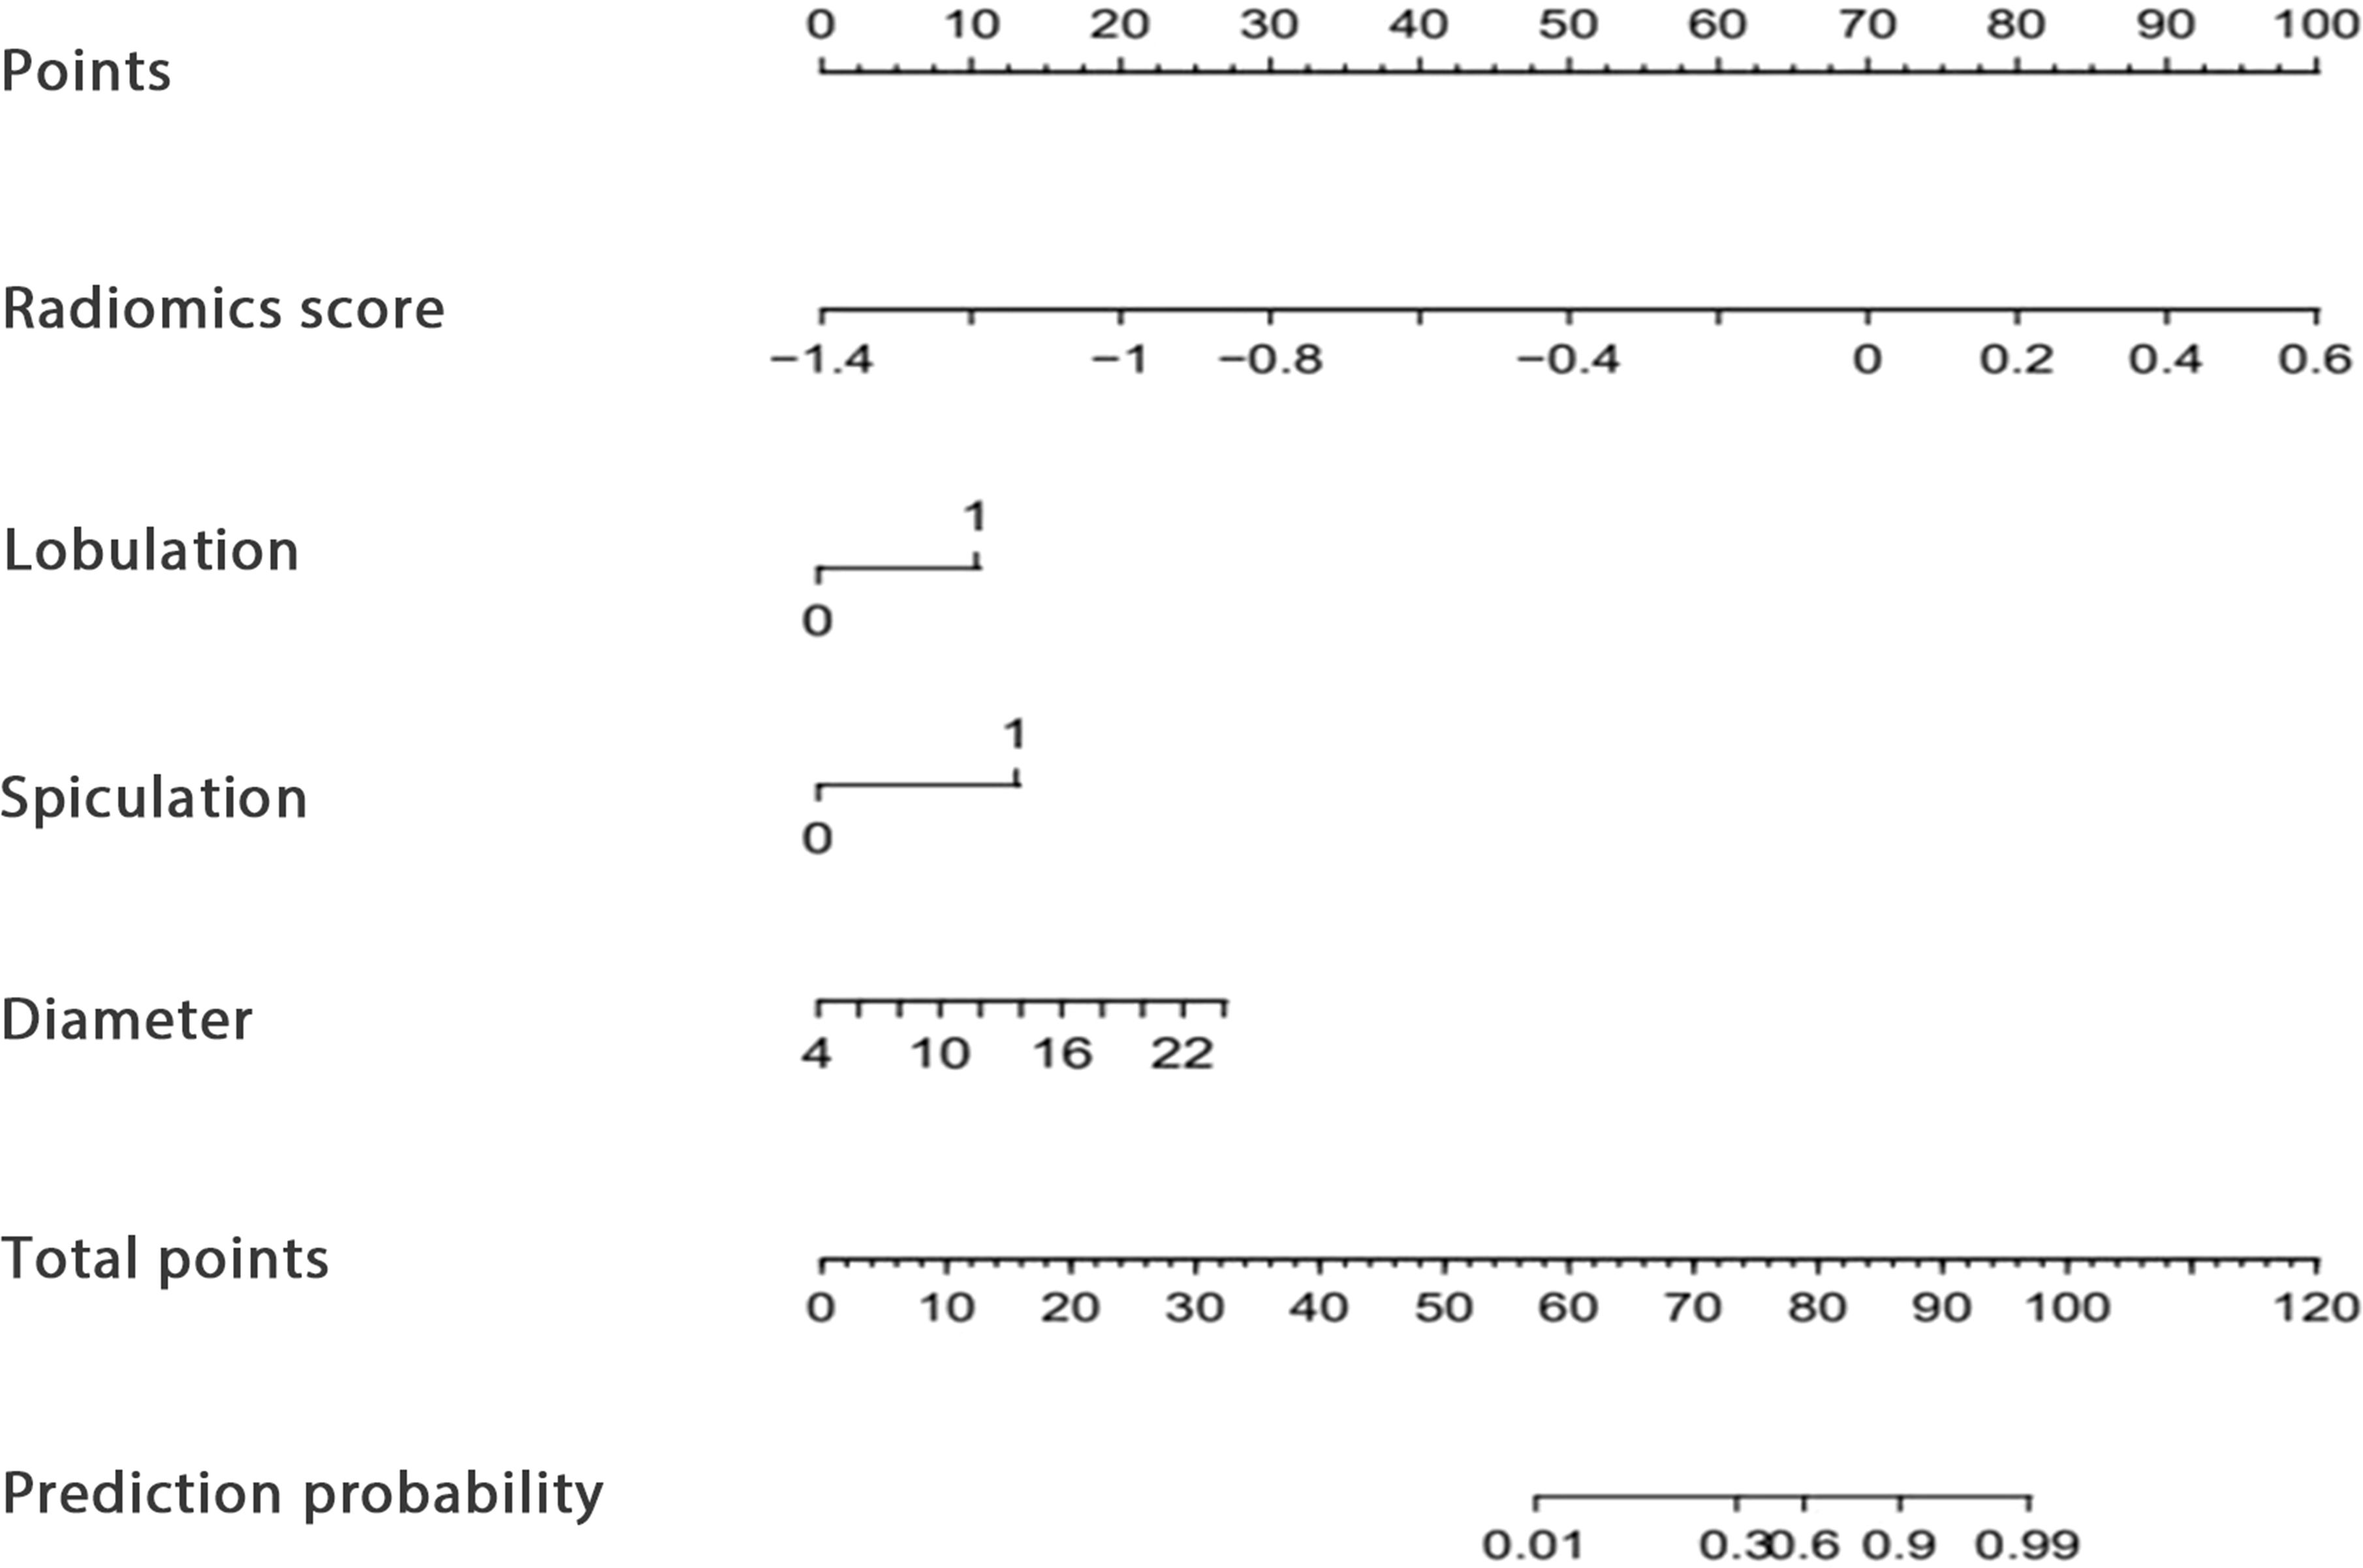
Figure 2. The developed CT radiomics model-based nomogram.
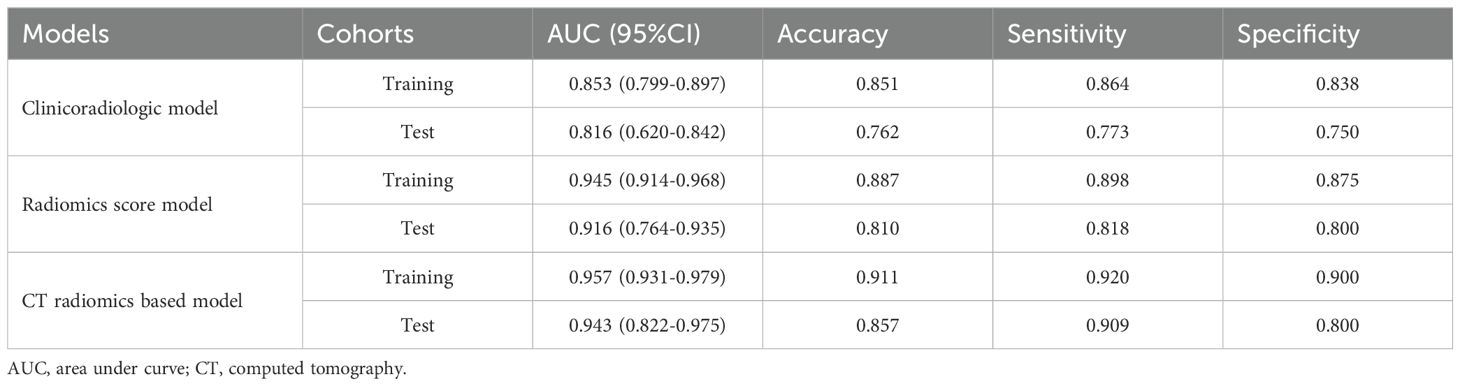
Table 3. The diagnostic performance of each model.
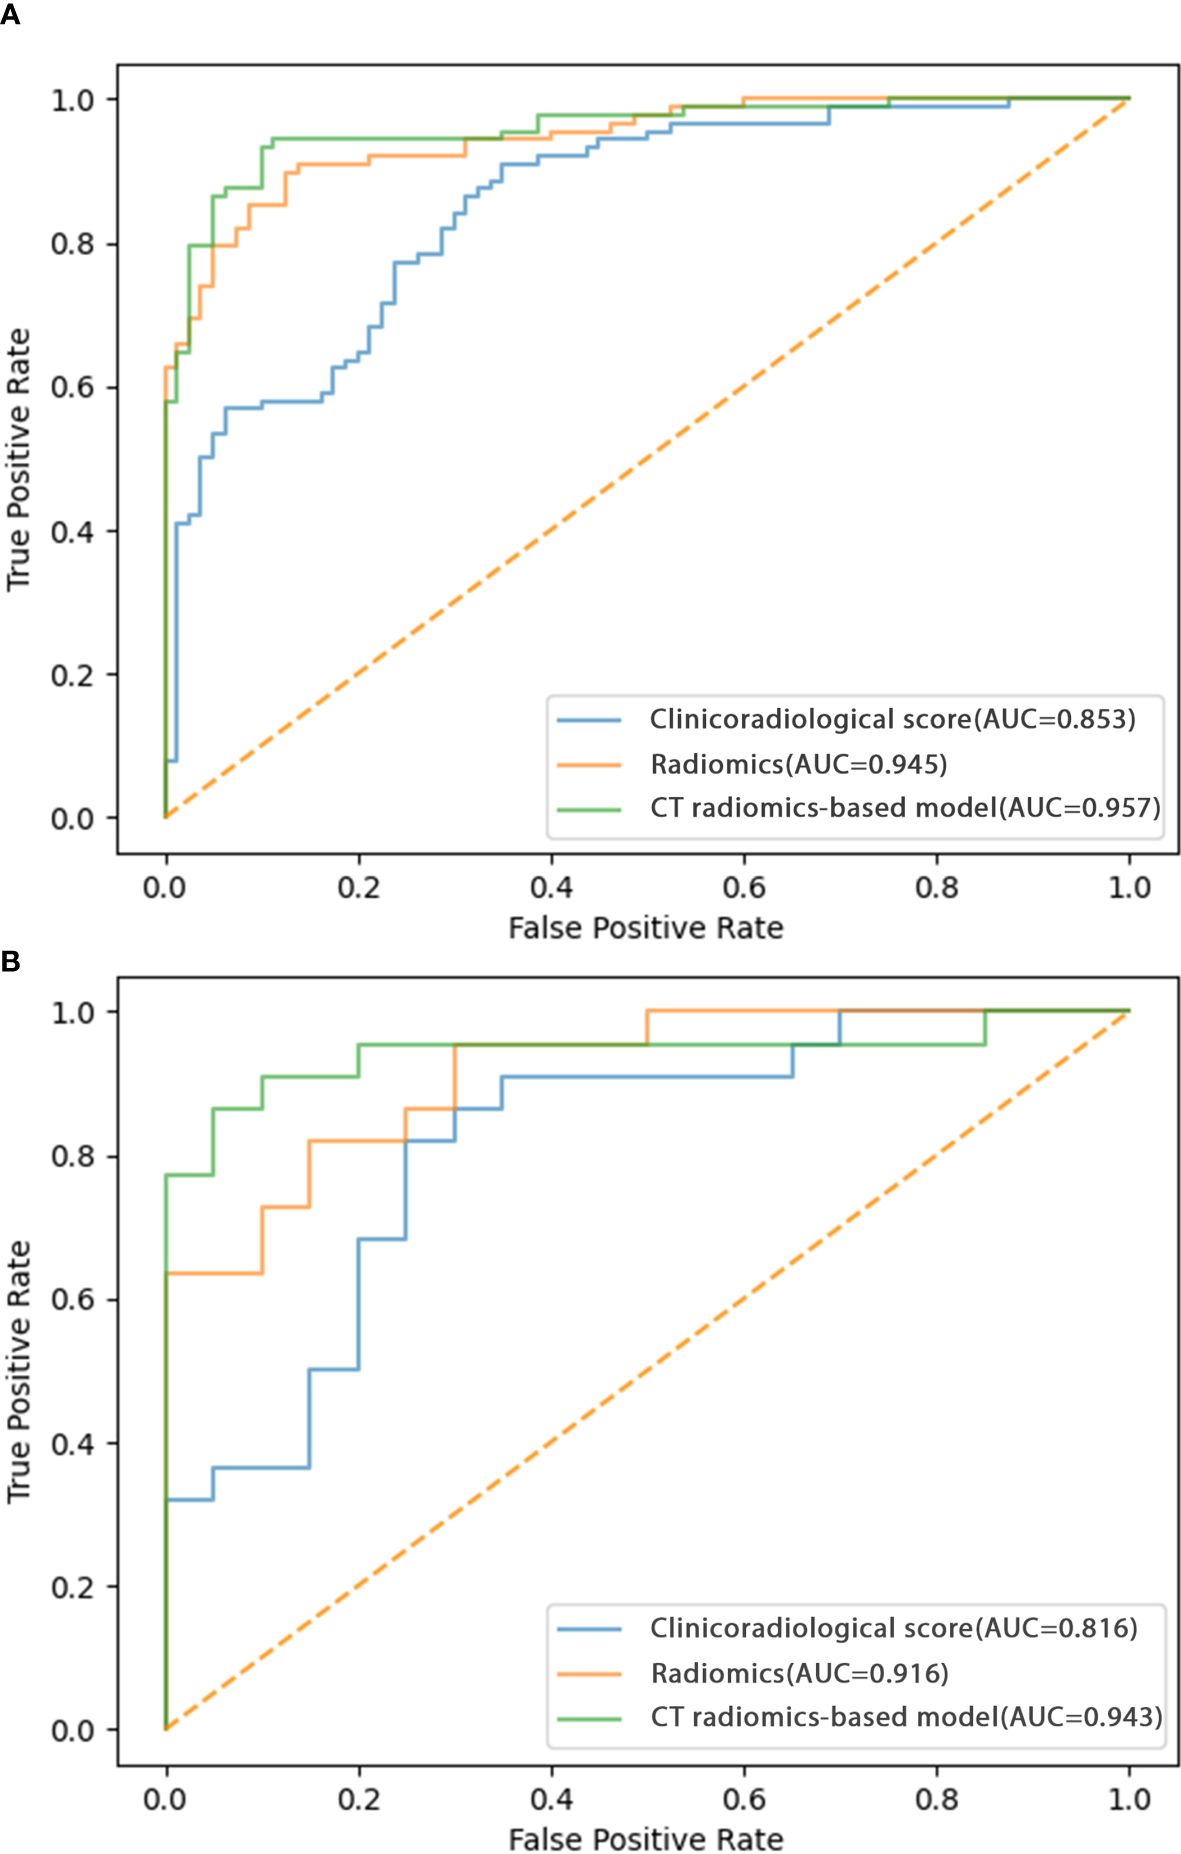
Figure 3. ROC curves corresponding to the CT radiomics-based model, CT radiomics score, and clinicoradiological score in the (A) training and (B) testing cohorts.
Model validationThe testing cohort comprised 42 patients, including 20 benign and 22 malignant SPN patients. Using the models developed above as well as the testing cohort data, the AUC values of the CT radiomics-based model, CT radiomics score, and clinicoradiological score were assessed as 0.943, 0.916, and 0.816, respectively (Figure 3B). The AUC of the CT radiomics-based model was significantly greater than the CT radiomics score (P = 0.043) and clinicoradiological score (P < 0.001).
Analysis of model clinical benefitIn calibration curve analyses, the results predicted via the CT radiomics-based model and the actual results indicated good consistency in the training and testing cohorts (Figures 4A, B). Further, decision curves confirmed that the developed nomogram and associated predictive model yielded a net benefit in both cohorts with a risk threshold > 0 (Figures 5A, B).
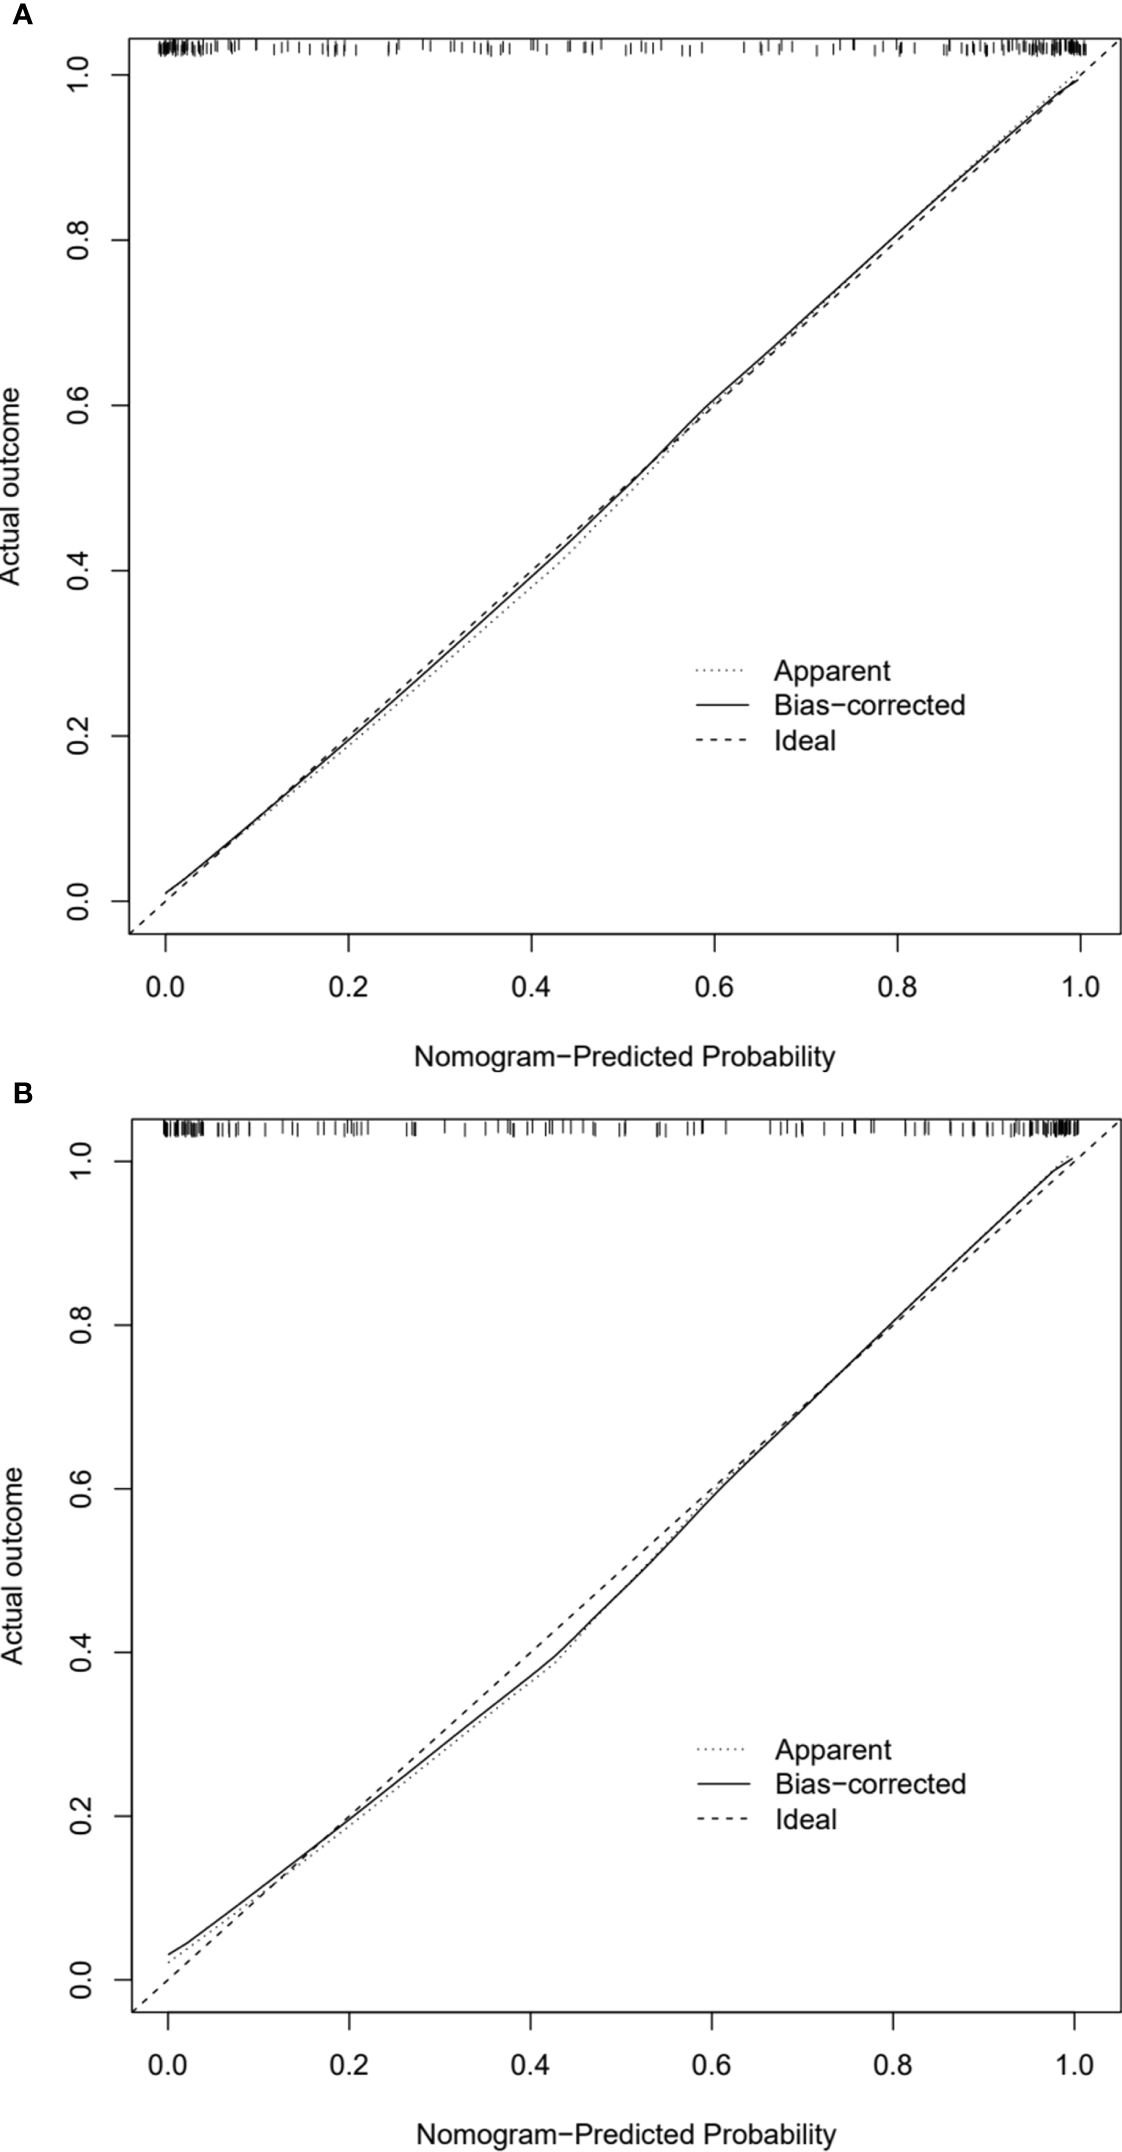
Figure 4. Calibration curves of CT radiomics-based model in the (A) training and (B) testing cohorts.
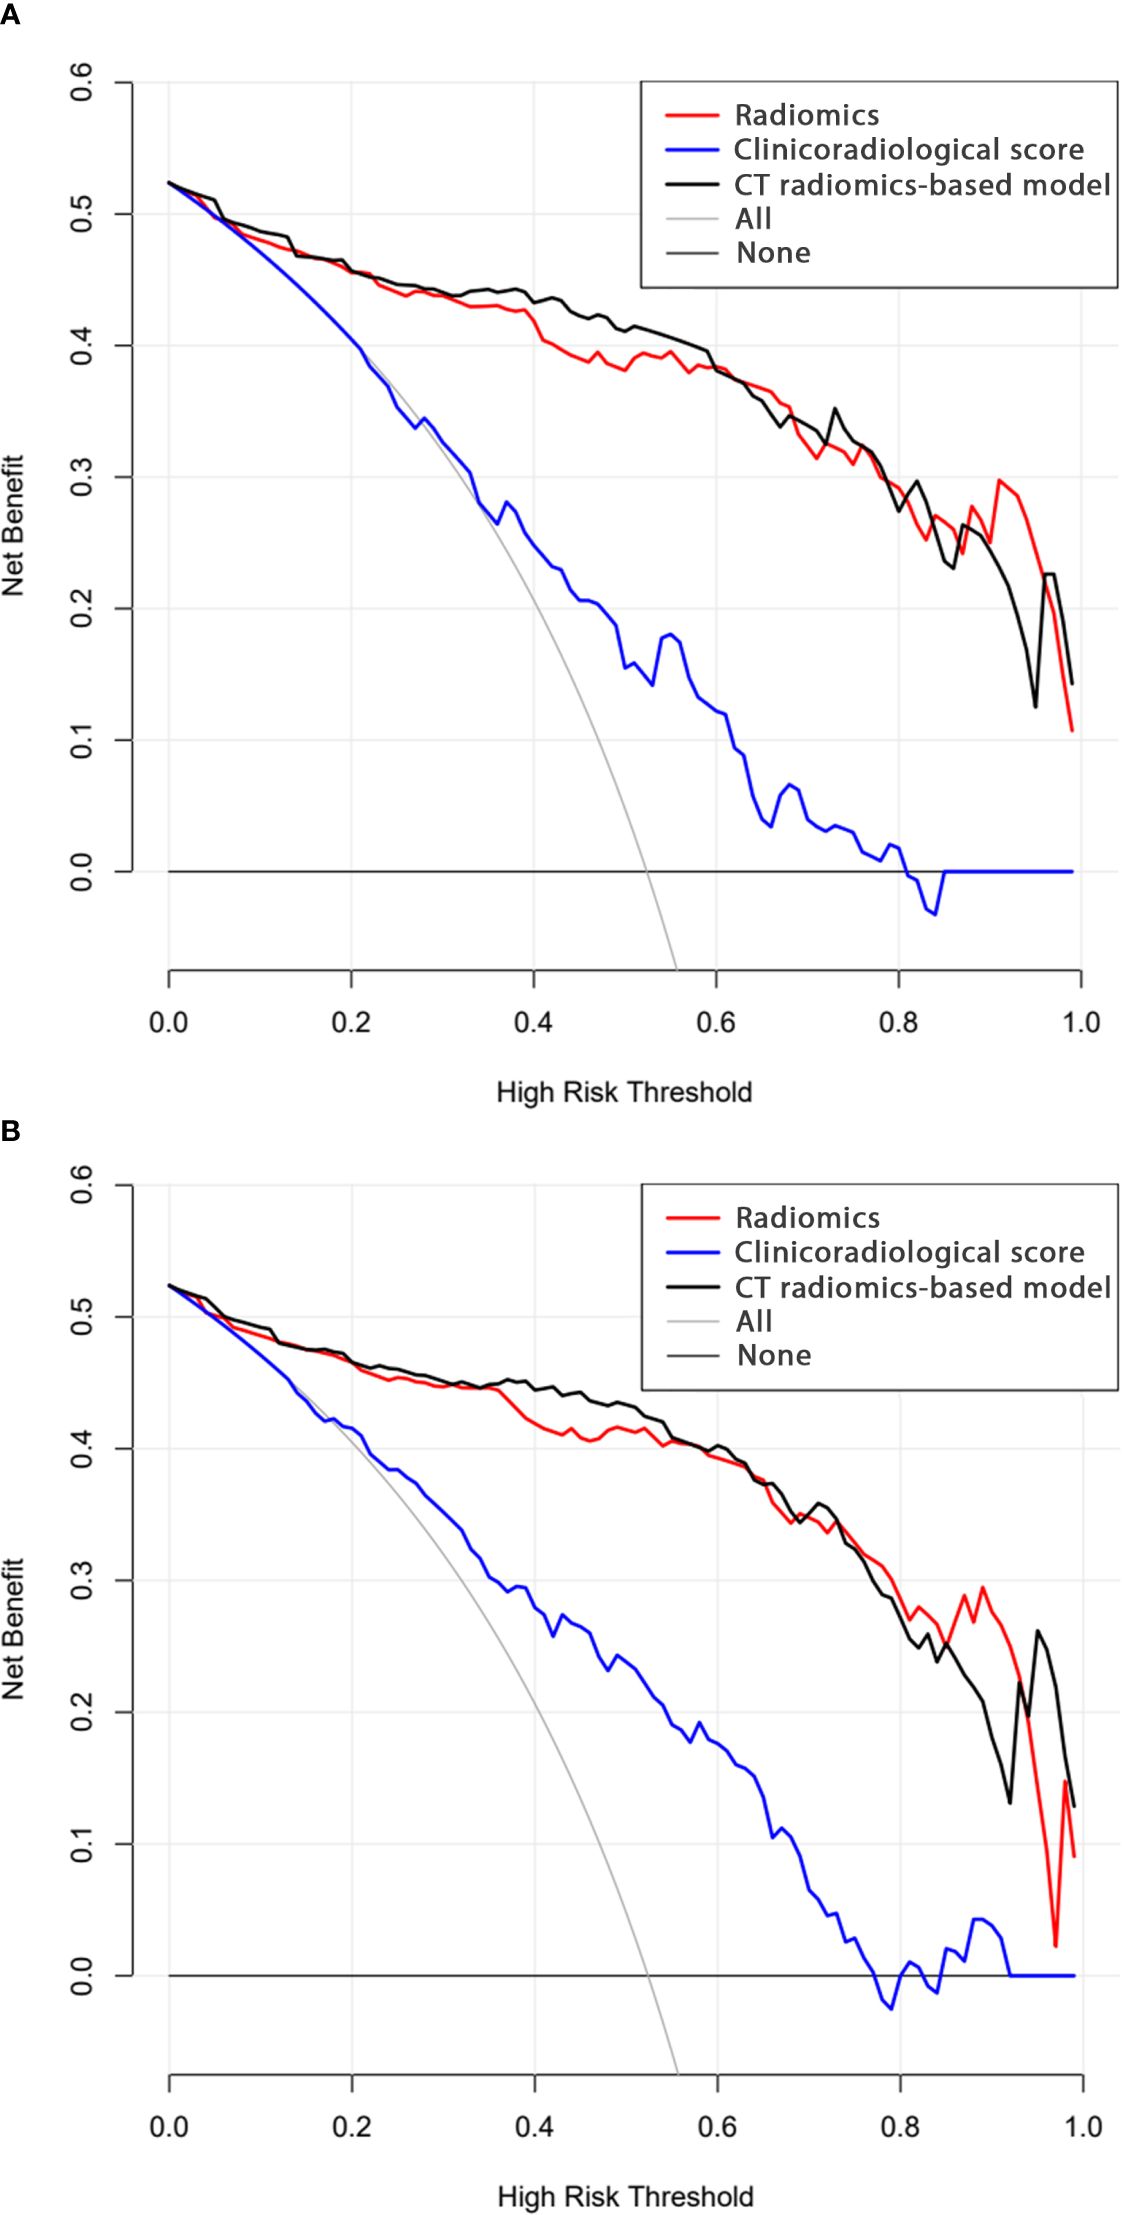
Figure 5. Decision curve analysis results for the (A) training and (B) testing cohorts.
DiscussionAccurately diagnosing malignant SPNs is vital for the effective detection and management of lung cancer. Although the CT follow-up and longitudinal evaluation are often required for the SPNs, the follow-up for the high-risk SPNs may sometimes increase the risk of tumor growth. The Fleischner Society guidelines also recommended that the high-risk SPNs required tissue sampling (4). The predictive model is important because it can provide a comprehensive analysis for the SPNs and it can help us to make the next decision for CT follow-up or tissue sampling. Although various models have been designed to distinguish SPNs that are benign and malignant based on certain biomarkers (19–21), it is necessary to further stratify these analyses according to SPN size due to the high degree of variability in the malignancy rates of SPNs with different sizes (22). Some specific predictive models have been designed to identify small SPNs (8, 19, 23), however, further studies are required focusing on incorporating radiomics data into these models.
Variables such as clinical and tumor morphological characteristics are often incorporated into clinicoradiological predictive models aimed at differentiating benign and malignant SPNs (8, 19). The most common CT features of malignant SPN include a larger diameter, lobulation, spiculation, and CT bronchial sign (8, 19, 23). This study developed a more traditional predictive model based on clinical and tumor CT findings, which yielded AUC values of 0.853 and 0.816 in the training and testing cohorts, respectively. These AUC values align well with previously studied predictive models for small SPNs (0.744-0.878) (8, 19). However, these traditional CT features fail to offer any insight into the detailed internal structural properties of target tumors. Moreover, the identification of these features is often based on the experience of the radiologists who evaluate patient imaging results, therefore, they are prone to a high risk of bias.
The radiomics method entails the processing of medical images to extract high-dimensional quantitative data. This technique can characterize tumor microscopic features related to cellular, molecular, or gene expression patterns. Several studies support the application of radiomics to the differential diagnosis and prognostic assessment of several tumor types (12–14).
Here, a CT radiomics-based model was developed that could distinguish between benign and malignant small SPNs. This model was based on a combination of the radiomics scores and the established clinical model. The model showed an AUC value higher than that of the clinical model in the training (0.957 vs. 0.853, P = 0.021) and testing (0.943 vs. 0.816, P < 0.001) cohorts. These data validate that the radiomics score to significantly improves diagnostic performance relative to that associated with traditional clinical and radiological findings. The resultant nomogram can generate a direct predictive score for each small SPN, with this score corresponding to a predicted probability that can aid in clinical decision-making efforts.
Predictive models developed to evaluate small SPNs in previous reports determined that CEA levels were significantly related to the risk of malignancy (8, 23). One meta-analysis demonstrated that CEA had good diagnostic performance when used to distinguish between benign and malignant PNs (24). However, in the present study, no relationship was observed between tumor marker levels and the malignancy status of small SPNs. These discrepant results may be attributable to sample size limitations.
There are some limitations to the present study. For one, as a retrospective study, there is a high risk of selective bias. Secondly, this was a single-center study, therefore, prospective multi-center validation is required. Thirdly, some patient data at baseline was not balanced between the training and testing cohorts, potentially contributing to a greater risk of bias. However, both cohorts exhibited similarly high AUC values exceeding 0.9, suggesting a high degree of stability for the predictive model. Finally, because a radiomics approach was employed in this study, the reproducibility of this analytical strategy and its potential for standardization are limited, constraining the potential clinical application of this model.
ConclusionsIn summary, this study established a CT radiomics-based model that indicated satisfactory diagnostic accuracy in distinguishing between benign and malignant small SPNs.
Data availability statementThe raw data supporting the conclusions of this article will be made available by the authors, without undue reservation.
Ethics statementThe studies involving humans were approved by Ethics committee of Xuzhou Central Hospital. The studies were conducted in accordance with the local legislation and institutional requirements. The ethics committee/institutional review board waived the requirement of written informed consent for participation from the participants or the participants’ legal guardians/next of kin because This is a retrospective study.
Author contributionsJS: Data curation, Writing – original draft. XZ: Methodology, Writing – original draft. YY: Formal analysis, Writing – original draft. YW: Funding acquisition, Writing – original draft. YS: Methodology, Writing – review & editing. QX: Validation, Writing – review & editing. SC: Supervision, Writing – review & editing.
FundingThe author(s) declare financial support was received for the research, authorship, and/or publication of this article. This study was supported by The Technology Program of Xuzhou Commission of Health (XWKYHT20220104).
Conflict of interestThe authors declare that the research was conducted in the absence of any commercial or financial relationships that could be construed as a potential conflict of interest.
Generative AI statementThe author(s) declare that no Generative AI was used in the creation of this manuscript.
Publisher’s noteAll claims expressed in this article are solely those of the authors and do not necessarily represent those of their affiliated organizations, or those of the publisher, the editors and the reviewers. Any product that may be evaluated in this article, or claim that may be made by its manufacturer, is not guaranteed or endorsed by the publisher.
Supplementary materialThe Supplementary Material for this article can be found online at: https://www.frontiersin.org/articles/10.3389/fonc.2025.1502932/full#supplementary-material
Supplementary Figure 1 | (A) The coefficients for each individual feature and (B) combined sequence mean square errors.
AbbreviationsAUC, area under curve; CEA, carcinoembryonic antigen; CT, computed tomography; CYFRA21-1, cytokeratin 19 fragment; ICC, inter-class coefficient; LASSO, least absolute shrinkage and selection operator; NSE, neuron specific enolase; PN, pulmonary nodule; ROC, receiver operator characteristic; SCC, squamous cell carcinoma antigen; SPN, solid PN; VATS, video-assisted thoracoscopic surgery.
References1. Khodayari Moez E, Warkentin MT, Brhane Y, Lam S, Field JK, Liu G, et al. Circulating proteome for pulmonary nodule Malignancy. J Natl Cancer Inst. (2023) 115:1060–70. doi: 10.1093/jnci/djad122
PubMed Abstract | Crossref Full Text | Google Scholar
2. Zhao Y, Wang Z, Liu X, Chen Q, Li C, Zhao H, et al. Pulmonary nodule detection based on multiscale feature fusion. Comput Math Methods Med. (2022) 2022:8903037. doi: 10.1155/2022/8903037
PubMed Abstract | Crossref Full Text | Google Scholar
3. Bartholmai BJ, Koo CW, Johnson GB, White DB, Raghunath SM, Rajagopalan S, et al. Pulmonary nodule characterization, including computer analysis and quantitative features. J Thorac Imaging. (2015) 30:139–56. doi: 10.1097/RTI.0000000000000137
PubMed Abstract | Crossref Full Text | Google Scholar
4. MacMahon H, Naidich DP, Goo JM, Lee KS, Leung ANC, Mayo JR, et al. Guidelines for management of incidental pulmonary nodules detected on CT images: from the fleischner society 2017. Radiology. (2017) 284:228–43. doi: 10.1148/radiol.2017161659
PubMed Abstract | Crossref Full Text | Google Scholar
5. Yu-Lee-Mateus A, Reisenauer J, Garcia-Saucedo JC, Abia-Trujillo D, Buckarma EH, Edell ES, et al. Robotic-assisted bronchoscopy versus CT-guided transthoracic biopsy for diagnosis of pulmonary nodules. Respirology. (2023) 28:66–73. doi: 10.1111/resp.14368
PubMed Abstract | Crossref Full Text | Google Scholar
6. Kothary N, Lock L, Sze DY, Hofmann LV. Computed tomography-guided percutaneous needle biopsy of pulmonary nodules: impact of nodule size on diagnostic accuracy. Clin Lung Cancer. (2009) 10:360–3. doi: 10.3816/CLC.2009.n.049
PubMed Abstract | Crossref Full Text | Google Scholar
7. Huang MD, Weng HH, Hsu SL, Hsu LS, Lin WM, Chen CW, et al. Accuracy and complications of CT-guided pulmonary core biopsy in small nodules: a single-center experience. Cancer Imaging. (2019) 19:51. doi: 10.1186/s40644-019-0240-6
PubMed Abstract | Crossref Full Text | Google Scholar
8. Zhao HC, Xu QS, Shi YB, Ma XJ. Clinical-radiological predictive model in differential diagnosis of small (≤ 20 mm) solitary pulmonary nodules. BMC Pulm Med. (2021) 21:281. doi: 10.1186/s12890-021-01651-y
PubMed Abstract | Crossref Full Text | Google Scholar
9. Chen G, Bai T, Wen LJ, Li Y. Predictive model for the probability of Malignancy in solitary pulmonary nodules: a meta-analysis. J Cardiothorac Surg. (2022) 17:102. doi: 10.1186/s13019-022-01859-x
PubMed Abstract | Crossref Full Text | Google Scholar
10. Yu W, Ye B, Xu L, Wang Z, Le H, Wang S, et al. Establishment of A clinical prediction model of solid solitary pulmonary nodules. Zhongguo Fei Ai Za Zhi. (2016) 19:705–10. doi: 10.3779/j.issn.1009-3419.2016.10.12
PubMed Abstract | Crossref Full Text | Google Scholar
12. Bogowicz M, Vuong D, Huellner MW, Pavic M, Andratschke N, Gabrys HS, et al. CT radiomics and PET radiomics: ready for clinical implementation? Q J Nucl Med Mol Imaging. (2019) 63:355–70. doi: 10.23736/S1824-4785.19.03192-3
PubMed Abstract | Crossref Full Text | Google Scholar
13. Liu A, Wang Z, Yang Y, Wang J, Dai X, Wang L, et al. Preoperative diagnosis of Malignant pulmonary nodules in lung cancer screening with a radiomics nomogram. Cancer Commun (Lond). (2020) 40:16–24. doi: 10.1002/cac2.12002
PubMed Abstract | Crossref Full Text | Google Scholar
14. Yang R, Hui D, Li X, Wang K, Li C, Li Z. Prediction of single pulmonary nodule growth by CT radiomics and clinical features - a one-year follow-up study. Front Oncol. (2022) 12:1034817. doi: 10.3389/fonc.2022.1034817
PubMed Abstract | Crossref Full Text | Google Scholar
15. Huang L, Lin W, Xie D, Yu Y, Cao H, Liao G, et al. Development and validation of a preoperative CT-based radiomic nomogram to predict pathology invasiveness in patients with a solitary pulmonary nodule: a machine learning approach, multicenter, diagnostic study. Eur Radiol. (2022) 32:1983–96. doi: 10.1007/s00330-021-08268-z
PubMed Abstract | Crossref Full Text | Google Scholar
16. Li GC, Fu YF, Cao W, Shi YB, Wang T. Computed tomography-guided percutaneous cutting needle biopsy for small (≤ 20 mm) lung nodules. Med (Baltimore). (2017) 96:e8703. doi: 10.1097/MD.0000000000008703
PubMed Abstract | Crossref Full Text | Google Scholar
17. Li Y, Wang T, Fu YF, Shi YB, Wang JY. Computed tomography-guided biopsy for sub-centimetre lung nodules: Technical success and diagnostic accuracy. Clin Respir J. (2020) 14:605–10. doi: 10.1111/crj.13172
PubMed Abstract | Crossref Full Text | Google Scholar
18. Portela de Oliveira E, Souza CA, Inacio JR, Abdelzarek M, Dennie C, Gupta A, et al. Imaging-guided percutaneous biopsy of nodules ≤1 cm: study of diagnostic performance and risk factors associated with biopsy failure. J Thorac Imaging. (2020) 35:123–8. doi: 10.1097/RTI.0000000000000427
PubMed Abstract | Crossref Full Text | Google Scholar
19. Chen W, Zhu D, Chen H, Luo J, Fu H. Predictive model for the diagnosis of benign/malignant small pulmonary nodules. Med (Baltimore). (2020) 99:e19452. doi: 10.1097/MD.0000000000019452
PubMed Abstract | Crossref Full Text | Google Scholar
20. Taralli S, Scolozzi V, Foti M, Ricciardi S, Forcione AR, Cardillo G, et al. 18F-FDG PET/CT diagnostic performance in solitary and multiple pulmonary nodules detected in patients with previous cancer history: reports of 182 nodules. Eur J Nucl Med Mol Imaging. (2019) 46:429–36. doi: 10.1007/s00259-018-4226-6
PubMed Abstract | Crossref Full Text | Google Scholar
21. Soardi GA, Perandini S, Larici AR, Del Ciello A, Rizzardi G, Solazzo A, et al. Multicentre external validation of the BIMC model for solid solitary pulmonary nodule Malignancy prediction. Eur Radiol. (2017) 27:1929–33. doi: 10.1007/s00330-016-4538-5
PubMed Abstract | Crossref Full Text | Google Scholar
22. Zhang R, Sun H, Chen B, Xu R, Li W. Developing of risk models for small solid and subsolid pulmonary nodules based on clinical and quantitative radiomics features. J Thorac Dis. (2021) 13:4156–68. doi: 10.21037/jtd-21-80
PubMed Abstract | Crossref Full Text | Google Scholar
23. Chen XB, Yan RY, Zhao K, Zhang DF, Li YJ, Wu L, et al. Nomogram for the prediction of Malignancy in small (8-20 mm) indeterminate solid solitary pulmonary nodules in chinese populations. Cancer Manag Res. (2019) 11:9439–48. doi: 10.2147/CMAR.S225739
PubMed Abstract | Crossref Full Text | Google Scholar
24. Li L, Guo C, Wan JL, Fan QS, Xu XL, Fu YF. The use of carcinoembryonic antigen levels to predict lung nodule Malignancy: a meta-analysis. Acta Clin Belg. (2022) 77:227–32. doi: 10.1080/17843286.2020.1797330
留言 (0)