
記住我
Systemic lupus erythematosus (SLE) is a female dominant autoimmune disease in which the autoreactive immune system causes inflammation and damage in multiple organs and tissues (1). CD38 expression on CD4+, CD8+, and CD25+ T cells was increased in SLE T cells and correlated with disease activity (2–5). Increased CD38 expression in T cells from patients with SLE may contribute to lupus pathogenesis because T cells produce Th1 and Th2 inflammatory cytokines when they are stimulated with CD38 antibodies (5). Increased CD38 expression greatly affects cellular metabolism by lowering intracellular NAD+ levels and decreasing NAD-dependent deacetylation performed by sirtuins (6). Thus, high levels of CD38 lead to decreased CD8 T-cell-mediated cytotoxicity and increased propensity to infections in patients with SLE (7). Moreover, CD38 reduces CD8+ T cell function by negatively affecting mitochondrial fitness (8). The relevance of these findings to lupus is that abnormal NAD-dependent deacetylation could be reverted pharmacologically or with anti-CD38 therapy (5, 9–11). Transcriptome analysis in a large number of SLE patients supported the prospect of CD38 inhibition for the treatment of SLE, corroborating the central role of plasma cells in SLE pathogenesis (12). In lupus models, this could also be approached by analyzing the functional effect of CD38 deficiency (13–16). Using the pristane lupus model, we have demonstrated the crucial role of CD38 in promoting aberrant inflammation and lupus-like autoimmunity via an apoptosis-driven mechanism, which requires TRPM2 expression (13). CD38 deficiency may improve lupus disease through an increase of IL-10-producing splenic regulatory B cells, which may cause a reduction of plasmacytoid dendritic cells and IFN-α production in the peritoneal cavity (14).
A chronic graft-versus-host reaction (cGVHD) induced in non-autoimmune C57BL/6 mice (B6) by the adoptive transfer of Ia-incompatible bm12 spleen cells results in a syndrome that closely resembles SLE in the spectrum of autoantibodies and immunopathology (17). In a previous paper we have shown that the absence of CD38 had a strong effect in the development of the bm12 cGVHD lupus model (18). Thus, there was a significant amelioration of the signs of the disease, including decreased expansion of T follicular helper (Tfh) cells, germinal center (GC) B cells, plasma cells, and Tbet+CD11chi B cells, while the expansion of regulatory T (Treg) cells and T follicular regulatory (Tfr) cells was normal, suggesting a defective response of Cd38-/- B cells to allogeneic help from CD38-suficient bm12 CD4+ T cells (18). Dysregulation of several cytokines and decreased protein abundance of STAT1 were also detected (18). Chronic autoimmune diseases such as SLE develop through positive feedback from inflammation. Among the cells involved in the inflammatory process, monocytes/macrophages could participate via a number of mechanisms. In this sense, CD38 expression in non-classical monocytes was recently linked to severe active SLE disease in a small group of patients (19). Moreover, it has been observed that lupus nephritis (LN) patients have an increased number of macrophages, whose CD38 expression is specifically activated and up-regulated, suggesting that CD38 might contribute to the regulation of LN development and progression by influencing immune responses (20). Therefore, it was of interest to analyze the transcriptomes of peritoneal exudate cells and spleen cells from cGVHD Cd38-/- mice vs WT mice to reveal the transcriptomic signatures and dysregulated pathways that are behind the distinct autoimmune response elicited in Cd38-/- mice vs WT mice (mild versus severe lupus disease). Transcriptomes of cGVHD affected mice along time were also compared with the transcriptomes of healthy controls to better understand the disease-state in a more dynamic approach, and to test whether in CD38-deficient mice there were signs of a faster resolution of the disease as suggested in our previous study. This approach has revealed a potential transcriptome signature in PECs that connects purinergic receptors with transcriptome signatures strongly associated with lupus such as the transcriptome signature of type I interferon-regulated genes, the cyclic GMP-AMP synthase-stimulator of interferon genes the cGAS-STING signaling pathway, and the NLRP3 inflammasome. This study also reveals a strong transcriptional reprogramming of metabolic pathways such as oxidative phosphorylation and thermogenesis in both PECs and spleen cells from cGVHD mice that may be related with the requirements for fast cell proliferation and cell differentiation in this lupus model.
2 Materials and methods2.1 MiceC57BL/6J (B6) (RRID: IMSR_JAX:000664) WT female mice were from Charles River. B6(C)-H2-Ab1bm12/KhEgJ (bm12) (RRID: IMSR_JAX:001162) female mice were from the Jackson Laboratory. B6.129P2-Cd38tm1Lnd/J (Cd38−/−) (RRID: IMSR_JAX:003727) female mice were backcrossed for 12 generations to the C57BL/6 J (B6) background and were provided by Dr. Frances Lund (UAB, Birmingham, USA). Cd38−/− mice were bred and maintained under specific pathogen-free conditions at the IPBLN-CSIC Animal Facility in Granada, Spain. The experimental procedures in animals at IPBLN-CSIC, Spain were approved by the Institutional Animal Care and Use Committee. The procedures follow the ARRIVE guidelines (21), and in accordance with the U.K. Animals (Scientific Procedures, Act, 1986) and associated guidelines (EU Directive 2010/63/EU for animal experiments and RD53/2013); and further revisions (Commission Delegated Directive, EU 2024/1262), and with the National Institutes of Health guide for the care and use of Laboratory animals (NIH Publications No. 8023, revised 1978).
2.2 The cGVHD inducible lupus model in C57BL/6 miceIn this model donor CD4+ T cells react to host B cells triggering the polyclonal activation of autoreactive B cells, and eventually, lupus-like syndrome (22). The procedure was described previously (18). We adapted the bm12 transfer model, as originally described by Morris et al. (23), and modified by Klarquist and Jansen (24). Eight to eighteen weeks-old B6 WT or Cd38−/− female mice were injected i.p. with 70-100 × 106 isolated spleen cells from bm12 female mice as described (24). Both WT and Cd38-/- mice were adoptively transferred with bm12 CD38-sufficient spleen cells that contain an average of 20% of allo-reactive donor bm12 CD4+ T cells, which were fully functional (18, 24). Although experiments reported in the first description of the bm12 model found no significant difference in any disease parameter between male→male and female→female transfers (23), only female were used because SLE is a female dominant autoimmune disease (7, 25).
2.3 Spleen cells and peritoneal exudates cellsSpleen and PECs were harvested from mice after the sacrifice by inhalation of CO2, under sterile conditions, at 2 and 4 weeks post a chronic graft-versus-host reaction (cGVHD) induced in non-autoimmune C57BL6 (B6) female mice WT or Cd38-/-, by the adoptive transfer of Ia-incompatible bm12 spleen cells that results in a syndrome that closely resembles SLE in the spectrum of autoantibodies and immunopathology (17). PECs were obtained after i.p. injection of 5-6 ml of 1x Ca2+ and Mg2+ free PBS, pH 7.6, 0.5% BSA, 2 mM EDTA, 0.22 μm sterile filtered; followed by a gentle massage of the abdominal cavity. We collected peritoneal exudates (PE) containing PECs from the abdominal cavity by means of a small incision, with p1000-pipette sterile tips, into separate 15 ml sterile Falcon type tubes for each mouse. 15 ml-tubes were kept on ice, next they were spun down at 360 x g, 4˚C for 5 min, to isolate PECs in the cellular pellet. The spleens were obtained and SPC prepared as described (24). Cellular pellets containing either SPC or PECs were treated (1:2, v:v) with Ammonium Chloride Solution (STEMCELL Technologies, Ammonium Chloride 07850_07800), 5 min on ice; followed by 8.5 ml of DMEM complete medium, containing 5% heat inactivate Fetal Bovine Serum (FBS), pen: strep, 100 units/ml/10 microg/ml; 10 mM Hepes, 1X L glutamax, 2mM EDTA and 0.22 μm sterile filtered. SPC were spun down at 400 x g, 4˚C for 5 min, and PECs were spun down at 360 x g, 4˚C for 5 min. The supernatants were aspirated and a fresh DMEM complete medium was added to resuspend the cellular pellets. The experiments were repeated minimum three times. Three to 5 mice WT or Cd38-/- were included accordingly in each experiment. Isolated SPC and PECs were count and viability was analyzed on a hemocytometer with 1:1 Trypan blue solution (Sigma-Aldrich Cat# T8154). Spleen cells and PECs were washed thoroughly three times with cold 1x Ca2+ and Mg2+ free PBS, pH 7.6, 2 mM EDTA (filter sterilized in 0.22 mm filter); by centrifugation as indicated above (26).
2.4 Flow cytometrySingle cell suspensions of WT and Cd38-/- PECs were stained with the indicated anti-mouse antibodies (Supplementary Table S1) separated in different panels after blocking nonspecific binding with anti-mouse CD16/32 (BD Biosciences Cat# 553142, RRID: AB_394657), 1:200 dilution for 30-60 min, on ice, in staining media (1x PBS, w/o calcium or magnesium, 0.5% BSA, 2 mM EDTA, sterilized by means of 0.22 μm filter). Panel #2 (CD45R/B220-PE; CD11b-APC; CD4-BV480, and CD5-PerCP) was used to identify B1 cells, B2 cells, CD4+ T cells and macrophages. Panel #4 (F4/80-APC; CD11b-FITC, Ly6C-PE, and Ly6G-PerCP-Cy5.5) was used to identify large and small macrophages, Ly6Chi monocytes and neutrophils. Each analyzed PEC sample corresponds to an individual mouse, either WT or Cd38-/-, from the corresponding experiment. Flow cytometry analyses at IPBLN-CSIC were performed as previously described (13). Ten thousand to 200.000 events per sample were acquired either in a FACSCalibur flow cytometer (BD Biosciences, RRID: SCR_000401), FACSaria III, or FACS Symphony (BD Biosciences) and analyzed with FlowJo software v10.10.0 (BD Biosciences) (FlowJo, RRID: SCR_008520). In each experiment, single cell suspensions of bm12 spleen cells were stained with panel #1 (TCR-β-FITC; CD4-PerCP-Cy5.5; CXCR5-biotin; Streptavidin-PE, and PD1-APC) to evaluate the numbers of allo-reactive donor bm12 CD4+ T cells that were adoptively to transferred to WT and Cd38-/- mice respectively, as previously described (18). Statistical analyses were performed using the GraphPad Prism 9 and 10.1.1 software (GraphPad Prism, https://www.graphpad.com/), using statistical tests as indicated in the text. Statistical significance was visualized as follows: ns = not significant (P > 0.05), * = P < 0.05, ** = P < 0.01, *** = P < 0.001, **** = P < 0.0001. All experiments have been done using three or more mice and representative images have been chosen for the figures.
2.5 RNA purification, library preparation and Illumina sequencingRNA purification, library preparation and Illumina sequencing were carried out at the IPBLN Genomics Facility (CSIC, Granada, Spain). 5-10 x106 washed and pelleted PECs and SPC, respectively, were lysed with RLT buffer (Qiagen, Cat number7926, Hilden, Germany) containing 1% beta-mercaptoethanol and following manufacturer guidelines. Cell lysates were immediately frozen in dry ice and kept at -80°C. Automated total RNA extraction was performed using RNeasy® kit reagents and QIAcube® robot (Qiagen). The RNA quality was evaluated by Bioanalyzer RNA 6000 Nano chip electrophoresis (Agilent Technologies) for a total of 62 RNA samples. Based on RNA quality and yield, 35 RNA samples were chosen, with RIN values of 10.51+/- 1.66 (mean +/- sem). Selected samples (Supplementary Table S2) included three biological replicates for every condition except for PECs from WT mice 4 weeks after the adoptive transfer of bm12 lymphocytes with two biological replicates. Each analyzed SPC sample corresponded to an individual mouse spleen, while each PEC sample was a pool of 2 or 3 mice from the corresponding experiment. RNA-seq libraries were prepared using Illumina mRNA stranded ligation kit (Illumina®) from 200 ng of input total RNA. Quality and size distribution of PCR-enriched libraries were validated through Bioanalyzer High Sensitivity DNA assay and concentration was measured on the Qubit® fluorometer (Thermo). Final libraries were pooled in an equimolecular manner and then diluted and denatured as recommended by Illumina NextSeq® 500 library preparation guide. The 72x2 nt paired-end sequencing was conducted on a NextSeq 500® system with a final total output of 196 Gb and a quality score (Q30) of 91%.
2.6 Data analysisThe miARma-Seq pipeline, as detailed by Andres-Leon et al. (27, 28), was employed for the analysis of transcriptomic samples. This comprehensive workflow encompasses all stages from raw data processing to the calculation of differentially expressed genes (DEGs). Initially, the quality of raw data was assessed using FastQC software (29) to evaluate read quality. Following sample filtering, an average guanine-cytosine content of 51% and an average of 17M reads per sample were obtained, with no observed adapter accumulation or poor quality reads (q<30). Subsequently, Seqtk software (30) was utilized to standardize the number of reads per sample.
In the subsequent stage, miARma-Seq employed STAR (31) to align all sequences, resulting in 90.45% of properly aligned reads. For this purpose, the Mus musculus Gencode version M28 genome-build: mmGRCm28.p6 was utilized. Following alignment, featureCounts software (32) as utilized to map sequence reads to genes using reference gene annotation obtained from Gencode, based on the same assembly and genome build.
2.7 Differential expressionDifferential expression analysis was conducted using the edgeR package (33). Genes that showed no expression (0 aligned reads across all samples) were removed, and the remaining genes were normalized using the trimmed mean of M-values (TMM) method (34). Additionally, reads per kilobase per million mapped reads (RPKM), counts per million (CPM), and log2-counts per million (log-CPM) were calculated for each gene in every sample (33). To assess the replicability of the samples, Principal Component Analysis (PCA) and Hierarchical Clustering of normalized samples were employed to provide a comprehensive overview of the similarity among RNA-sequencing samples (35, 36) (See Supplementary Figure S1). Differential expression analysis was performed between genes with a False Discovery Rate (FDR) value <0.05 were identified as DEGs. Additionally, the log2-fold change (log2FC) was utilized to assess the significance and magnitude of gene expression alterations between the two sample types. Several R packages are used to visualize our data effectively. Specifically, we used ‘ggplot2’ to create a Volcano plot in addition to the pheatmap and heatmaply packages taking advantage of their capabilities to generate heat maps with clustering settings. Data presented in the study are available at the Sequence Read Archive (SRA), BioProject PRJNA1118233.
2.8 EnrichmentGene ontology (GO) enrichment analyses were evaluated for biological process ontology terms, molecular functions, and cellular components using the R clusterprofiler package (37). To identify the most relevant GO terms, the “Revigo” tool was used, using the R package rrvigo (38), which simplifies the visualization of functional enrichment results. For pathways analyses, Kyoto Encyclopedia of Genes and Genomes (KEGG; https://www.kegg.jp) canonical pathway database was used (39). To visualize shared and unique KEGG pathways for the different comparatives, Venn diagrams were generated using the online application Venny 2.1 (40). The heat-map displays the mean log2FC (logarithmic fold change) values calculated using edgeR, based on RNA-seq analysis of differential expression between experimental conditions log2FC values calculated using edgeR. The log2FC values were computed as the log2 ratio of normalized counts between the compared conditions. Each row represents a differentially expressed gene, while each column corresponds to one of the indicated pairwise comparisons performed. The values shown are the averages for each experimental condition (n is the number of biological replicates per condition, see Supplementary Table S2). Otherwise indicated, only genes with a log2FC greater than 2 or less than -2, in at least one comparison were represented in the heat-maps. The color scale reflects the magnitude and direction of gene expression changes: Red: Significant upregulation (positive log2FC values), Blue: Significant downregulation (negative log2FC values). Rows (genes) and columns (comparisons) are hierarchically clustered using Euclidean distance and the complete linkage method, grouping genes and conditions with similar expression patterns. This visualization highlights biologically meaningful changes associated with the specific GO or KEGG functional term under investigation.
2.9 Cd38 gene expressionWe found Cd38 gene expression values in the count array of the Cd38-deficient samples, therefore, we decided to represent the alignment of the Cd38 gene to check the coverage of these samples for this gene. We confirmed for CD38-deficient samples that no coverage was detected for exons 2 and 3 of the gene (Supplementary Figure S2), in comparison with the coverage of WT samples (Supplementary Figure S2, last track). As previously reported by other authors, these were the 2 exons deleted in the Cd38-/- mouse strain (41). Therefore, the expression of the Cd38 gene in the CD38-deficient samples may come from the residual expression of the non-deleted exons of Cd38 and, consequently, it does not lead to the functional production of the gene.
3 Results3.1 Distinctive transcriptional profiling of cGVHD Cd38-/- PECs vs cGVHD WT PECs reveals significant differences in the cell subsets populating the peritoneal cavity of these miceIn a previous paper we have shown that in the absence of CD38 there was a significant amelioration of the signs of the disease in the cGVHD-lupus model, including decreased expansion of Tfh cells, GC B cells, plasma cells, and Tbet+CD11chi B cells, while the expansion of Treg cells and Tfr cells was normal, suggesting a defective response of Cd38-/- B cells to allogeneic help from bm12 CD4+ T cells (18). Therefore, it was of interest to test whether these features had a distinct gene expression profile. RNA sequencing was used to analyze the transcriptome of PECs and SPC from Cd38-/- mice and WT mice 2, and 4 weeks after the induction of the disease (see workflow in Figure 1A).
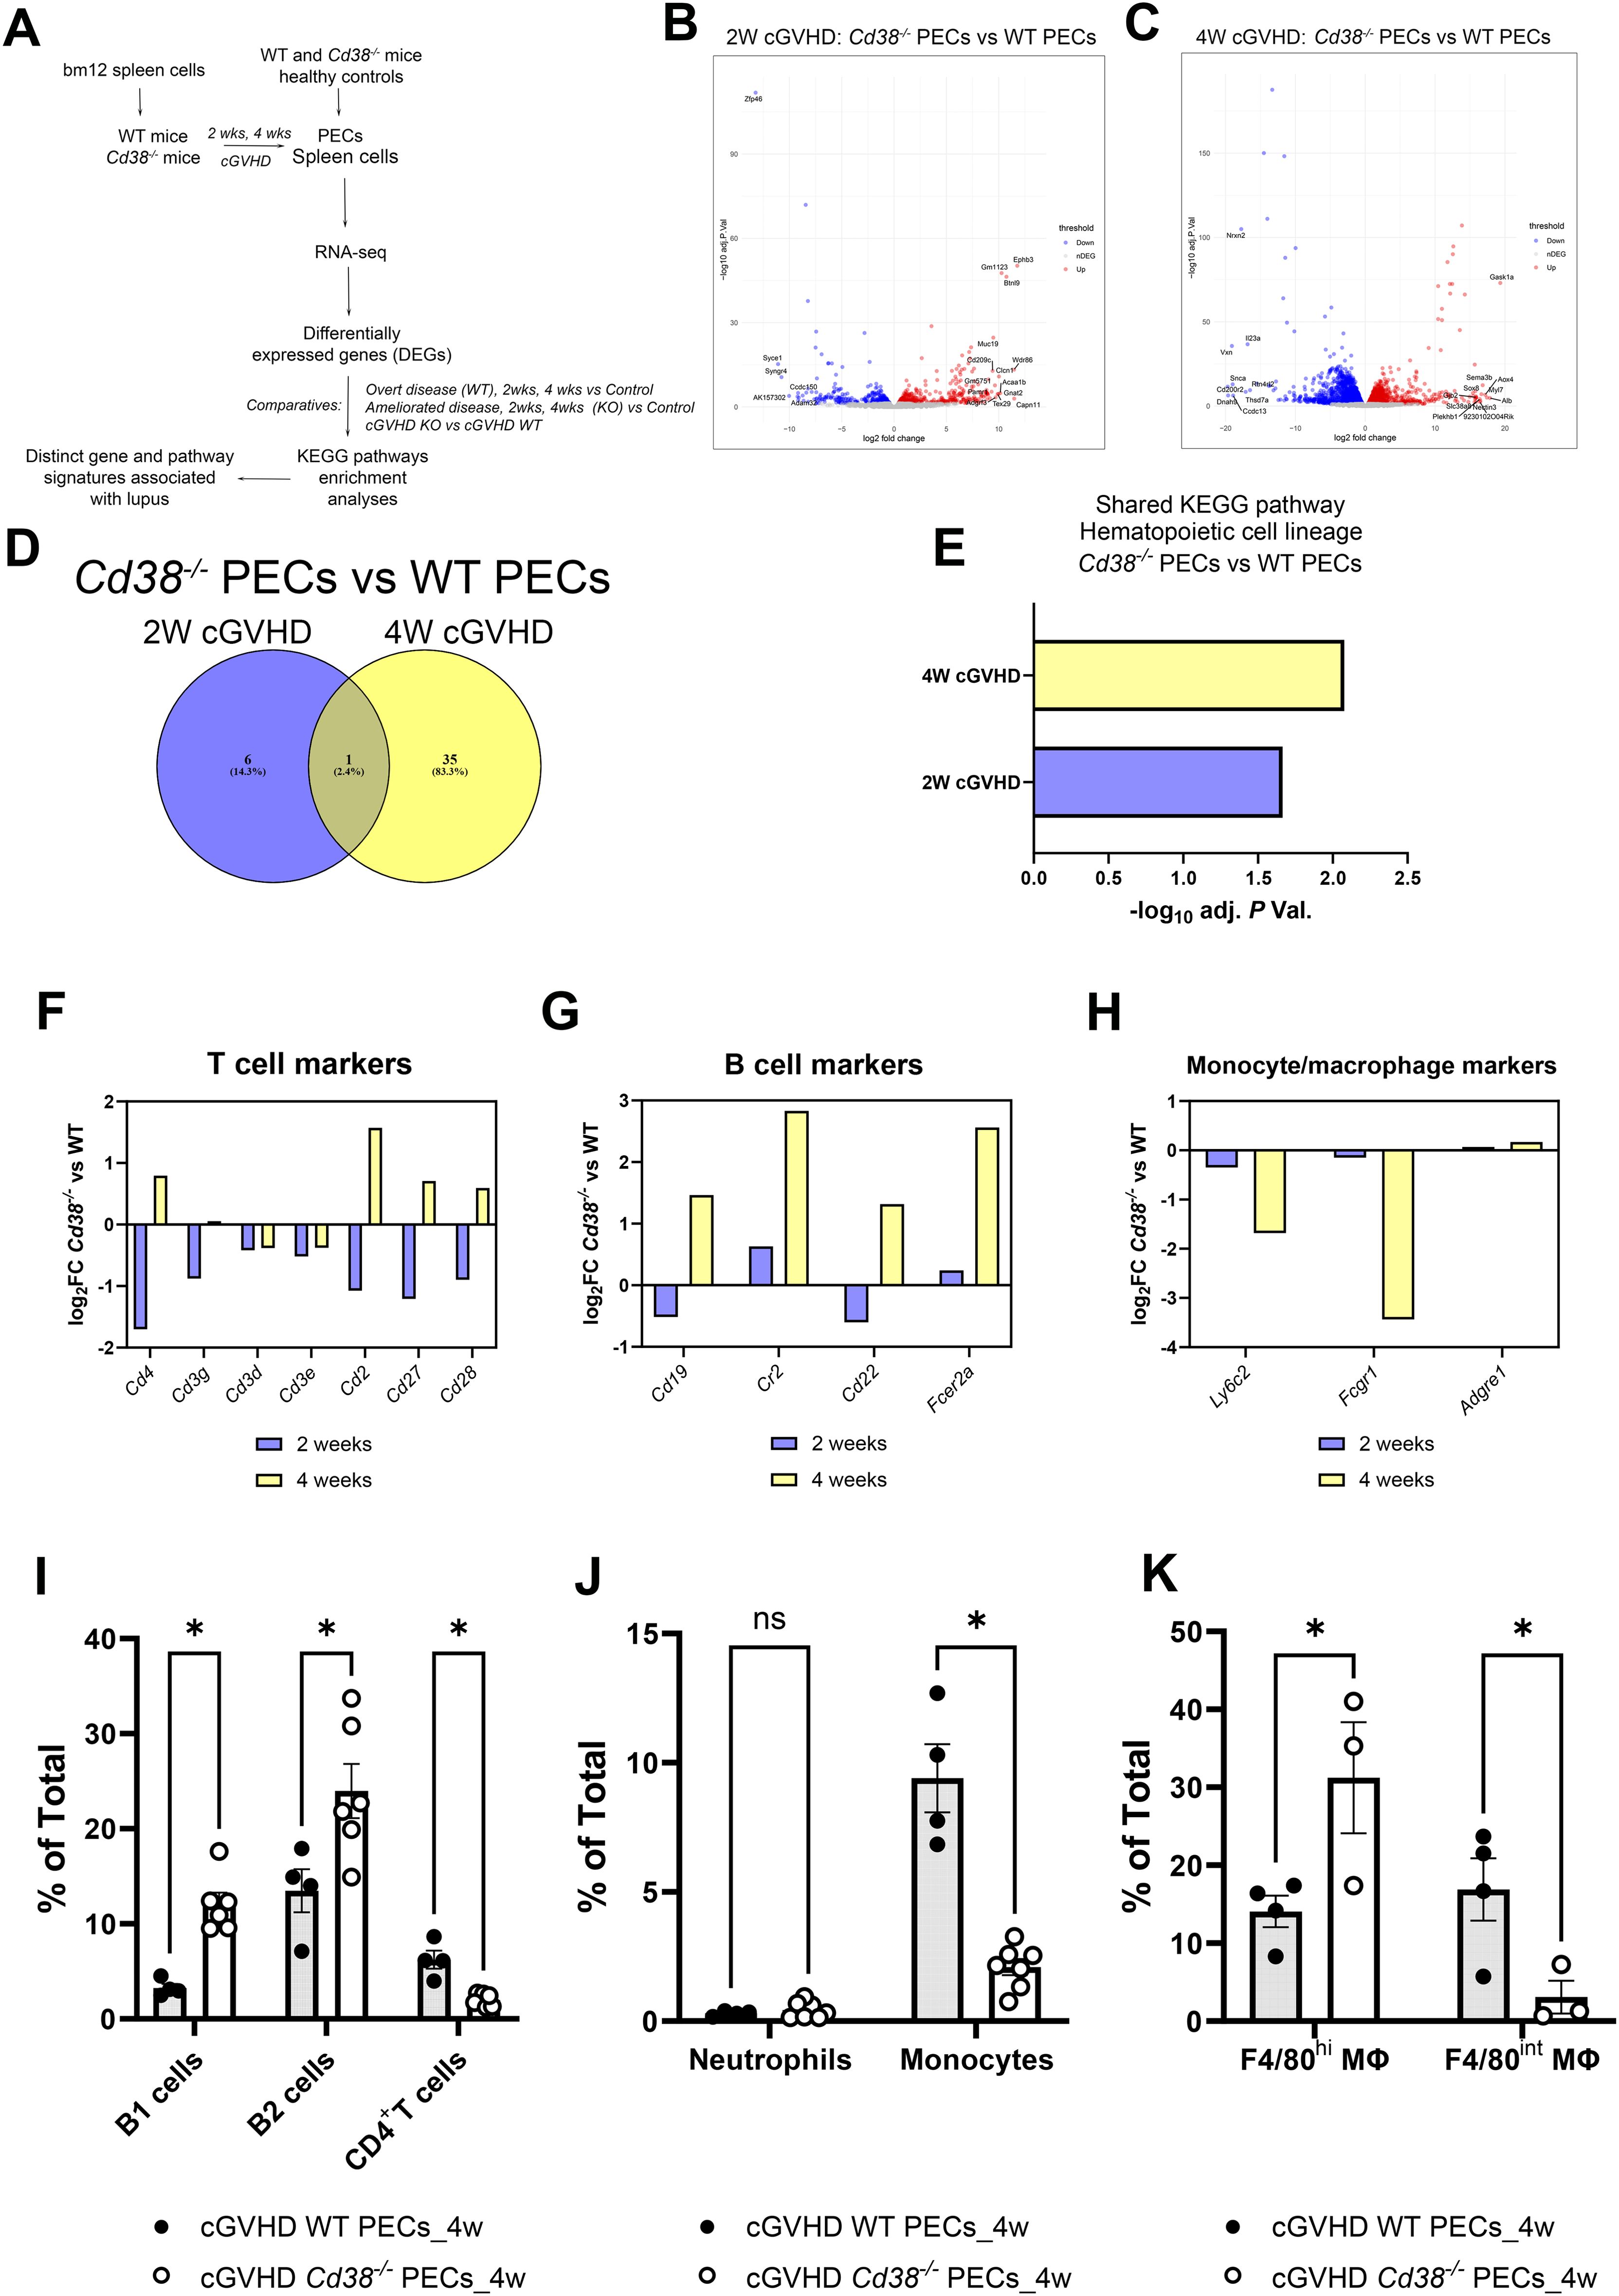
Figure 1. (A) Workflow of the experiments and analyses performed in this study. (B) Volcano plots showing upregulated DEGs (red dots) and downregulated DEGs (blue dots) of the 2-week comparative in PECs from cGVHD Cd38-/- vs cGVHD WT mice. (C) Volcano plot showing upregulated DEGs (red dots) and downregulated DEGs (blue dots) of the 4-week comparative in PECs from cGVHD Cd38-/- vs cGVHD WT mice. In both panels gene names are displayed for top DEGs. (D) Venn diagram showing the number of enriched KEGG pathways shared by the 2 comparatives, and those that were exclusively enriched at 2 weeks, or at 4 weeks of the allogeneic challenge. (E) Histograms represent the statistical significance of the hematopoietic cell lineage KEGG pathway shared by the 2 comparatives. (F) Log2 fold-changes in the expression of T cell markers genes in PECs at 2 weeks (violet bars) and 4 weeks (yellow bars) of the allogeneic challenge. (G) The same as in the (F) for B cell markers. (H) The same as in (F, G) for monocyte/macrophages markers. (I) Frequencies of B1 cells, B2 cells and CD4+ T cells in PECs from cGVHD WT mice and cGVHD Cd38-/- mice, 4 weeks after the allogeneic challenge. (J) Frequencies of neutrophils and pro-inflammatory Ly6Chi monocytes in PECs of the same comparative as in (I). (K) Frequencies of F4/80high and F4/80int macrophages in PECs of the same comparative as in (I). Samples in (I–K) were analyzed by flow cytometry with specific markers as described in materials and methods. In (I–K): ns, not significant (P > 0.05), * = P < from 0.01 to 0.05.
Two weeks after the adoptive transfer of bm12 into mice, 1727 DEGs were identified between Cd38-/- PECs and WT PECs (Figure 1B, Supplementary Table S3). Four weeks after the adoptive transfer, the number of DEGs increased up to 7301 (Figure 1C, Supplementary Table S4), indicating increased divergence in their transcription profile between Cd38-/- PECs and WT PECs. This increased divergence was even more evident when these DEGs were subjected to various enrichment analyses. Thus, there were 7 enriched KEGG pathways at 2 weeks, which increased up to 36 KEGG pathways at 4 weeks (Supplementary Tables S5, S6). Venn diagrams showed that only one pathway was shared between the 2 comparatives (Figure 1D). This was hematopoietic cell lineage (Figure 1E), which at 2 weeks showed decreased expression of genes such as Cd4, Cd7, Cd5, Il5, Cd3g, Cd2, Cd36, and Cd44 in Cd38-/- vs WT PECs (Supplementary Table S5), many of them are T cells markers (Figure 1F). In this sense, decreased frequencies and numbers of CD11b-B220-CD4+ cells were observed by flow cytometry analysis (data not shown). To note is that, although not included in this KEGG pathway, we also observed significant decreased expression of Cd28, and Cd27 genes in the 2-week comparative (Figure 1F). CD27 is expressed on both naïve and activated effector T cells, as well as on NK cells or activated B cells and plasma cells, and its expression is altered in SLE patients in various cell subsets (42–46). CD28 is one of the proteins expressed on T cells that provide co-stimulatory signals required for T cell activation and survival. In SLE patients lack of CD28 expression in specific T cell subsets may define their functional capabilities (47–50). Overall, these data may be indicative of decreased numbers of activated CD4+ T cells, and another unidentified CD4+ T cell subsets in the 2-week comparative.
In the 4-week comparative the hematopoietic cell lineage pathway showed 21 upregulated genes in Cd38-/- vs 17 in WT PECs, which made uncertain to predict any preponderance (Supplementary Table S6). A closer examination of the pathway indicated that gene markers of the T cell lineage, such as Cd4, Cd2, Cd27, Cd28 (Figure 1F), and of the B cell lineage, such as Cd19, Cr2, Cd22, and Fcer2 (Figure 1G) were upregulated in Cd38-/- PECs.
To better identify the major immune cell subsets from the lymphoid and myeloid lineages present in the peritoneal cavity after the allogeneic challenge, we used different multicolor flow cytometry antibody panels. We were able to identify the following subsets: B1 cells, B2 cells, macrophages (large and small), neutrophils, Ly6Chi monocytes, Ly6Clo monocytes, and CD4+ T cells (Supplementary Figures S3, S4).
In this sense, we observed by flow cytometry analysis increased proportions of B1 and B2 cells in Cd38-/- PECs vs WT PECs (Figure 1I, Supplementary Figure S3). In contrast, the proportion and numbers of CD4+ T cells were significantly lower in Cd38-/- PECs vs WT PECs (Figure 1I, Supplementary Figure S3, and data not shown), in apparent contradiction with the upregulated Cd4 gene expression (Figure 1F). Therefore, Cd4 gene expression in Cd38-/- PECs relative to WT PECs did not reflect its protein abundance or distribution within the CD4+ T cells detected by flow cytometry. We speculated that other cell subsets, such as a CD4+DEC-205loCD11bhi splenic DC subpopulation, which express high levels of CD4 RNA transcripts, and protein on its surface (51) might be present in PECs, although this required further investigation.
To note is that the proportion and numbers of pro-inflammatory Ly6Chi monocytes were significantly lower in Cd38-/- PECs than in WT PECs 4 weeks after cGVHD induction (Figure 1J, Supplementary Figure S4, and data not shown), which was in agreement with the decreased expression of Ly6c2, the gene that encodes the Ly6C protein (Figure 1H). Other gene markers, which are predominant in monocytes/macrophages, and neutrophils, were downregulated (Fcgr1, Tnf, Anpep, Il3ra, Il1r1, Il6ra), or not differentially expressed (Adgre1) (Figure 1H, Supplementary Table S6). Although the proportion of macrophages in Cd38-/- PECs was not significantly different to that in WT PECs, we asked whether there were significant differences in the proportion of large peritoneal macrophages (LPMs), and small peritoneal macrophages (SPMs) (52). The LPM subset expresses high levels of the canonical macrophage surface markers, F4/80 and CD11b, while the SPM subset expresses substantially lower levels of CD11b and F4/80 (52). In our study, the proportion of F4/80hi LPMs was significantly higher in Cd38-/- PECs than in WT PECs, while the proportion of F4/80int SPMs was significantly lower (Figure 1K, Supplementary Figure S4). Since SPMs are originated from recruited pro-inflammatory Ly6Chi monocytes to the peritoneal cavity during inflammatory conditions (52, 53), and both Ly6Chi monocytes and SPMs are significantly augmented in the peritoneal cavity of WT mice relative to Cd38-/- mice 4 weeks after the cGVHD induction, our data are compatible with the induction of a stronger inflammatory response in the peritoneal cavity of WT mice than in Cd38-/- mice.
3.2 The transcriptional profile in cGVHD Cd38-/- PECs relative to cGVHD WT PECS revealed a decreased immune and inflammatory response at 4 weeks of the allogeneic challengeOne of the KEGG pathways that was enriched in the 2-week comparative was the oxytocin signaling pathway (Figure 2A, Supplementary Table S5), where key elements were downregulated in Cd38-/- vs WT, including ryanodine receptors 2 and 3 (Ryr2 and Ryr3), that together with decreased expression of Cacna2d2, Plcb1 and Itpr1, are molecules involved in Ca2+ homeostasis and Ca2+-dependent signaling pathways (54–59). Some of the other enriched pathways such as salivary secretion, vascular smooth muscle contraction, and adrenergic signaling in cardiomyocytes shared many of these genes related with Ca2+-mediated signaling, either RyR-mediated or IP3-dependent mechanisms, or both (Figure 2A). In this sense, 4 out of the 8 GO BP enriched terms were related with calcium ion homeostasis and calcium-mediated signaling (data not shown). CD38 has been identified as an essential component for the rise in intracellular Ca2+ and oxytocin secretion (60, 61).
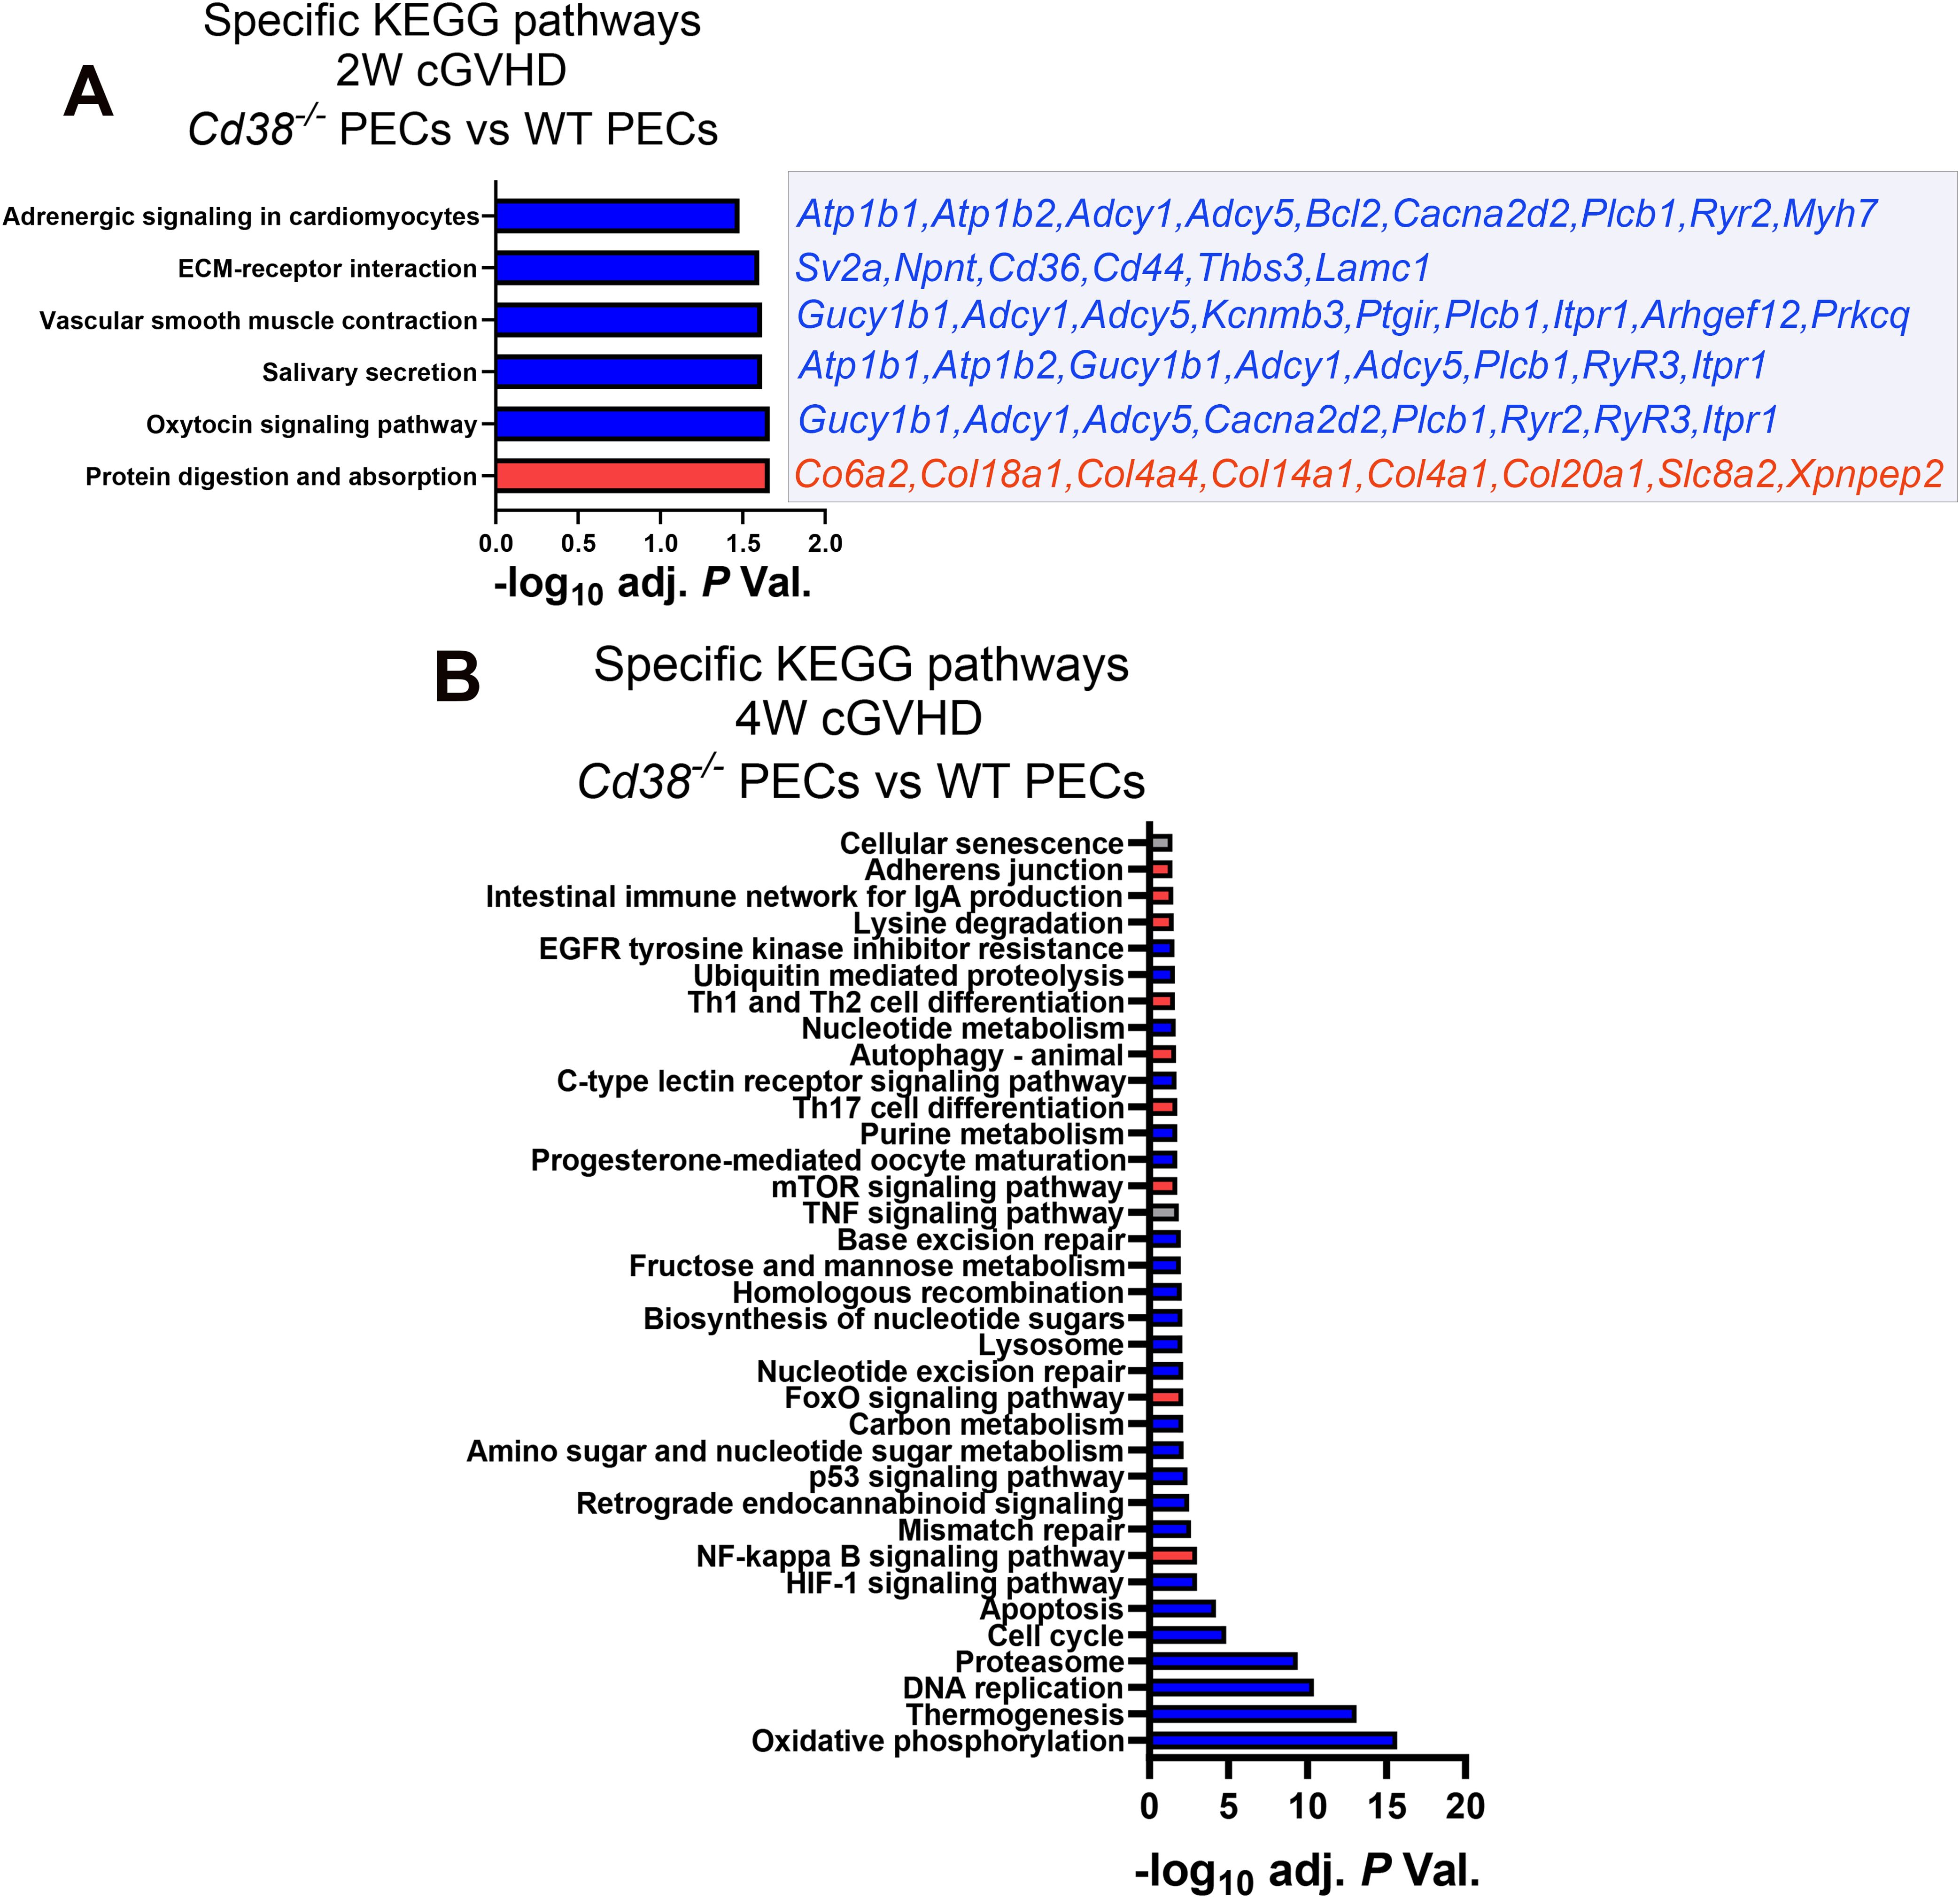
Figure 2. (A) Specific KEGG pathways of the 2-week comparative in PECs from cGVHD Cd38-/- vs cGVHD WT mice. Blue bars indicate pathways with ≥ 55% of downregulated genes. Red bars indicate pathways with ≥ 55% upregulated genes. Downregulated (blue) or upregulated (red) DEGs contributing to each pathway are listed on the right side of each bar. (B) Specific pathways of the 4-week comparative in PECs from cGVHD Cd38-/- vs cGVHD WT mice. In both panels blue bars indicate pathways with ≥ 55% of downregulated genes, and red bars indicate pathways with ≥ 55% upregulated genes. Grey bars in (B) indicate pathways with both upregulated and downregulated genes ≤ 54%, X axis represent the level of statistical significance (-log10 adjusted P value).
At 4 weeks, a larger number of genes related with oxidative phosphorylation, thermogenesis, DNA replication, proteasome, cell cycle, apoptosis, HIF-1, and p53 signaling pathways were downregulated in Cd38-/- relative to WT PECs, whereas a larger number of genes related with NF-κB, FOXO and mTOR signaling pathways were upregulated in Cd38-/- compared with WT PECs, together with genes involved in Th17 cell differentiation, autophagy, and Th1/Th2 cell differentiation (Figure 2B, Supplementary Table S6). Within the Th1/Th2 cell differentiation pathway, genes related with Th2 cell differentiation were upregulated in Cd38-/- PECs (Jak1, Stat6, Gata3), while Th1-related genes were downregulated (Ifng, Ifngr2, Jak1/2, Stat1), suggesting differential transcriptional regulation of these T cell subsets in Cd38-/- PECs vs WT PECs. Regarding Th17 cell differentiation, upregulated expression of Rora and Rorc genes was observed in Cd38-/- PECs relative to WT PECs. The proteins encoded by these genes, RORα and RORγt are essential for Th17 cell differentiation (62, 63). In contrast, Il12rb1, Il23a, Foxp3, Stat1, Il27, Ifngr2, Ifng, Rxrg, Il21r, and Fos genes, which are important for long-term Th17 cell survival and expansion (64–68), were downregulated in Cd38-/- PECs relative to WT PECs, which may be indicative of diminished survival capacity of Cd38-/- Th17-derived cells upon cGVHD induction.
Another interesting enriched KEGG pathway in the 4-week comparative was cellular senescence (Figure 2B). In Cd38-/- PECs, 30 out of 62 genes were upregulated and 32 genes were downregulated, which made difficult to assign this process to Cd38-/- or to WT (Supplementary Table S6). According with KEGG pathway database (https://www.kegg.jp/entry/mmu04218), in this pathway converged several signaling pathways. Therefore, it was of interest to search for differences in gene expression within each of these more specific pathways (Supplementary Table S6). Thus, genes associated to FOXO and mTOR signaling pathways were significantly upregulated in Cd38-/- PECs relative to WT PECs, while genes associated to calcium and p53 signaling pathways, cell cycle arrest, senescence-associated heterochromatin foci (SAHFs), and to senescence-associated secretory phenotype (SASP) were downregulated. The p53 signaling pathway elicits cell cycle arrest, and transcriptional activation of SAHF and SASP are key factors in senescence-associated inflammation (69, 70). Thus, significant decreased expression of Il1a, Ccl2, Tnf, and Serpine1 genes, which are representative members of SASP components, was observed in Cd38-/- PECs relative to WT PECs (Supplementary Tables S4, S6). In contrast, Tgfb2, Tgfbr2, and Cdkn2b genes were upregulated. Tgfb2 encodes TGF-β, and Tgfbr2 encodes its receptor. TGF-β potently inhibits cell cycle progression at the G1 phase. Cdkn2b expression is induced by TGF-β, and encodes the cyclin-dependent kinase 4 inhibitor (p15) that is a potent inhibitor of cell cycle (71). In contrast, another inhibitor of cell cycle, Cdkn1a, which encodes p21, was downregulated. p21 is capable of inactivating all cyclin-dependent kinases (CDKs), thereby inhibiting cell cycle progression (72). To note is the downregulation of several cyclins, and CDKs, as well as the growth arrest and DNA damage inducible alpha (Gadd45a) and gamma Gadd45g), which are key elements in the control of cell cycle arrest via the p53-p21 pathway. Gene expression of other members of the p53-p21 pathway, such as E2f, Mybl2, Foxm1, and Ln9 was downregulated, while Rbl2, which a potent inhibitor of E2F-trans-activation was upregulated (73). Likewise, increased Sirt1 gene expression was detected in this 4-week comparative in Cd38-/- PECs, which is associated with protection from senescence via deactivation of p53 signaling (74). Therefore, the transcriptional data were compatible with an expected decreasing occurrence of cellular senescence in Cd38-/- PECs relative to WT PECs in cGVHD mice.
3.3 Differential gene expression of purinergic receptors, purinergic ectoenzymes, and signaling molecules involved in purinergic signaling pathways in Cd38-/- PECs relative to WT PECs after the cGVHD inductionAt 4 weeks of the cGVHD induction several metabolic pathways, including purine metabolism, and nucleotide metabolism appeared downregulated in Cd38-/- PECs relative to WT PECs (Figure 2B). Regarding the purine metabolism pathway, several genes encoding nucleotide-metabolizing ectoenzymes, which are involved in the extracellular metabolism of purines, were differentially expressed, including the ectonucleotide triphosphate diphosphohydrolase 5, Entpd5, which showed increased expression in this comparative, the ectonucleotide pyrophosphatase/phosphodiesterase family member 4, Enpp4, and adenosine deaminase, Ada, which both showed decreased expression (Supplementary Table S6). Since signaling through purinergic receptors is controlled by nucleotide-metabolizing ecto-enzymes, which regulate the availability of extracellular nucleotides, these findings prompted us to assess the differential expression of other genes related with purine metabolism, which are not included in the KEGG pathway, but are important key-players in inflammatory/anti-inflammatory processes (75). We focused our interest in the gene expression of P2X and P2Y purinergic receptors (P2rx and P2ry), adenosine receptors (Adora), ectoenzymes, including ecto-nucleoside triphosphate diphosphohydrolases (Entpd, CD39 family), 5’ ectonucleotidases (Nt5, CD73 family), ecto-nucleotide pyrophosphatase/phosphodiesterases (Enpp, CD203a family), ADP-ribosyltransferases (Art2a and Art2b), Cd38, and Ada. Last, we included in this search a number of genes encoding down-stream molecules which may be involved in purinergic receptor signaling. As shown in Figure 3A, unsupervised hierarchical heat-map representation of the log2FC of the selected genes in 12 comparatives showed a major cluster of 27 genes, which included 9 purinergic receptor genes such as P2ry14, P2rx1, P2ry1, P2ry2, P2rx7, P2rx4, P2ry12, P2ry6, and P2ry13; the ectonucleotidases Entpd1, Entpd3, Enpp2, Enpp4, Enpp5, Entpd7, Enpp6, and Nt5e; and other 5’-nucleotidases located in the cytosol or mitochondria such as Nt5dc2, Nt5c3a, and Nt5m; the adenosine receptors Adora2b and Adora3; the Adenosine deaminase, Ada; the T-cell ecto-ADP-ribosyltransferases Art2a and Art2b, and the signaling molecules, Cgas, Sting1, Isg15 and Irf7, suggesting a similar pattern of expression. Moreover, this cluster showed upregulated expression in cGVHD PECs samples relative to Controls, in particular in WT PECs. In contrast, in SPC, this cluster of genes showed a more heterogeneous response, with less numbers of upregulated purinergic receptors, ectonucleotidases, and signaling molecules, but with increased expression of specific genes with clearly different kinetics than in PECs, which suggested a distinct pattern of expression.
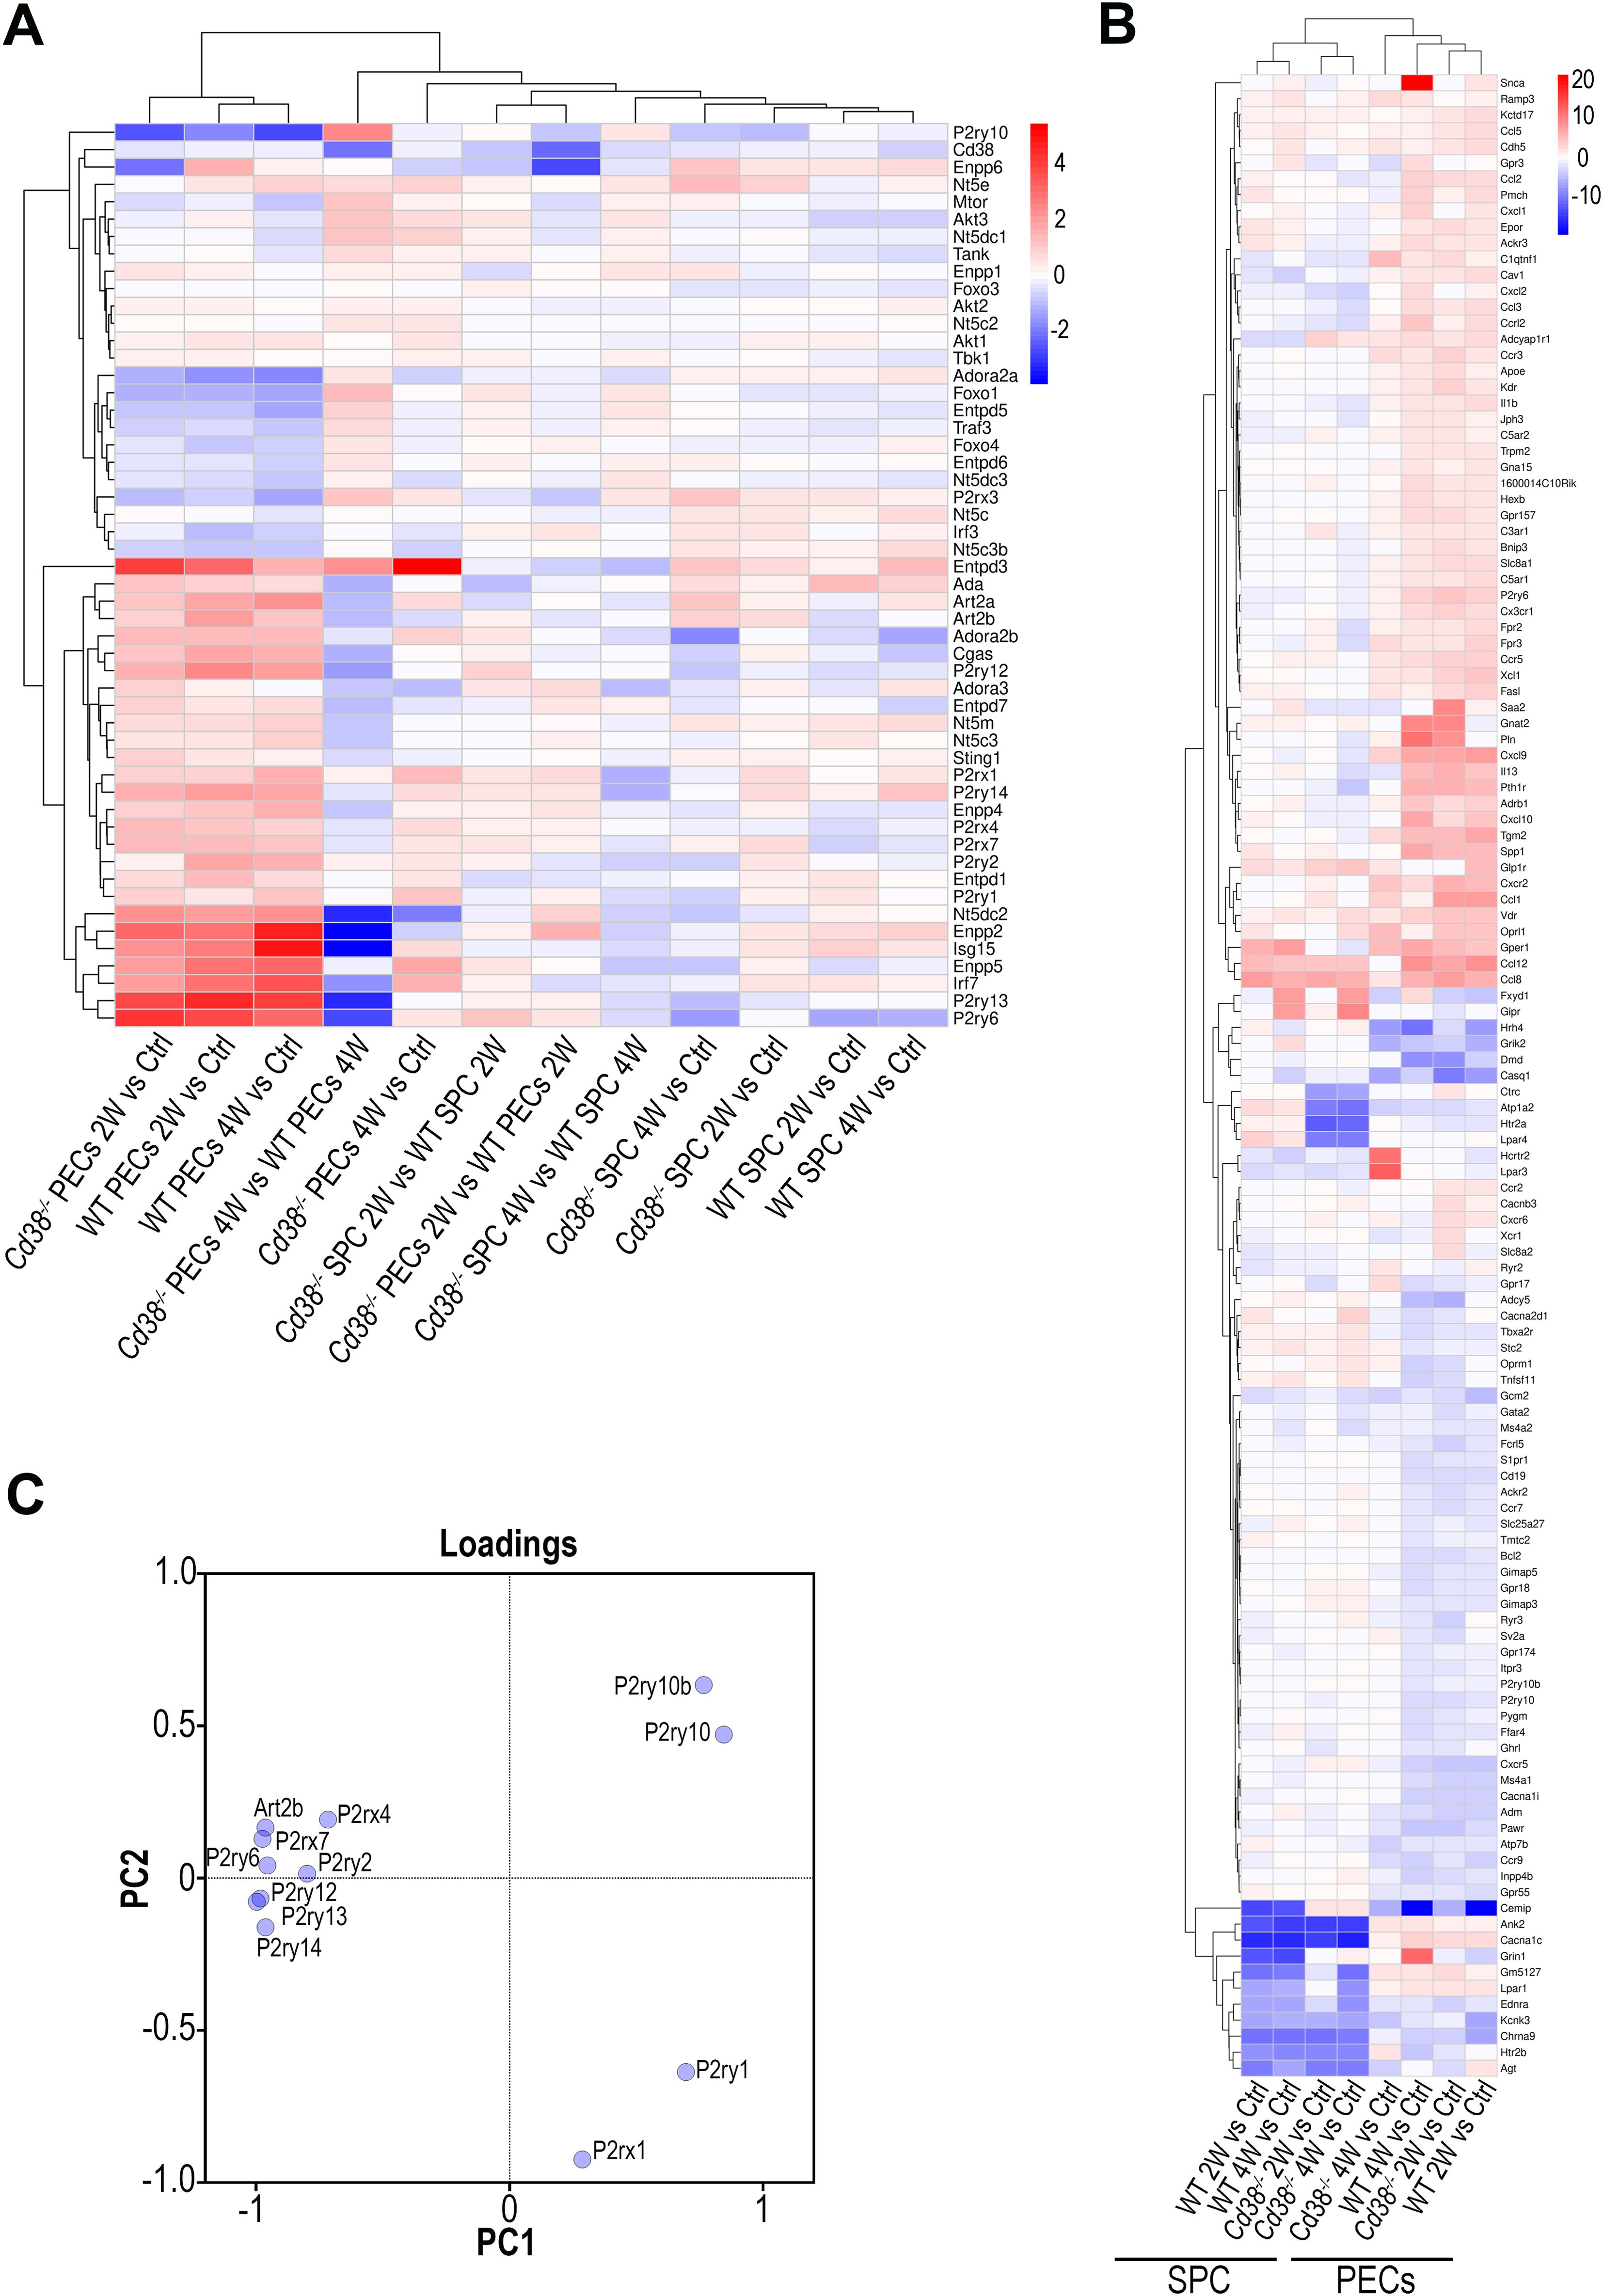
Figure 3. (A) Unsupervised hierarchical heat-map plot of the log2FC of the relative expression of the selected genes in the 12 comparatives indicated in the X-axis. (B) Unsupervised hierarchical heat-map plot of the log2FC of the relative expression of the genes associated with the GO term, Ca2+ ion homeostasis (GO:0055074), which was enriched in several comparatives. For this GO term, only DEGs with a log2FC ≥ 2, or log2FC ≤ -2 are represented, using as a reference the sample or samples where the GO term was enriched. The eight comparatives are indicated at the bottom. There was a perfect clustering of PECs samples separated from the spleen samples. (C) Loading plot of the 12 genes analyzed by PCA according with their differences in gene expression (log2FC, FDR ≤0.05, see Table 1) in the 4 comparatives tested (2-week and 4-week comparatives of cGVHD WT or cGVHD Cd38-/- PECs versus their respective controls from healthy untreated mice).
To note is that increased P2rx7 and P2rx4 expression was clearly observed in most cGVHD PECs vs control comparatives, with a more sustained response in WT than in Cd38-/-. In contrast, in the spleen cells comparatives, P2rx4 expression appeared downregulated, while P2rx7 was upregulated, although to a lesser extent than in the Cd38-/- PECs 2W vs Control comparative (Figure 3A).
The transcriptional profile of this gene cluster may define a distinct transcriptional signature that connects purinergic signaling genes in combination with genes belonging to the so-called type I interferon transcriptome signature and genes of the cGAS-STING signaling pathway, which are key players in the SLE pathology (76). In summary, there were a number of purinergic receptors and other ectonucleotidases that participate in purinergic signaling, which were differentially expressed at transcriptional level in Cd38-/- PECs and spleen cells relative to their WT counterparts after cGVHD induction.
3.4 Differential gene expression of purinergic receptors, chemokine and chemokine receptors involved in Ca2+ homeostasisIt is known that purinergic signaling is connected to Ca2+ signaling. Thus, upon T cell receptor/CD3 stimulation, ATP release is increased and leads to autocrine activation of both P2X4 and P2X7 receptors, the amplification of the initial Ca2+ microdomain formation, and regulation of subsequent downstream responses (77, 78). Performing GO enrichment analyses of DEGs from cGVHD PECs vs Control PECs comparatives we noticed that many GO BP enriched terms were related with calcium ion homeostasis and calcium-mediated signaling. Therefore, we asked whether P2rx4, P2rx7, and other purinergic receptors genes were included within the gene set comprising the GO term, Ca2+ ion homeostasis (GO:0055074), which was enriched in several PECs comparatives. As shown in Figure 3B and Supplementary Figure S5, P2rx7 and P2rx4, together with P2rx1, P2ry6, P2ry10, P2ry10b, P2ry1 and P2ry2 were selected. Only P2ry10 appeared downregulated in both cGVHD Cd38-/- and cGVHD WT PECs relative to their respective healthy controls, while the others purinergic receptors genes showed upregulated expression, in particular P2ry6, and to a lesser extent P2rx1, P2rx7, P2rx4, P2ry1, and P2ry2. In PECs P2ry6 formed part of a subcluster of strongly upregulated genes including a number of chemokines and chemokine receptors such as Ccl1, Ccl12, Ccl8, Cxcl9, Cx3cr1, and Cxcr2 (Figure 3B). The heat-map representation showed that PECs samples were clearly segregated from spleen cells samples, and that there were several clusters of genes that seemed to have a coordinated expression as judged by their similar transcriptomic profiles. Within PECs, dendograms showed that the comparative of Cd38-/- PECs 4W relative to its control was more separated from the other 3 PECs samples, while in spleen cells the two Cd38-/- samples clustered separately from the two WT samples (Figure 3B).
3.5 Discriminative power of purinergic receptor gene expressionWe observed that P2rx1 and P2ry1 genes exhibited a sustained increase in expression across the 4-time series samples when comparing the log2FC in gene expression values of cGVHD PECs to their respective healthy PECs controls (see Table 1). In contrast, the expression of the other 9 differentially expressed purinergic receptor genes declined exclusively in the 4-week comparison of cGVHD Cd38-/- PECs versus controls (see Table 1). To further identify the purinergic receptors genes that best discriminate between cGVHD WT mice and cGVHD Cd38-/- PECs, we employed a principal component analysis (PCA) multivariate statistical approach. We included the Art2b gene as a positive control, knowing the functional and physical interaction of ART2.2 and P2X7 in murine T cells (79). Figure 3C displays a loading plot showing the distribution of the 12 genes according with the variance in their relative expression profiles projected onto the first two principal components. Seven purinergic receptors - P2rx4, P2rx7, P2ry2, P2ry6, P2ry12, P2ry13, P2ry14 -, and Art2b clustered in a relatively small area near the PC2 axis. Meanwhile, P2ry10 and P2ry10b clustered in the upper right quadrant, and P2rx1 and P2ry1 were found in the lower right quadrant, close to the PC1 axis. This clustering confirmed and expanded upon the heat-map data (Figure 3B, Supplementary Figure S5), indicating that the tested genes were distributed in distinct areas corresponding to their differential expression in the four matched sets (2-week and 4-week comparative analyzed in WT and Cd38-/- mice). This pattern is consistent with a fundamentally different autoimmune and inflammatory response to the allogeneic challenge.
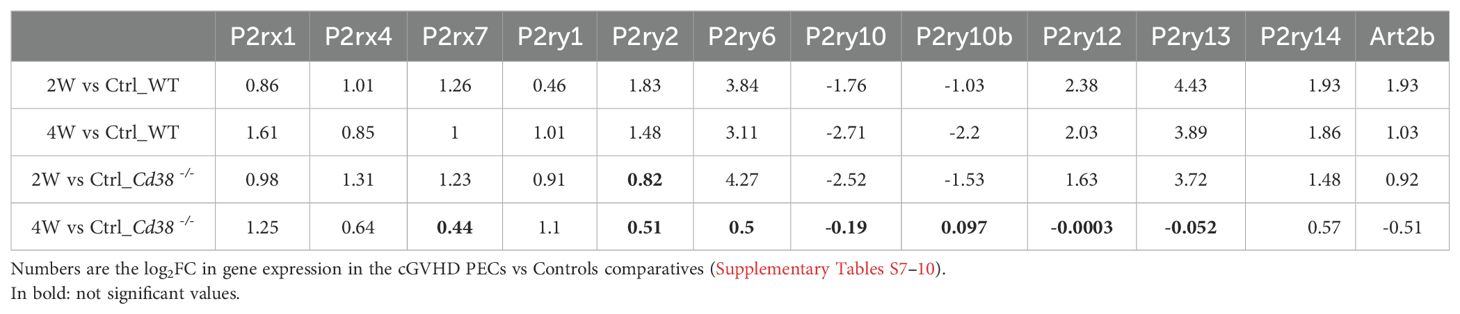
Table 1. Differential gene expression of selected 99purinergic receptors in PECs.
3.6 The transcriptional profiles in cGVHD WT PECs along time revealed a strong and sustained immune and inflammatory response, in contrast to a short-lived transcriptional response in cGVHD Cd38-/- PECsTranscriptomes of cGVHD affected mice along time were also compared with the transcriptomes of healthy controls to better understand the disease-state in a more dynamic approach, and to test whether in CD38-deficient mice there were signs of a faster resolution of the disease, as suggested in our previous study.
Volcano plots showed that 8562 genes were differentially expressed in Cd38-/- PECs 2 weeks after the adoptive transfer of bm12 spleen cells into the peritoneal cavity relative to control PECs from unchallenged mice (Figure 4A, Supplementary Table S7). The number of DEGs were reduced to 4157 4 weeks after the adoptive transfer (Figure 4B, Supplementary Table S8), suggesting a drastic reduction in the transcriptome response. In contrast, 9751 genes were differentially expressed in WT PECs at 2 weeks of the allogeneic challenge relative to controls (Figure 4C, Supplementary Table S9), and a similar number of genes, 9472, were differentially expressed at 4 weeks (Figure 4D, Supplementary Table S10), suggesting a similar transcriptome response.
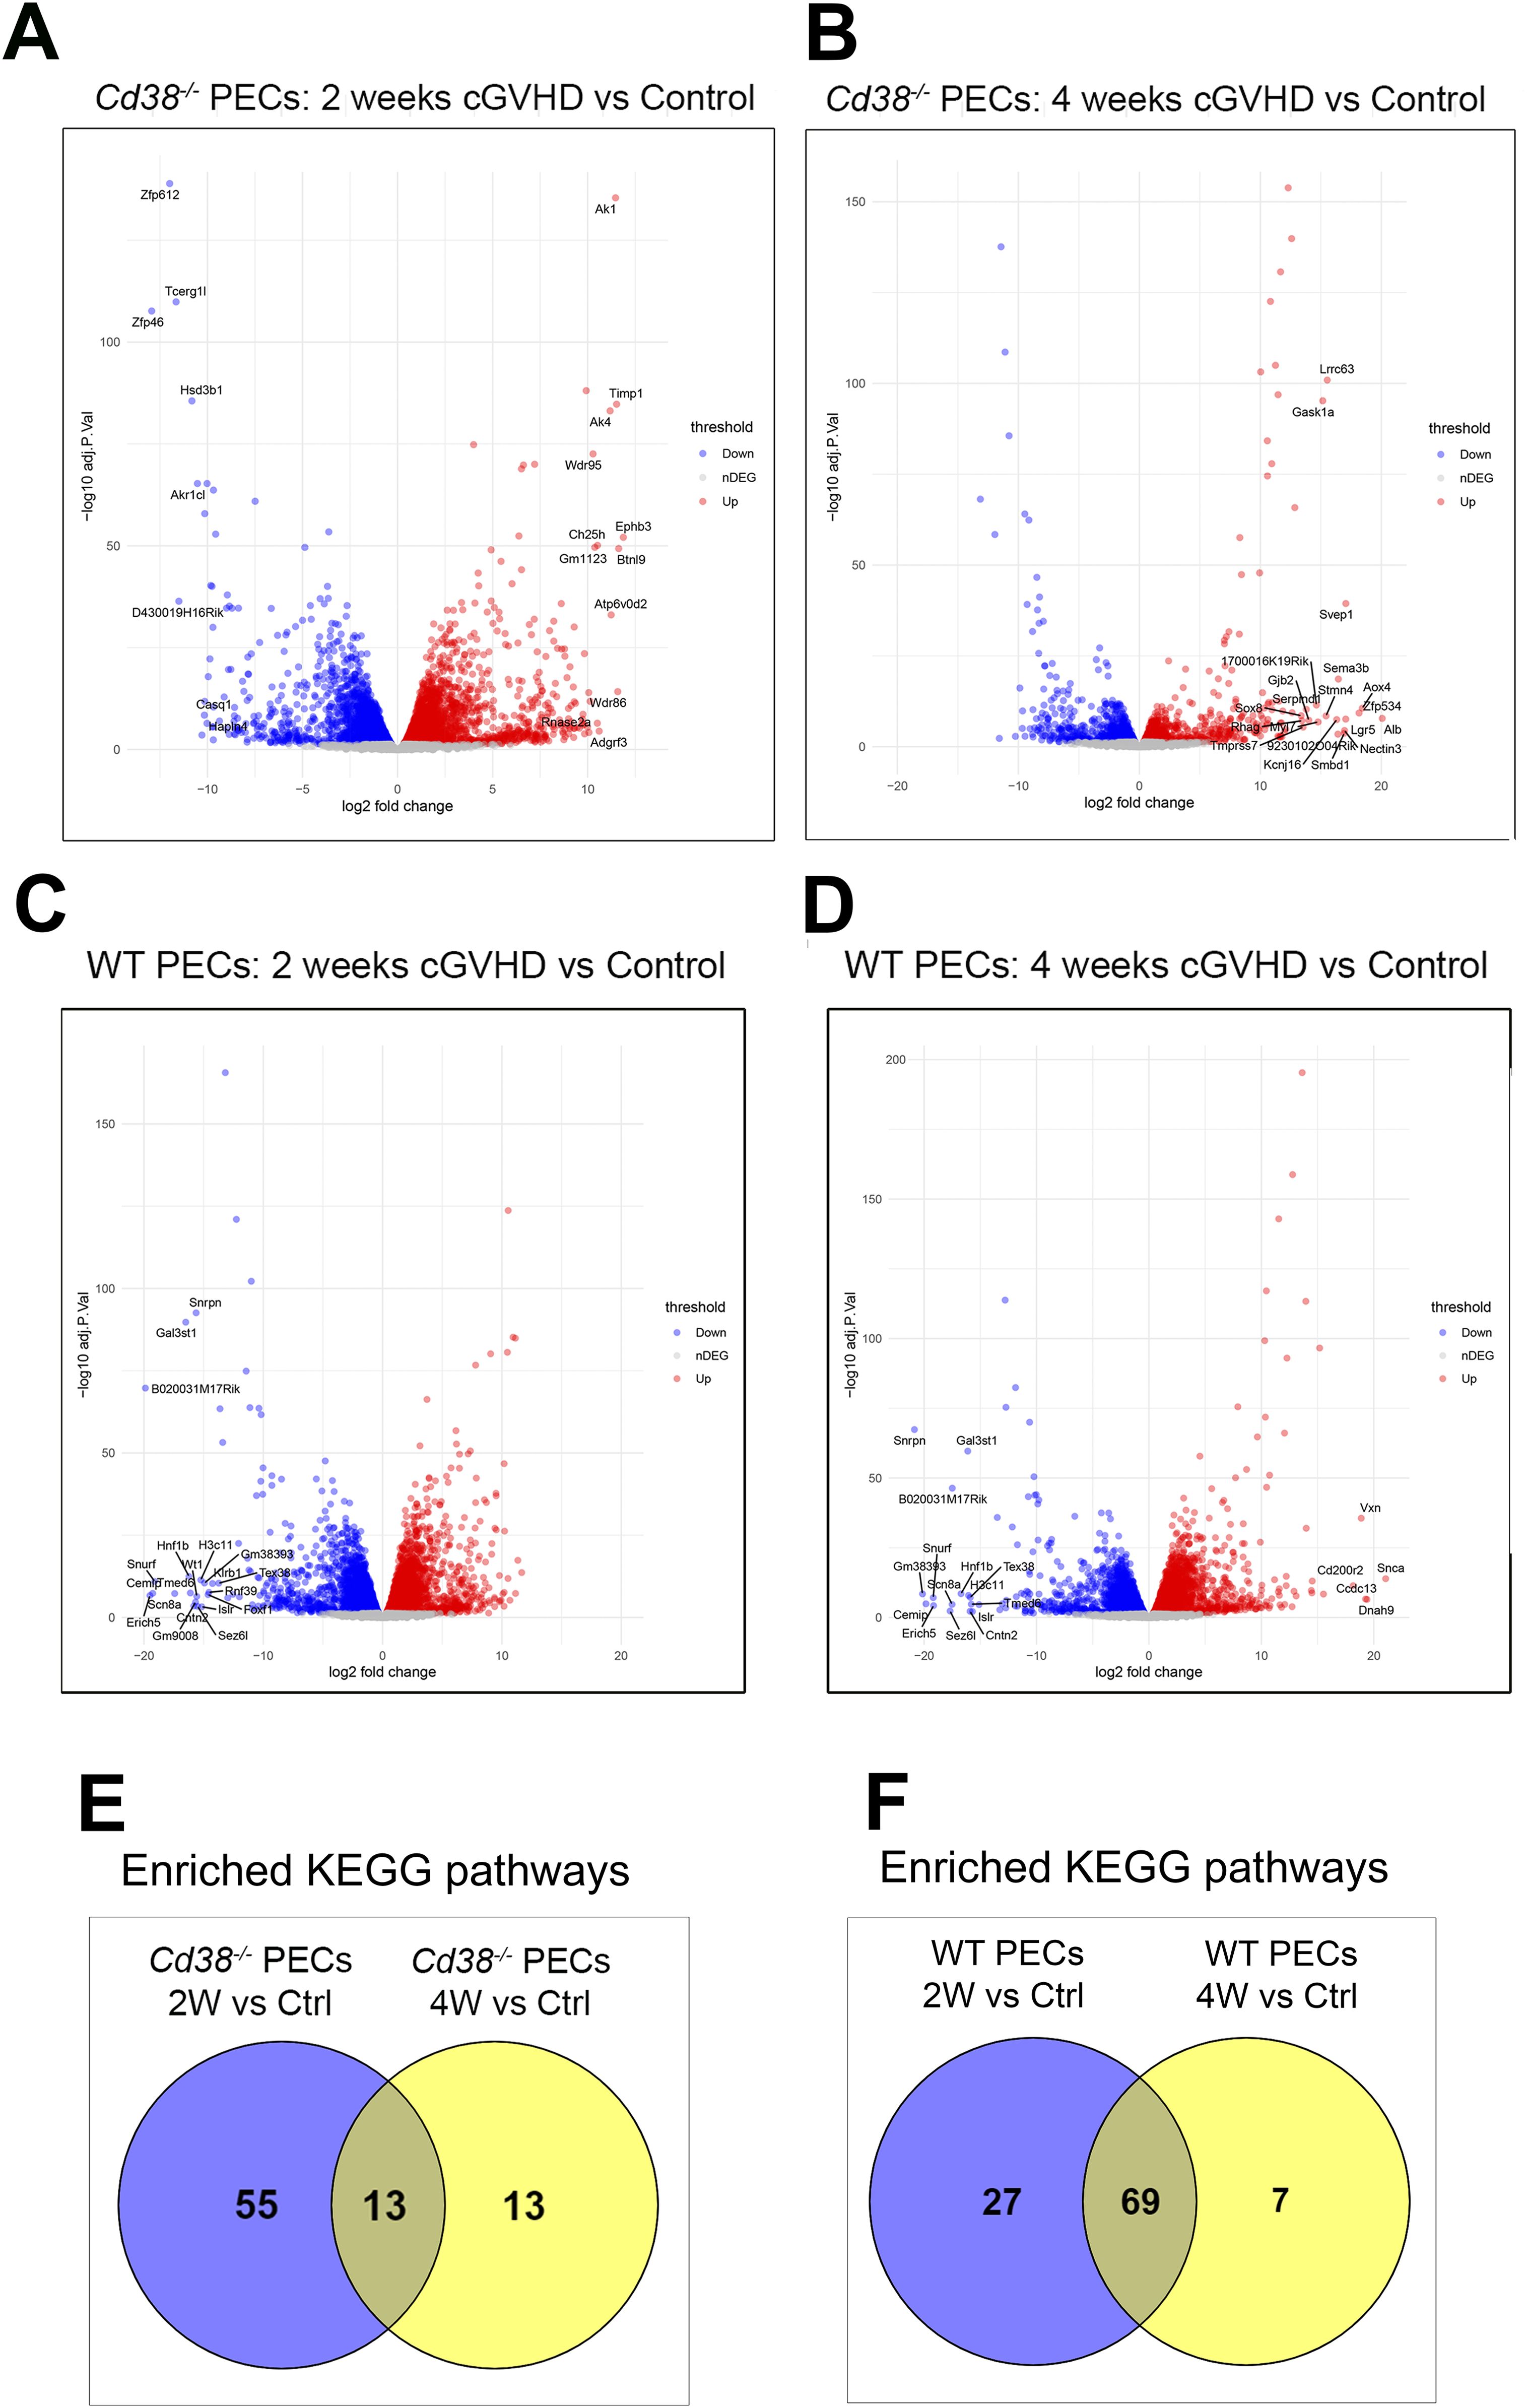
Figure 4. (A) Volcano plot showing upregulated DEGs (red dots) and downregulated DEGs (blue dots) in cGVHD Cd38-/- PECs 2 weeks after the adoptive transfer of bm12 cells vs Control Cd38-/- PECs from non-treated mice. (B) Volcano plot showing upregulated DEGs (red dots) and downregulated DEGs (blue dots) in cGVHD Cd38-/- PECs 4 weeks after the bm12 cells adoptive transfer vs Control Cd38-/- PECs from non-treated mice. (C) Volcano plot showing upregulated DEGs (red dots) and downregulated DEGs (blue dots) in WT PECs 2 weeks after the adoptive transfer of bm12 cells vs Control Cd38-/- PECs from non-treated mice. (D) Volcano plots showing upregulated DEGs (red dots) and downregulated DEGs (blue dots) in WT PECs 4 weeks after the adoptive transfer of bm12 cells vs Control Cd38-/- PECs from non-treated mice. (E) Venn diagram showing the number of shared and unique enriched KEGGs for the indicated comparatives. (F) Venn diagram showing the number of shared and unique enriched KEGGs for the indicated comparatives.
To gain insight into the molecular pathways associated with the differences in autoimmune response between Cd38-/- and WT mice, enrichment analyses in KEGG pathways were performed in our comparative experiments along the time. In Cd38-/- PECs, 68 KEGG pathways were significantly enriched 2 weeks after the allogeneic challenge relative to controls (Supplementary Table S11). In contrast, only 26 KEGG pathways were enriched at 4 weeks (Supplementary Table S12), which was a drastic reduction relative to the 2 weeks-comparative. In WT PECs, at 2 weeks of the allogeneic challenge, 96 KEGG pathways were significantly enriched (Supplementary Table S13), and 76 at 4 weeks (Supplementary Table S14).
Venn diagrams showed that in Cd38-/- PECs only 13 enriched KEGG pathways were shared at both 2 and 4 weeks relative to controls (Figure 4E), while most enriched pathways belonged to the 2-week_vs_Ctrl comparative, where the bulk of the transcriptional response seemed to be concentrated. In contrast, Venn diagrams in WT PECs showed that 69 of these pathways were shared between both time points (Figure 4F), which suggested a more sustained transcriptional response than in Cd38-/- PECs.
To better understand the differences and similarities in the transcriptional response between Cd38-/- PECs and WT PECs, the enriched KEGG pathways of these 4-time series were matched and visualized using UpSet plots (80). In Figure 5A, three different set intersections are highlighted. The first highlighted intersection corresponded to the 10 pathways shared between all 4-time series. The second intersection corresponded to the 43 pathways shared by Cd38-/- PECs 2W_vs_Ctrl, WT PECs 2W_vs_Ctrl, and WT PECs 4W_vs_Ctrl, but not with Cd38-/- PECs 4W_vs_Ctrl. Finally, the third intersection corresponded to the 14 pathways shared by WT PECs 2W_vs_Ctrl and WT PECs 4W_vs_Ctrl.
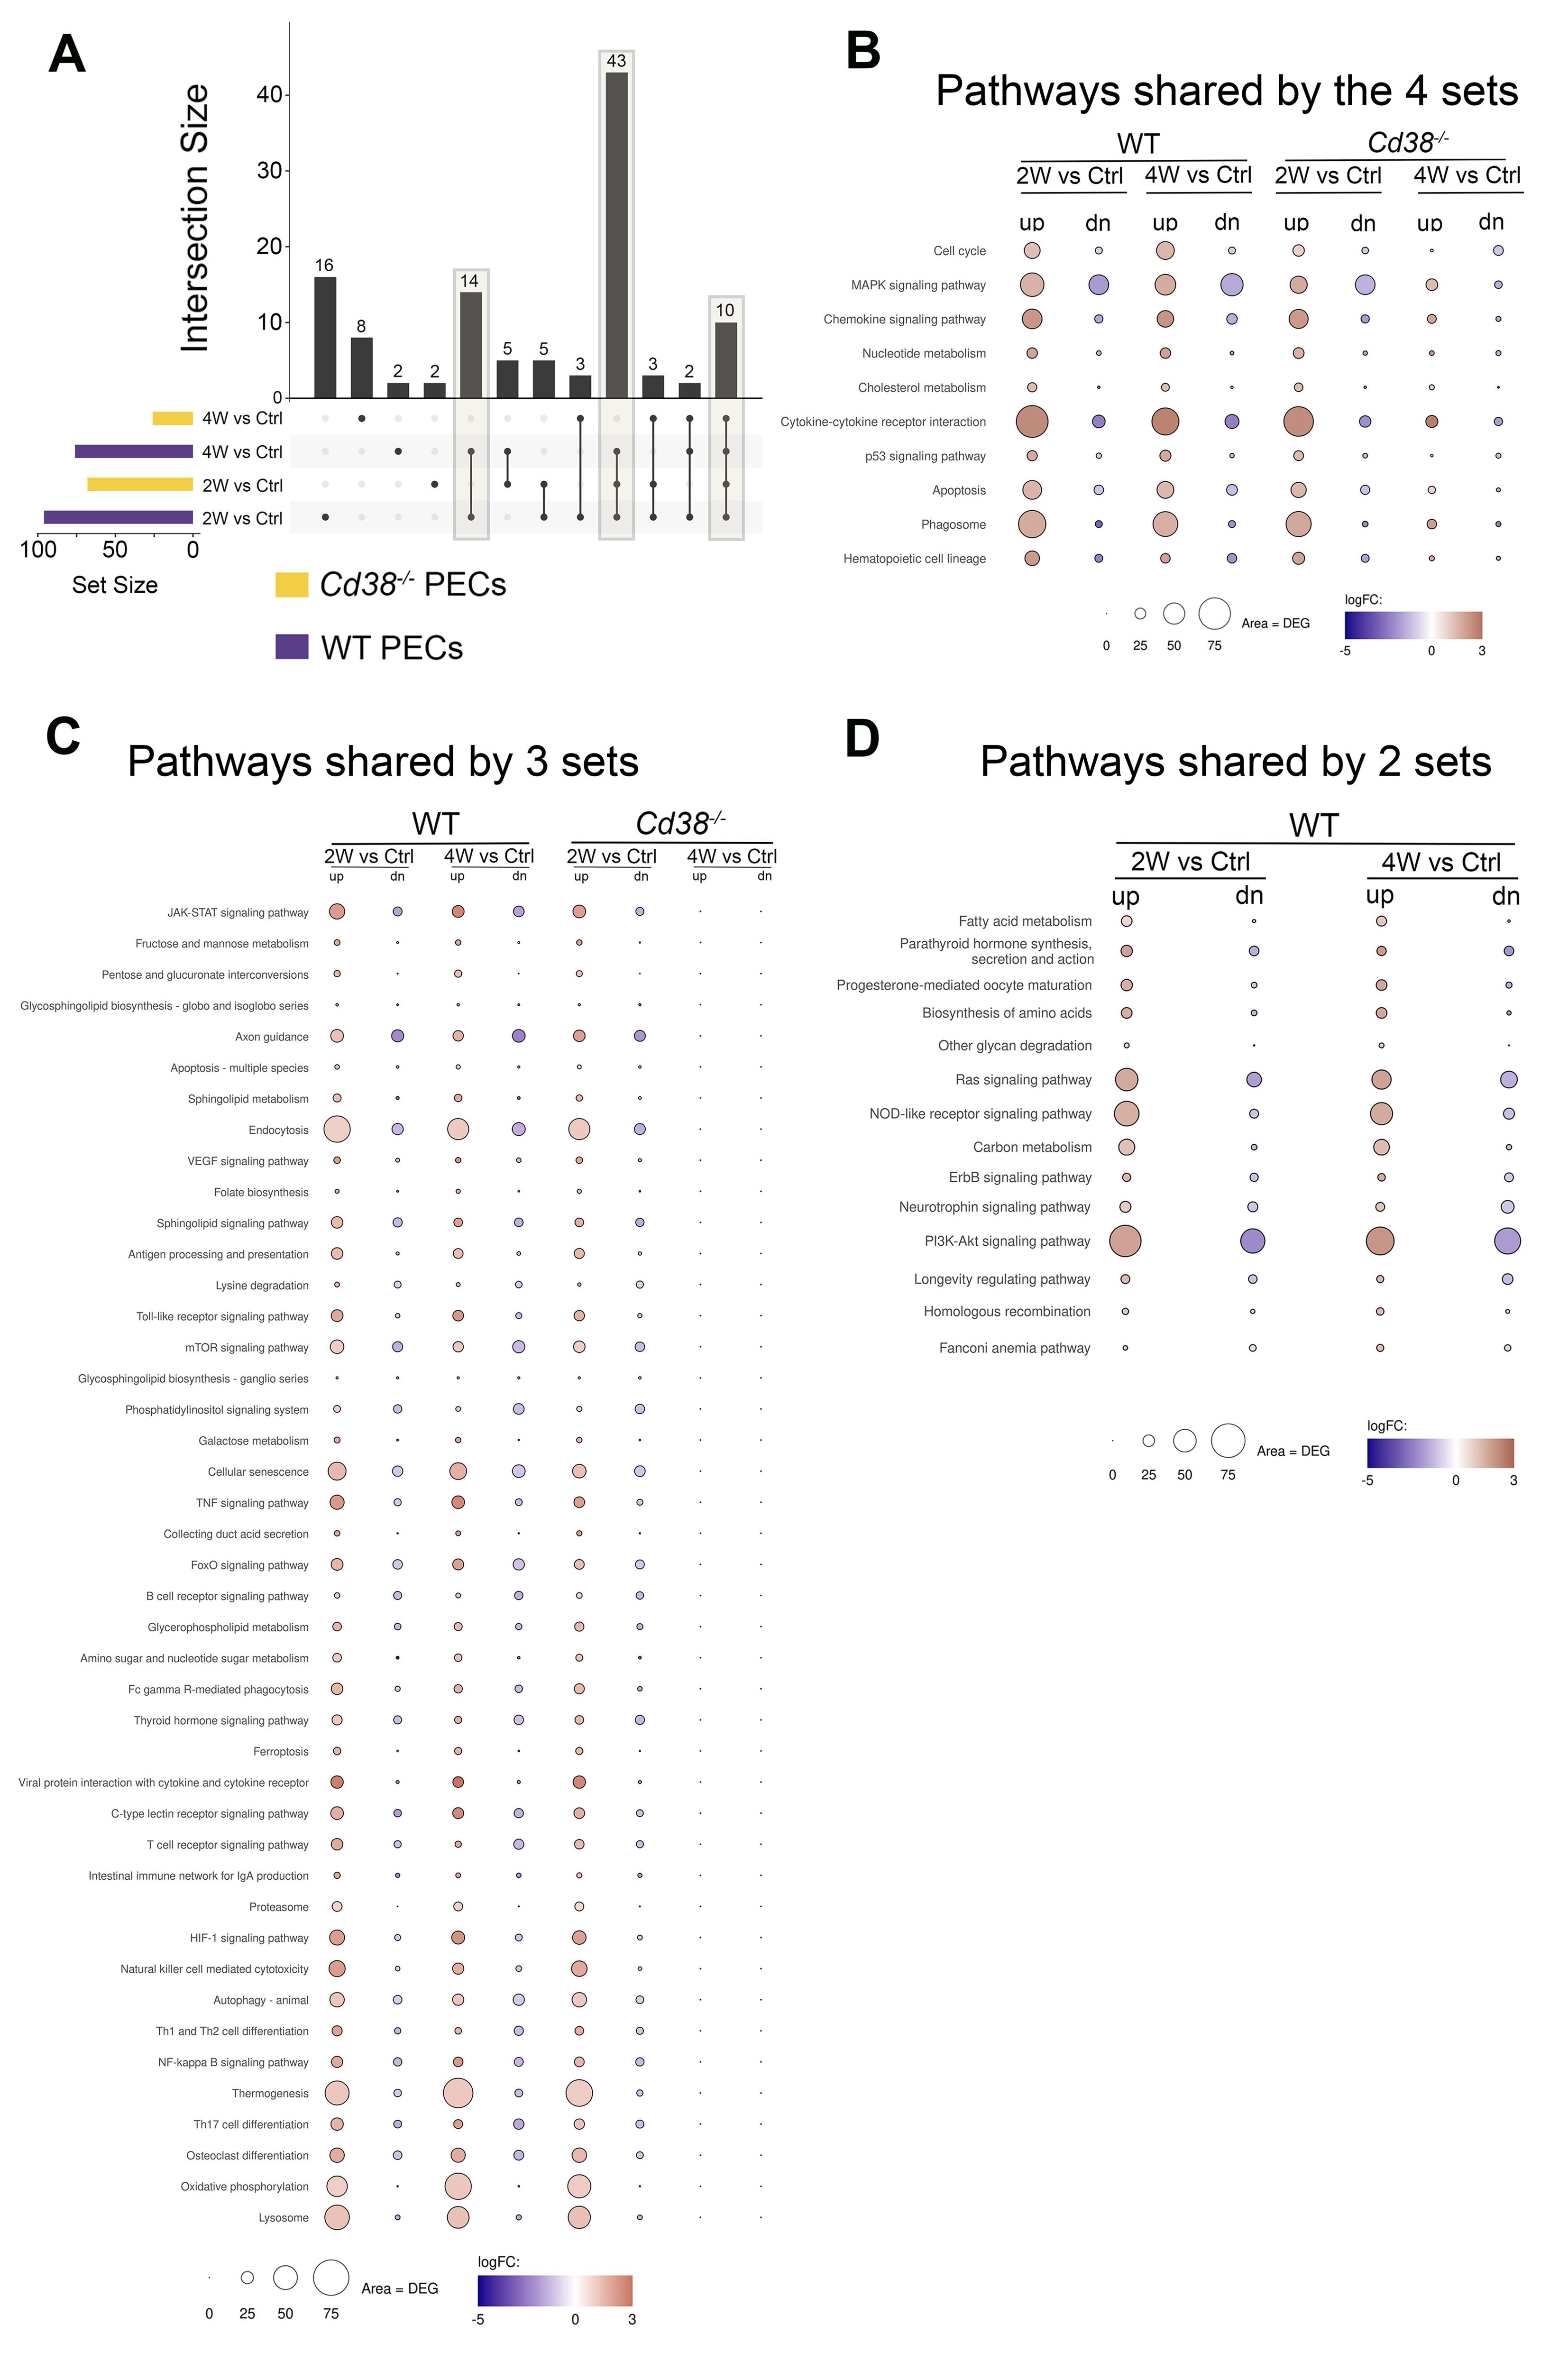
Figure 5. (A) The enriched KEGG pathways of these 4-time series or sets of PECs comparatives were matched and visualized using UpSet plots. Three different set intersections are highlighted. (B) The first highlighted intersection corresponded to the 10 pathways shared between all 4-time series. (C) The second intersection corresponded to the 43 pathways shared by Cd38-/- PECs 2W_vs_Ctrl, WT PECs 2W_vs_Ctrl, and WT PECs 4W_vs_Ctrl, but not with Cd38-/- PECs 4W_vs_Ctrl. (D) The third intersection corresponded to the 14 pathways shared by WT PECs 2W_vs_Ctrl and WT PECs 4W_vs_Ctrl. The mean log2FC of the upregulated DEGs (red circles) versus the mean log2FC of the downregulated DEGs (blue circles) per pathway were represented graphically. In this representation, the size of the circles was indicative of the number of upregulated or downregulated DEGs, and the intensity of the colors indicate the differences in log2FC.
To assess the intensity of the transcriptome response to the allogeneic challenge, the mean log2FC of the upregulated DEGs versus the mean log2FC of the downregulated DEGs per pathway were represented graphically. In this representation, the size of the circles was indicative of the number of upregulated or downregulated DEGs. From the 10 pathways shared between the 4 comparatives, cytokine-cytokine receptor interaction, phagosome, MAPK signaling pathway, chemokine signaling pathway, and apoptosis were the pathways with most upregulated DEGs involved, with a distinct pattern in Cd38-/- PECs (Figure 5B). Thus, in these comparatives, the number of upregulated DEGs corresponding to these pathways peaked at 2 weeks, declining sharply at 4 weeks. To note is that at 4 weeks the term cell cycle showed increased number of downregulated DEGs in Cd38-/- PECs, with no upregulated DEGs. This is better appreciated in a heat-map representation of the pathways cytokine-cytokine receptor interaction and cell cycle (Figures 6A, B, Supplementary Figures S6A, S6B). For these two pathways, dendograms showed that the Cd38-/-PECs_4W sample differed from the other three PECs samples, and it was closer to the gene profiling of spleen samples (Figures 6A, B, Supplementary Figures S6A, S6B).
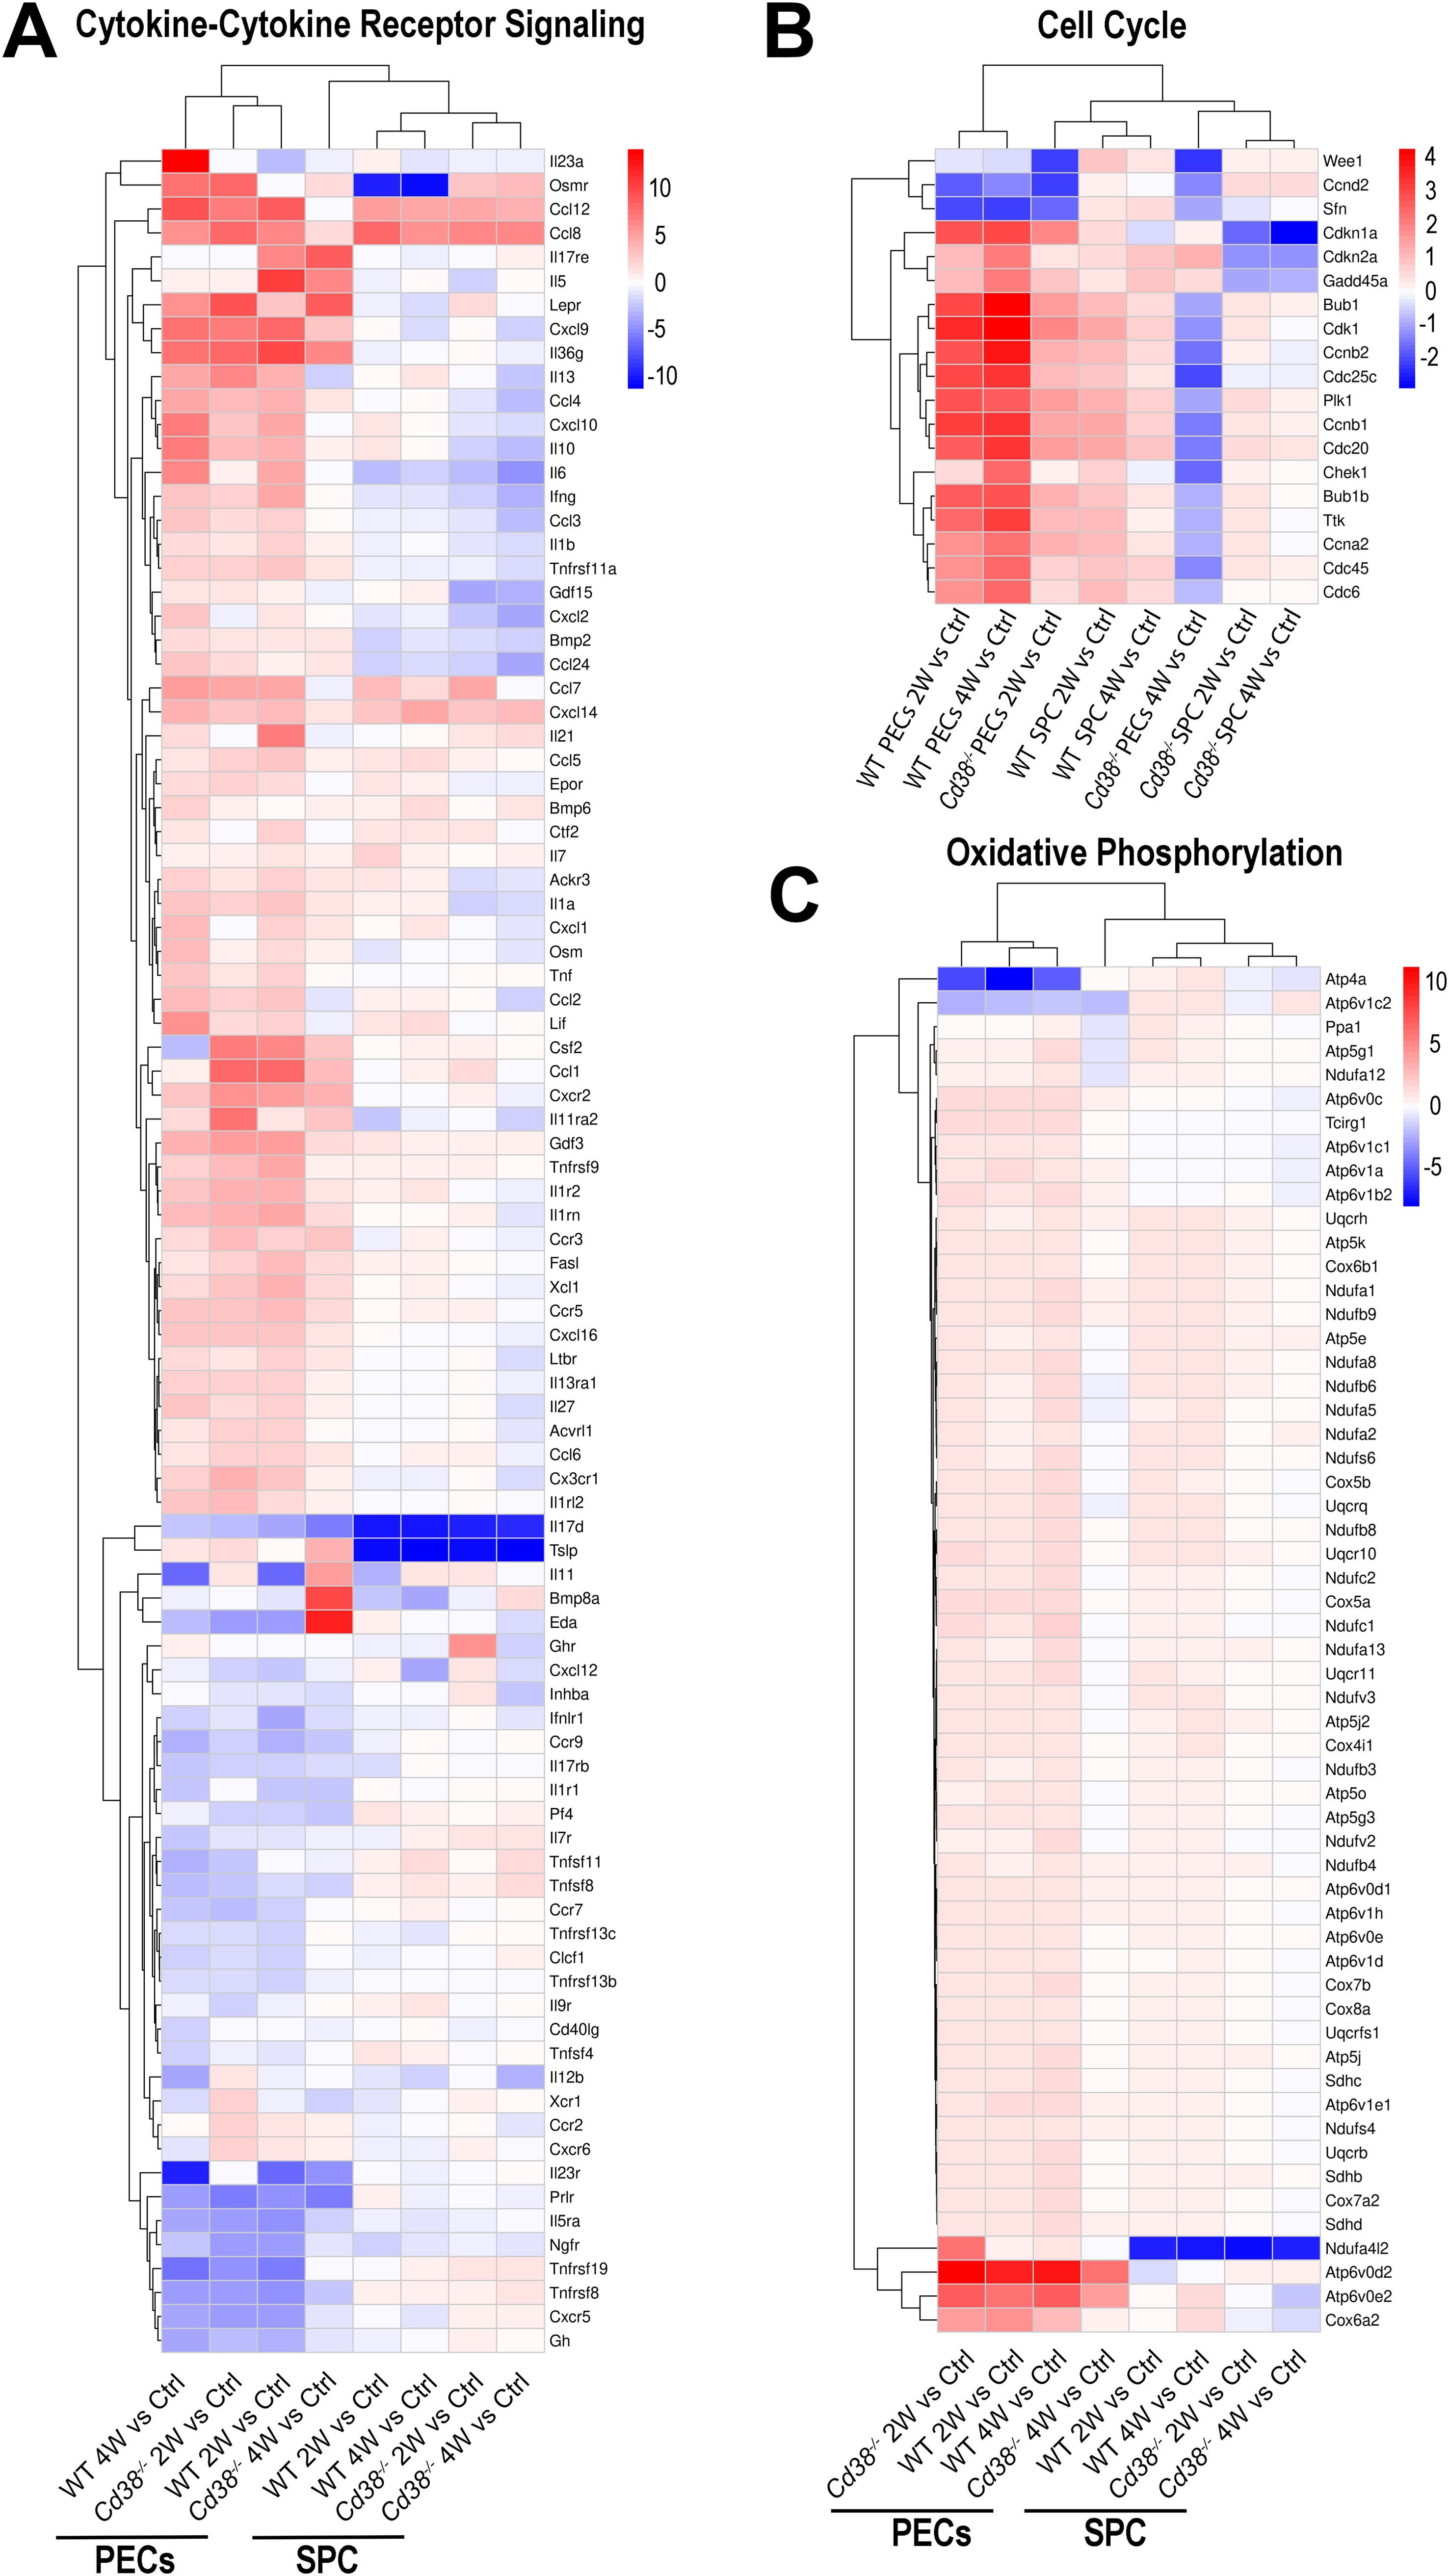
Figure 6. Unsupervised heat-map plot of the log2 fold changes of DEGs contributing to the indicated KEGG pathways: (A) Cytokine-Cytokine receptor signaling. (B) Cell Cycle process. (C) Oxidative phosphorylation. In panels (A, B), only DEGs with a log2FC ≥ 2, or log2FC ≤ -2 are represented, using as a reference the sample or samples where the pathways were enriched. In panel (C), only DEGs with a log2FC ≥ 1, or log2FC ≤ -1 are represented. The 8-time comparatives are indicated to
留言 (0)