
記住我
Multiple sclerosis (MS) is a chronic inflammatory demyelinating disease of the central nervous system, influenced by a complex interplay of genetic predisposition and environmental triggers (1). While the precise cause of MS remains unclear, its prevalence varies significantly across geographic and ethnic groups (2). In Kuwait, the crude prevalence rate has shown a marked increase from 31.15/100,000 in 2000 to 85.05/100,000 in 2011, suggesting potential environmental contributions (3, 4). Studies indicated that genetic factors such as human leukocyte antigens (HLA) (5) and environmental influences like geographical locations (6), sun exposure (7–9), dietary intake (9), vitamin D levels (10), may play significant roles in MS risk (11).
Vitamin D and its carrier protein, vitamin D binding protein (VDBP), have been implicated in MS pathogenesis (9, 10, 12). The bioactive metabolite 1,25-hydroxyvitamin D is a secosteroid hormone that is synthesized in the skin on exposure to ultraviolet radiation (13). A collaborative study from US reported that the risk of developing MS decreases with increasing levels of serum 25 hydroxyvitamin D3 [25(OH) D3] (10). MS disease activity influenced by 25(OH) D3 status (14). Low levels of vitamin D are associated with accrual of disability, and increased relapse rate (15). Furthermore, vitamin D supplementation has been shown to ameliorate disease activity in the MS experimental model; experimental autoimmune encephalitis (16).
Proteomic analysis studies have explored the role of vitamin D binding protein (VDBP), also known as the group-specific component (Gc), in multiple sclerosis (MS) (17, 18). Synthesized in the liver, VDBP binds and transports vitamin D and its metabolites to target organs (19). Genetic variations in the VDBP gene, particularly two single nucleotide polymorphisms (SNPs), rs7041 and rs4588, lead to three key isoforms: Gc1 fast (Gc1F), Gc1 slow (GC1F), and Gc2 (20). These isoforms lead to three major VDBP/Gc genotypes (GC), namely GC1F (c.1296T, c.1307C), GC1S (c.1296G, c.1307C), and GC2 (c.1296T, c.1307A); and phenotypes (Gc), namely Gc1F (p.432Asp, p.436Thr), Gc1S (p.432Glu, p.436Thr), and Gc2 (p.432Asp, p.436Lys) (21).
These isoforms influence vitamin D bioavailability, affecting genetic susceptibility to diseases (22). Proteomic research has identified lower VDBP levels in the cerebrospinal fluid of MS patients, especially during acute relapses (23). Genetic studies examining the VDBP gene’s role in MS have shown mixed results. Research from Japan, Canada, and Italy found no significant association between GC genotypes and MS risk, although these findings might not apply universally due to population specific VDBP isoform distributions (13, 24, 25). Interestingly, VDBP polymorphisms have been linked to other chronic immune-related diseases like asthma and diabetes (22). Recent studies have observed lower VDBP levels in MS patients compared to healthy individuals, though the role of GC genotypes in these variations remains unexplored (26, 27). These findings highlight the need for further investigation into VDBP polymorphisms and their interplay with vitamin D metabolism and MS susceptibility across diverse populations.
In this study, we investigated 1,112 alleles from 278 subjects (151 drug naïve Kuwaiti MS patients and 127 healthy controls) to explore the distribution of VDBP genotypes and phenotypes and their association with serum levels of 25-hydroxyvitamin D [25(OH)vitamin D] and VDBP. Each chromosome in a diploid somatic cell is made up of two chromatids, each of which contains a copy of an allele at each genetic location. A diploid cell contains 4 copies of an allele. We aim to determine whether these genetic variations contribute to MS susceptibility in the Kuwaiti population and their associations (if any) with the serum concentrations of 25(OH)vitamin D and VDBP.
Methods SubjectsIn this observational study, we recruited 151 drug naïve Kuwaiti patients diagnosed with MS and 127 healthy controls. Recruitment of subjects (both patients and controls) and data collection was done from October 2017 to October 2018. The sample calculation was done by unmatched case-control study following OpenEpi, Version 3 (28). Both groups of subjects were approximately frequency matched for age and sex (29). MS patients were recruited from the MS clinic of Mubarak Al Kabeer Hospital, Kuwait, and the control subjects were selected from healthy individuals among the Kuwaiti population. The MS patients were diagnosed according to the McDonald criteria (30) and followed up by our team of experienced neurologists at the national MS clinic at Mubarak Al-Kabeer Hospital in Kuwait. Type of MS was identified (30) and disability due to MS was measured using the expanded disability status scale (EDSS) (31). At the time of recruitment, none of the control subjects had any documented history of autoimmune, inflammatory, or neurologic diseases and had no family history of MS. Moreover, none of the patients were taking any disease-modifying drugs and they did not receive corticosteroids during the month prior to the evaluation. The female subjects (controls and patients) were not on estrogen supplementation.
All the participants signed a voluntary informed consent form, which was approved by the Ethics Committees of the Health Sciences Centre, Kuwait University approval number-VDR/EC/3073-June-6, 2017.
Both patients and controls were interviewed and requested to fill in a questionnaire that was designed to collect information like age, gender, body mass index (BMI), daily habits (including sun exposure, choice of routine outdoor dressing, routine diet, and outdoor physical activity, etc.), past medical history, and current and past medications (including dietary supplements). Like any other observational case controls study the potential for recall bias cannot be ruled out in this study.
Biochemical analysisOvernight fasting blood specimens were collected from all subjects and immediately centrifuged at 3,000 RPM for 15 min, and the serum samples were stored at −40°C until analyzed using commercially available kits. The enzyme immunoassay (EIA) was performed to estimate the levels of total 25(OH)vitamin D (Immune Diagnostic Systems, Bensheim, Germany) following the kit manufacturer’s protocols.
The procedure for estimating 25(OH)vitamin D in serum involves dilution of calibrators, controls, and samples with biotin labelled 25(OH)vitamin D. The diluted samples were incubated in highly specific sheep 25(OH)vitamin D antibody coated microtiter wells for 2 h at room temperature before aspiration and washing. Enzyme (horseradish peroxidase) labelled avidin, was added and binds selectively to complexed biotin and, following a further wash step, colour was developed using a chromogenic substrate (TMB). The absorbance of the stopped reaction mixtures was read in a microtiter plate reader, colour intensity developed being proportional to the concentration of 25-(OH)vitamin D. The intra-assay coefficients of variations (CVs) were 5.3 and 5.6% at 39.0 and 61.1 nmol/L, respectively. The inter-assay CVs were 4.6 and 6.4% at 40.3 and 72.0 nmol/L, respectively. A quantitative Sandwich Enzyme Immunoassay was conducted using the manufacturer’s procedure to estimate VDBP (Quantikine, R&D systems, Minneapolis, MN, United States). In brief, the procedure involved dilution of standard, control serum sample with calibrator diluent RD6-11 followed by incubation in highly specific monoclonal VDBP antibody coated microplate for 1 h at room temperature before aspiration and washing. After washing away any outbound substances, an enzyme linked monoclonal antibody specific for VDBP was added to the well, following a further wash step, a chromogenic substrate solution was added to the well and colour was developed. The absorbance of the stopped reaction mixtures was read in a microtiter plate reader, colour intensity developed being proportional to the concentration of VDBP bound in initial step. The intra-assay coefficients of variations (CVs) were 5.7 and 6.2% at 33.0 and 180 ng/mL, respectively. The inter-assay CVs were 5.1 and 7.4% at 52.9 and 164 ng/mL, respectively.
As per the recommendations of the clinical practice guidelines of the Endocrine Society Task Force (32), the cutoff points utilized for classification in this study were: serum 25(OH)vitamin D <50 nmol/L—vitamin D deficiency; <25 nmol/L—severe vitamin D deficiency (33), and inadequate or insufficient at 50–75 nmol/L (20–30 ng/mL) and sufficient or adequate at >75 nmol/L (>30 ng/mL) (34, 35).
Isolation of genomic DNAGenomic DNA was isolated from whole blood of MS patients and healthy controls using the DNA Blood Mini Kit (Qiagen, Hilden, Germany), following the manufacturer’s instructions. The quality and quantity of the isolated genomic DNA were determined using a low volume (2 μL sample) Epoch Microplate Spectrophotometer (BioTek Instruments, Inc., Winooski, VT, United States) by measuring the absorbance at 260 nm and 280 nm. DNA from these samples was used for determining GC genotypes. Conventional PCR method was used for amplification of the target DNA sample.
Oligonucleotide primers for amplification of the GC target DNAThe forward (5-gatctcgaagaggcatgtttc-3′) and reverse (5′-gttgcctgtgttcacagactc-3′) primers were designed based on the genomic DNA sequence of human GC gene (GenBank: L10641.1, gene length = 55,136 nucleotides) using Primer Design Software of National Centre for Biotechnology Information (NCBI), Bethesda, MD, United States. These primers annealed at the sites in the GC gene, which encompassed the two specific mutation sites, i.e., G and C at the locations 35,706 and 35,717 in the GC gene, respectively (21).
PCR amplification of target regionThe forward (F) and reverse (R) primers were used in PCR amplification according to standard methods (21). In brief, PCRs were performed in 0.2 mL microtubes with a total volume of 50 μL containing 100 ng of genomic DNA, 250 μM of each dNTP, 10 mM tris-HCl (pH 8.3), 50 Mm KCl, 2 mM MgCl2, 2.5 units of AmpliTaq Gold® DNA polymerase (Thermo Fisher Scientific, Waltham, MA, United States) and 25 pmol of each F and R primer. PCR cycles were performed with an initial denaturation step of 10 min at 95°C for the activation of Ampli-TaqGold, followed by 30 cycles of 94°C for 30 s, 60°C for 30 s, and 72°C for 30 s with a final extension step of 72°C for 5 min. The expected size of PCR product (597 bp) was confirmed by agarose gel electrophoresis using 1.5% agarose gels (21, 36). DNA extracted from human subjects from the same population was used as positive control and mastermix without any DNA used as negative control.
Sequencing of PCR products and analysis of dataThe PCR products were sequenced according to Sanger’s method using an automated DNA Sequencing System (ABI 3130xl Genetic Analyzer, Thermo Fisher Scientific) (21). In brief, the purification of amplified products was performed by addition of 2 μL of ExoSAP-IT® to 5 μL of the PCR product and incubated for 15 min at 37°C, followed by heating at 80°C for 15 min, which made the enzyme inactive. The purified DNA fragments (10 ng) were used in the cycle-sequencing reaction using a BigDye Terminator v1.3 Cycle Sequencing Kit (Thermo Fisher Scientific). The generated DNA fragments were purified using BigDye XTerminator® Purification Kits (Thermo Fisher Scientific) and analyzed using an ABI 3130x Genetic Analyzer (Thermo Fisher Scientific). DNA sequence data of the PCR amplified fragments were analyzed for specific mutations rs7041 (G − T) and rs4588 (C − A) using the software in the Genetic Analyzer. Based on these results, the frequencies of GC genotypes and phenotypes were determined (36).
Statistical analysesStatistical analyses were carried out using Statistical Package for Social Sciences (SPSS) (IBM Corporation, Armonk, NY, United States 2013). Qualitative variables were described using numbers and percentages, while quantitative variables were obtained using medians (25th–75th percentile) and mean ± SD, as appropriate. Differences between two independent groups were tested with the Mann–Whitney U test. Differences between two related samples were tested with the Wilcoxon signed-rank test. The genotype and phenotype frequencies in MS patients and controls were calculated and the results were compared using Fisher’s exact test or chi square test (as appropriate). p < 0.05 was taken as significant. Missing variables are removed from the analysis.
Results Study populationInitially, following the sample size calculated (28), a total of 188 potentially eligible patients and equal number of control subjects were included in the study, however 37 patients and 61 controls withdrawn from the study citing personal circumstances and excluded from analysis. The descriptive characteristics of rest the cohort are presented in Table 1. The subjects were young adults (mean age: 33.6 ± 10.1 years) and none of them reported to take any medications. The study population of Kuwaiti nationals comprised of three ethnicities, i.e., non-Bedouin Arabs (44.5%) Bedouin Arabs (42.2%) and Persians (13.3%). The patients were diagnosed having MS at early adulthood (mean age: 28.2 ± 9.3) with a duration of disease varying from 0–6 years. Most of the patients (86.1%, N = 130) were having relapsing remitting MS (RRMS), followed by secondary progressive (RP) (12.6%, N = 19) and primary progressive (PP) (1.3%, N = 2) MS (Table 1). None of the patients were reported to take immunomodulatory therapy. Disease severity measures by EDSS was 1.5 (0–3) [Quartile 1 (Q1)–Quartile 3 (Q3)] (Table 1).
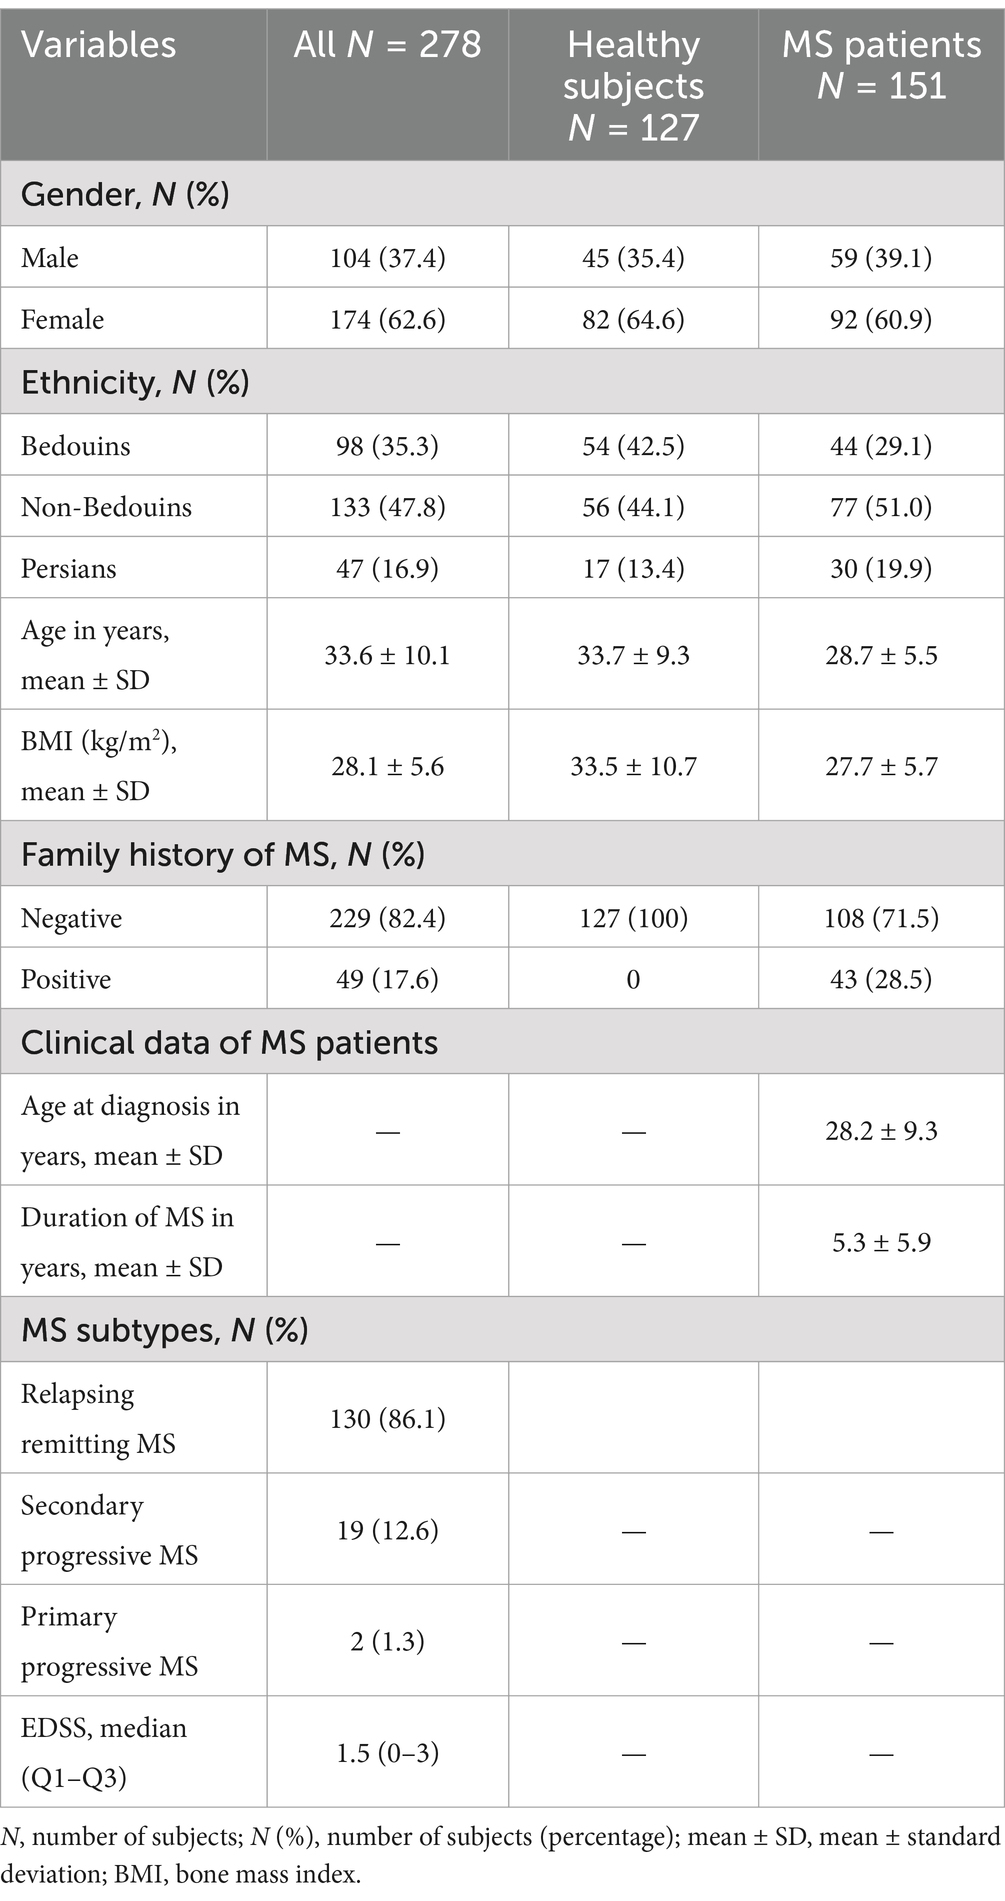
Table 1. Demographics characteristics of healthy subjects and MS patients and clinical dada of MS patients.
Genotyping analysisThe results of PCR amplification, followed by agarose gel electrophoresis, showed that the product of specific size (597 bp DNA) was amplified from the genomic DNA of all samples. The sequencing of PCR amplified DNA was successful in all controls and patients, and the sequence analyses confirmed that the PCR products belonged to the GC gene. PCR amplification efficiency was 100%, sequencing read quality was highly efficient to provide successful sequencing of all samples included in this study. Furthermore, the sequence analyses identified the nucleotide bases present in the GC gene at the specific mutation sites, i.e., locations 35,706 (G to T) and 35,717 (C to A). A representative result is shown in Figure 1 (21).
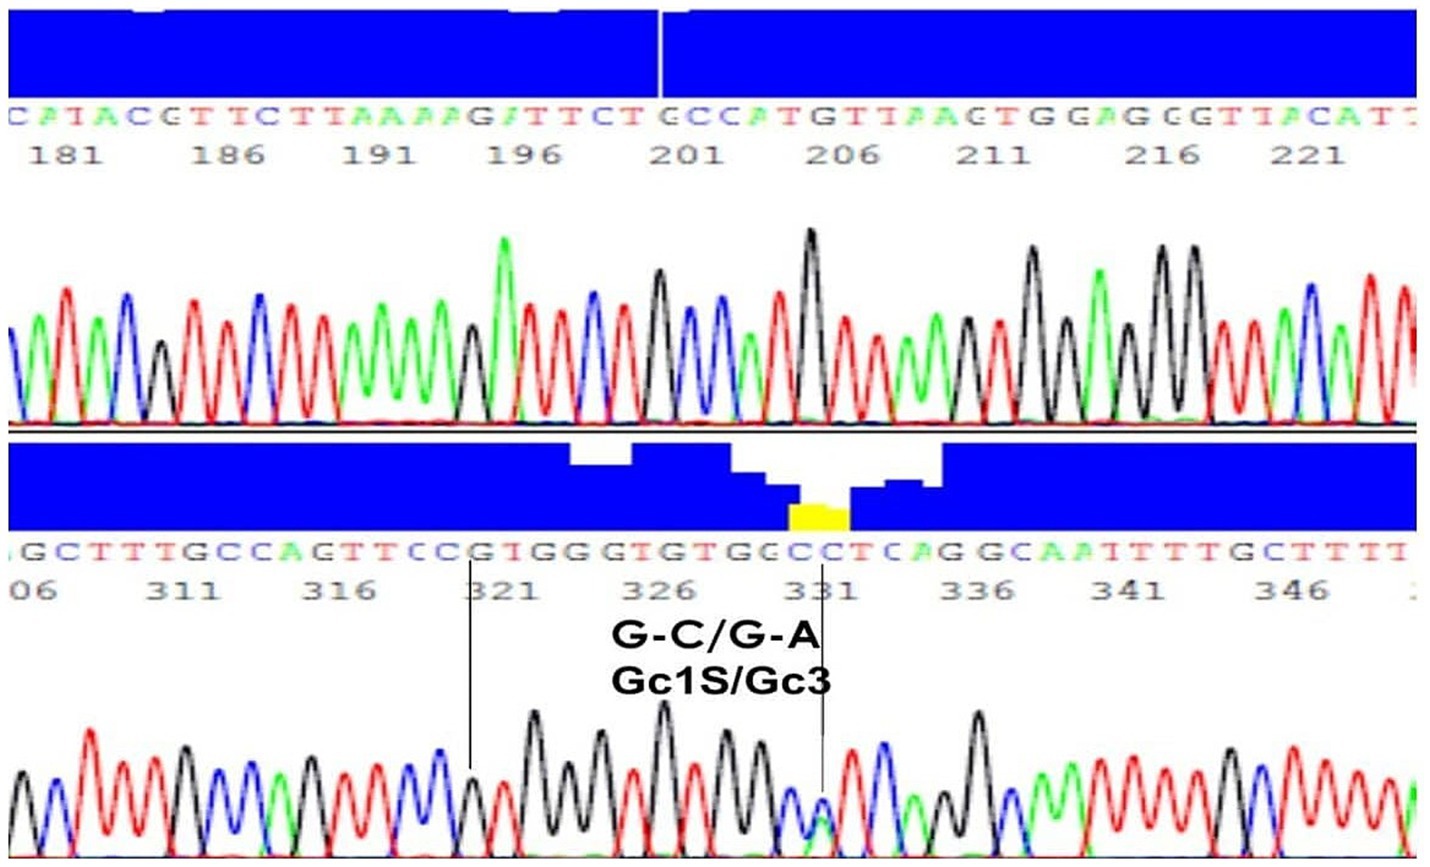
Figure 1. DNA sequence of a representative sample with genotype G-C/G-A and phenotype Gc1S/Gc3. A representative result of PCR amplification, followed by agarose gel electrophoresis, showed that the product of specific size (597 bp DNA) was amplified from the genomic DNA.
GC allelic subtypesThe overall analyses of DNA sequence data identified the existence of four different allelic subtypes of GC, namely GC1S, GC1F, GC2 and GC3 in the study population (Table 2). Among the total allelic subtypes in controls (N = 508 alleles in 121 healthy subjects) and patients (N = 604 alleles in 151 MS patients), GC1S was the predominant subtype present in almost equal frequencies in controls (N = 270, 53.15%) and patients (N = 306, 50.66%), p > 0.05 (Table 2). However, the frequency of GC1F allele was significantly higher in controls (N = 138, 27.17%) than in patients (N = 32, 5.3%) (p < 0.005) and the frequency of GC3 was significantly higher in patients (N = 172, 28.48%) than in controls (N = 28, 5.51%) (p < 0.005). GC2 frequencies were almost similar in controls (N = 72, 14.17%) and patients (N = 94, 15.56%), (p > 0.05). All p-values were generated using the Pearson chi-square test in Table 2.
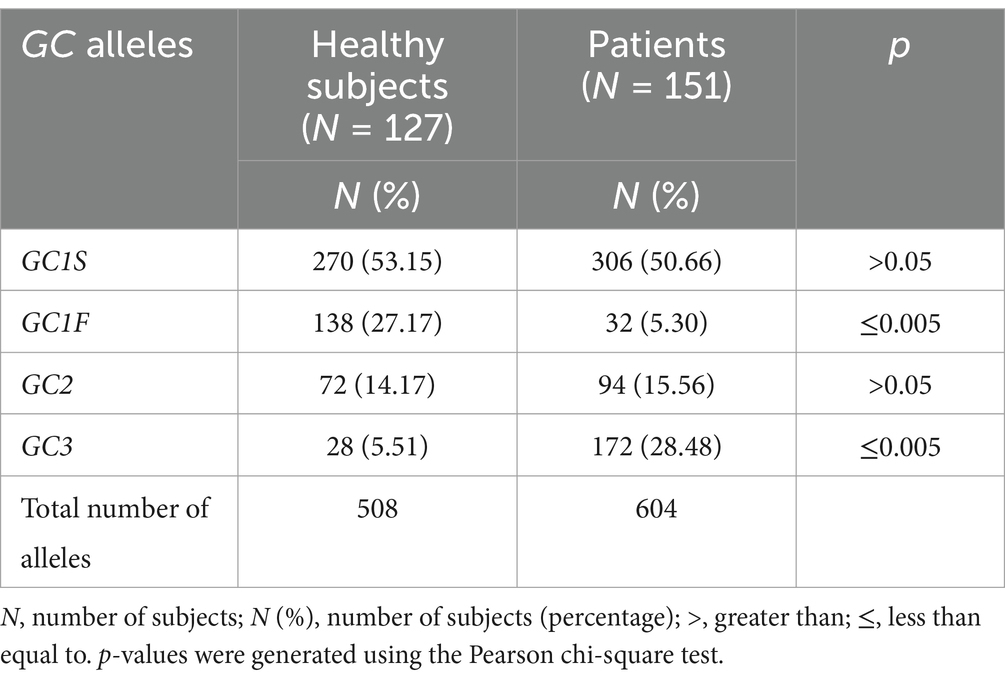
Table 2. Types of GC alleles in healthy subjects and MS patients.
Gc phenotypesIn the studied populations of controls and patients, different VDBP/GC alleles (GCa) resulted into nine Gc phenotypes. The comparative accounts of these phenotypes are presented in Table 3. The most common phenotype was Gc1S/Gc1S in both controls (N = 43, 33.6%) and patients (N = 49, 32.5%), followed by Gc1S/Gc2 + Gc1F/Gc3 [controls (N = 31, 24.4%) vs. patients (N = 30, 19.9%)], without any significant differences among controls and patients. However, significant differences were observed in the distribution of other phenotypes among controls and patients, i.e., the frequency of Gc1S/Gc1F phenotype was higher in controls than in patients (controls N = 33, 26.0% vs. patients: N = 1, 0.7%, pa < 0.001), Gc2/Gc1F was present only in controls (controls N = 14, 11.0% vs. patients N = 0, pb < 0.001); whereas, Gc1S/Gc3 (patients: N = 39, 25.9% vs. controls: N = 0, pa < 0.001) and Gc3/Gc3 (controls: N = 0, 0.0% vs. patients: N = 9, 6.0%, pa < 0.001) were found only in patients (Table 3). The phenotype Gc1F/Gc1F was present only in controls (N = 3, 2.4%) and not in patients (N = 0, 0.0%, pb 0.094), but the number was too low to give rise significant difference (Table 3). In Table 3 p-values were generated using the Pearson chi-square test (pa) Fisher’s Exact test (pb).

Table 3. Distribution of Gc phenotypes among the healthy controls and MS patients.
In a somatic cell (diploid cell), each chromosome is present in two copies and each GCa can be present in homozygous or heterozygous associations. On the basis of homozygous and heterozygous distributions, we clustered the Gc phenotypes into 5 phenotypic groups, which are Gc1S/Gc1S (homozygous at both loci without mutations, wild type), Gc1S/Gc3 + Gc2/Gc3 + Gc3/Gc3 (heterozygous at one locus and homozygous at the other), Gc1S/Gc2 + Gc1F/Gc3 (heterozygous at both loci), Gc1F/Gc1F + Gc1S/Gc1F + Gc2/Gc1F (homozygous at one locus and heterozygous at the other) and Gc2/Gc2 (homozygous at both loci with mutations) (Table 4). It was found that Gc1S/Gc1S was predominant with almost equal frequency in both the groups (healthy controls: N = 43, 33.9% vs. patients: N = 49, 32.5%, p = 0.799), followed by heterozygous Gc1S/Gc2/Gc1F/Gc3 (healthy controls: N = 31, 24.4% vs. patients: N = 30, 19.9%, p = 0.466). However, other Gc3 containing phenotypes (Gc1S/Gc3 + GC2/Gc3 + Gc3/Gc3) were present only in patients but not in controls (healthy controls: N = 0, 0.0% vs. patients: N = 62, 41.1%; p < 0.001) and the presence of Gc1F containing phenotypes (Gc1F/Gc1F + Gc1S/Gc1F + Gc2/Gc1F) was significantly higher in controls than in patients (healthy controls: N = 50, 39.4% vs. patients: N = 1, 0.7%; p < 0.001). The distribution of mutant homozygous phenotype Gc2/Gc2 did not significantly differ in patients and controls (Table 4). In Table 4, p-values were generated using the Mann–Whitney test.
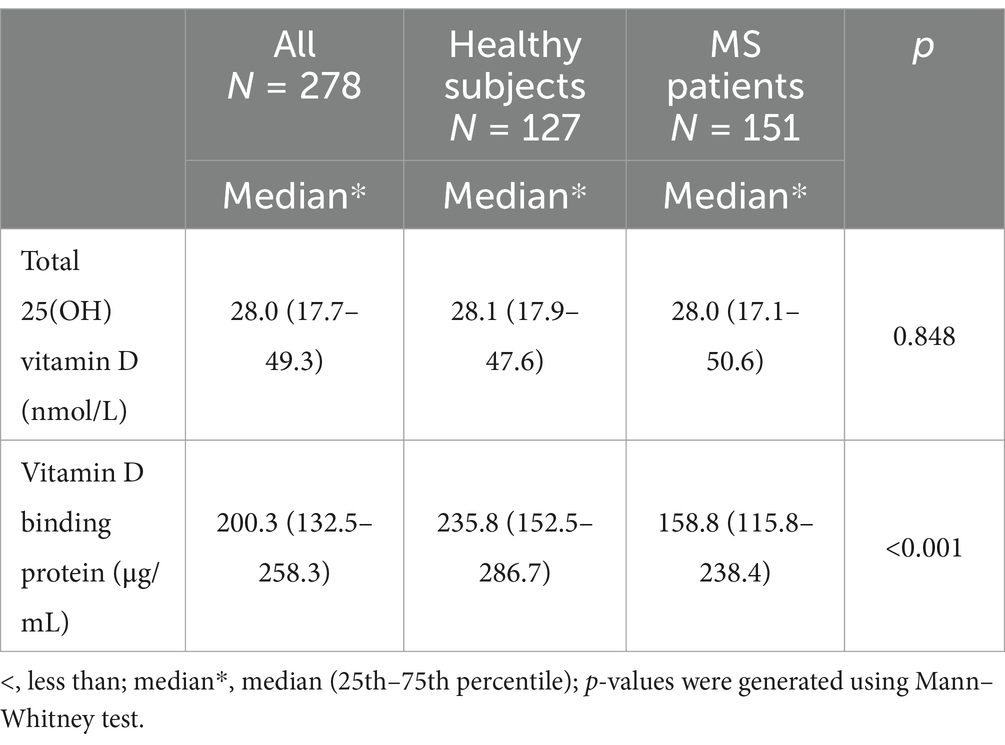
Table 4. Concentration of 25(OH)vitamin D and VDBP in serum.
Serum 25(OH)vitamin D and VDBP levels in the study groupsIn the studied subjects, hypovitaminosis D (<50 nmol/L) was common in both patients and controls and they were equally deficient in total 25(OH)vitamin D (nmol/L) level [controls: 28.1 (17.9–47.6) vs. patients: 28.0 (17.1–50.6); p = 0.848]; total 25(OH)vitamin D (nmol/L) represented by median (25th–75th percentile) (Table 5). However, the serum level of VDBP (μg/mL) was significantly higher in controls than in patients [controls: 235.8 (152.5–286.7) vs. patients: 158.8 (115.8–238.4); p = <0.001] represented by median (25th–75th percentile) (Table 5); p-values were generated using the Mann–Whitney test.
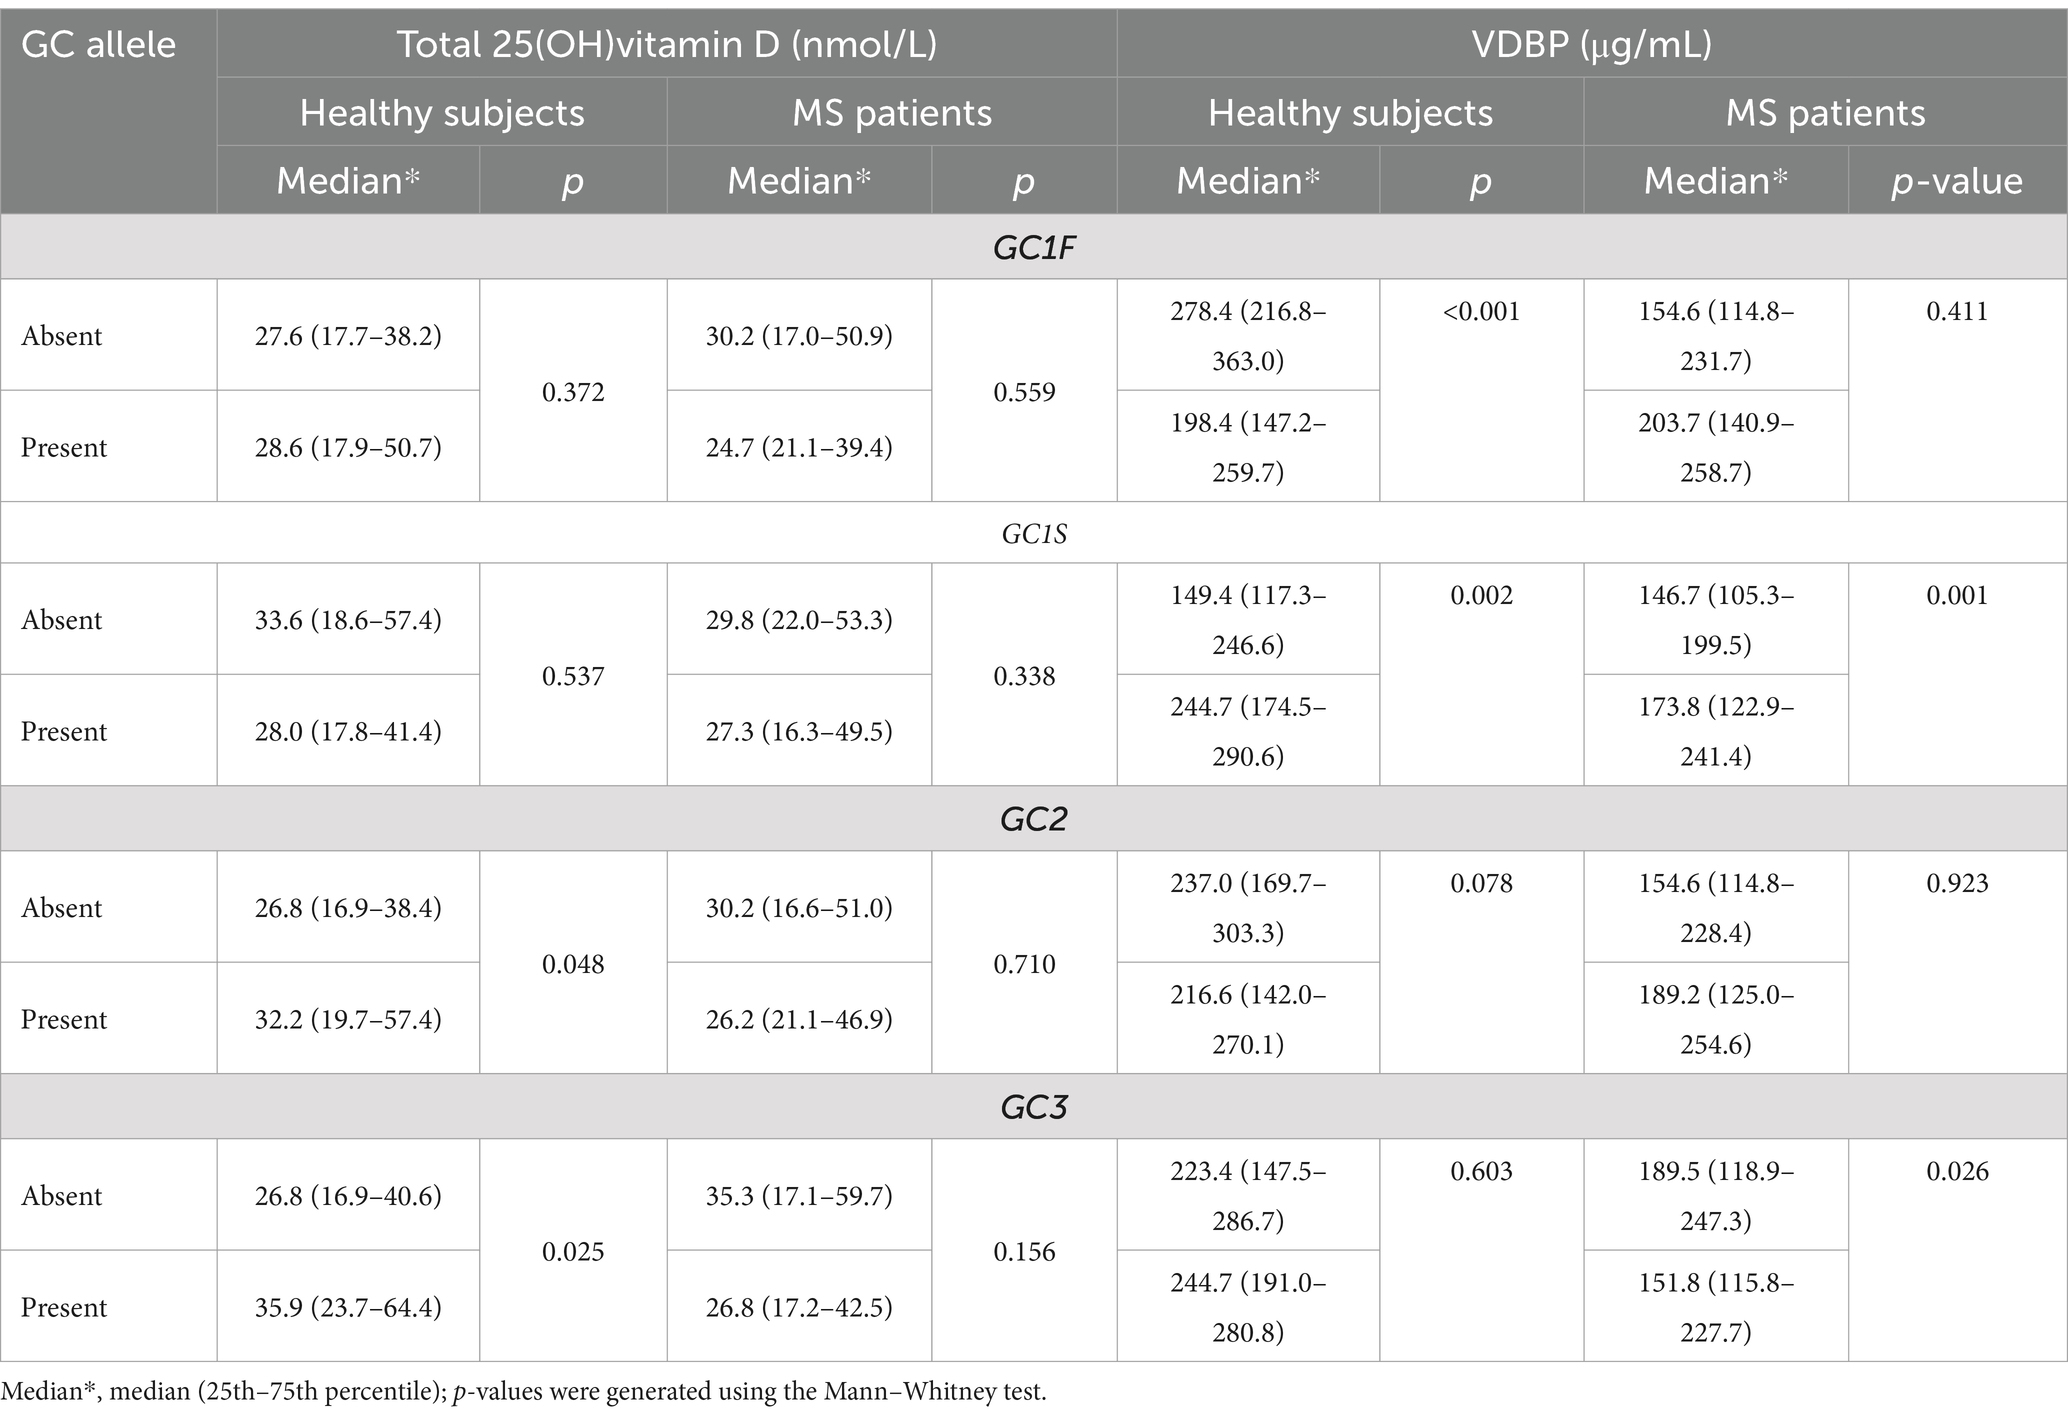
Table 5. The serum concentrations of total 25(OH)vitamin D and VDBP in relation to the absence or presence or of various GC alleles.
Serum 25(OH)vitamin D and VDBP levels in relation to GCaThe analysis of vitamin D and VDBP levels in sera of patients and controls showed that all of them were vitamin D deficient (<50 nmol/L) in relation to the presence or absence of all the four GCa (Table 6). The role of each GCa on serum 25(OH)vitamin D and VDBP concentrations was analyzed by comparing their concentrations in the presence and absence of specific GCa in the study cohort (Table 6). These analyses revealed no association between the presence or absence of any of the four GCa and the total 25(OH)vitamin D levels in patients and controls. However, the presence of GC1S allele was linked to higher levels of VDBP in both controls (p < 0.002) and patients (p < 0.001). Despite this, patients having the GC1S allele exhibited lower VDBP concentrations compared to controls. On the other hand, the presence of GC1F allele was associated with significantly lower level of VDBP in controls only (p < 0.001), and the presence of GC3 allele was significantly associated with lower level of VDBP in patients only (p < 0.026) (Table 6). There was no significant difference in the concentration of VDBP level in controls.
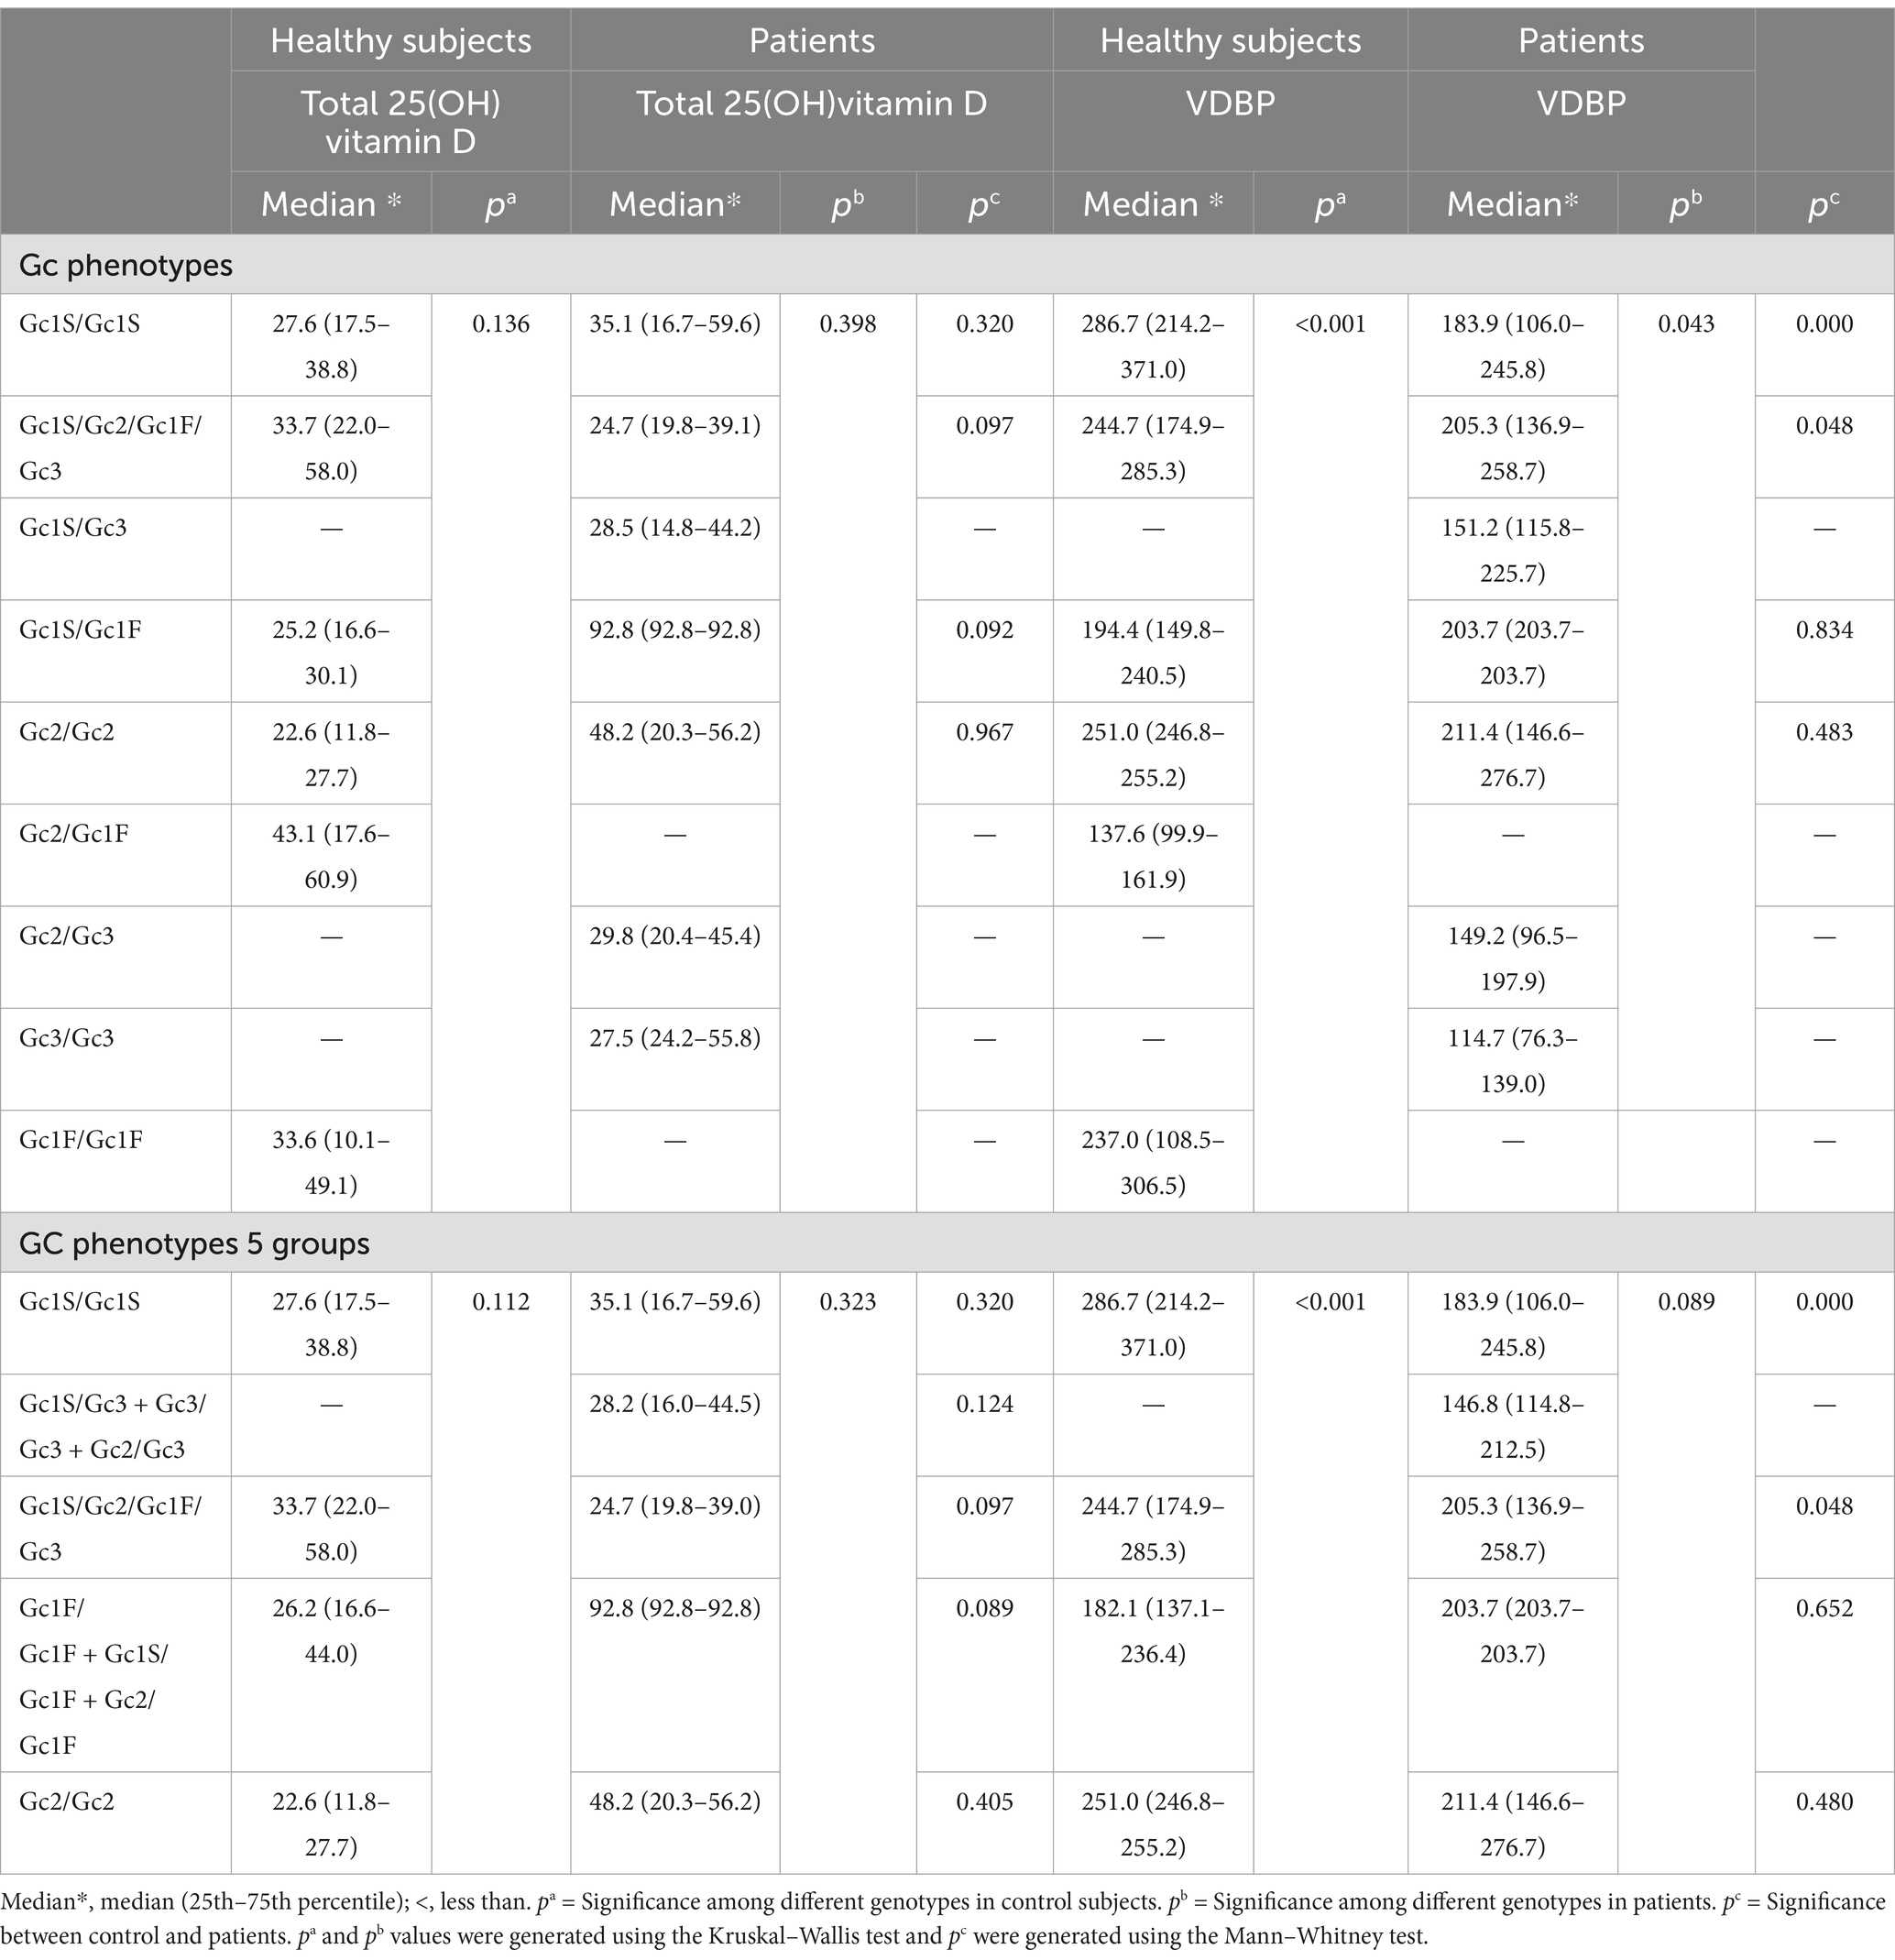
Table 6. The serum concentrations of total 25(OH)vitamin D (nmol/L) and VDBP (μg/mL) in relation to various Gc phenotypes.
Serum 25(OH)vitamin D and VDBP levels in relation to Gc phenotypesThe analysis of 25(OH)vitamin D and VDBP levels in sera of patients and controls showed that all of them were vitamin D deficient (<50 nmol/L) or insufficient (50–75 nmol/L) in relation to various Gc phenotypes, except one patient, having Gc1S/Gc1F phenotype, was associated with sufficient level of 25(OH)vitamin D, i.e., >75 nmol/L (Table 6). This was possibly an outlier than a norm. The VDBP level in healthy controls were significantly lower in subjects with phenotypes Gc1F/Gc1F + Gc2/Gc1F + Gc1S/Gc1F (Table 6). The comparisons of VDBP levels showed that the patients with Gc1S/Gc1s and Gc1S/Gc2/Gc1F/Gc3 phenotypes had significantly lower levels than controls (Table 6).
DiscussionThis study was performed to determine the association of VDBP/Gc genotypes and phenotypes with the concentrations of 25(OH)vitamin D and VDBP in healthy subjects and MS patients of Kuwaiti nationality. The results showed the presence of four alleles in Kuwaiti population, i.e., GC1S, GC1F, GC2, and GC3. Among these, GC1S and GC2 were present in both homozygous and heterozygous combinations in healthy subjects and MS patients, while GC3 was present in both homozygous and heterozygous combinations in MS patients but it was present only in heterozygous combinations in healthy subjects. In contrast, GC1F was present in both homozygous and heterozygous combinations in healthy subjects but it was present only in heterozygous combinations in MS patients. Most of the previous studies have shown the existence of only three alleles of GC, i.e., GC1S, GC1F, and GC2 in various populations around the world (37–39), including the Middle East (40–42). The fourth allele GC3 was reported only in a single study conducted in a young and healthy Lebanese population (43). Recently, we reported the presence of the rare allele GC3 in Kuwaiti subjects (21). However, as compared to our study in which GC3 was present only in a heterozygous combination in healthy subjects, in the Lebanese study, GC3 was present in both homozygous and heterozygous combinations in healthy subjects. It is worth mentioning here that the Lebanese study did not include any patient group to compare the frequency GC3 with the healthy subjects (43).
The analyses of our results with respect to GCa and association with MS patients and healthy subjects revealed that the frequency of GC1F was significantly higher in healthy controls and GC3 was significantly higher in MS patients, whereas there were no significant differences for the frequencies of GC1S, and GC2 alleles in the healthy controls and MS patients. These results suggest that GC1F may be protective and GC3 pathogenic for MS. Previous studies conducted in Japan, Canada and Italy did not include GC3 in their experiments and GC1F was not associated with protection or pathogenesis against MS (13, 24, 25, 44). The results obtained in our study may be population-specific because population-specific associations for GCa have been reported in other diseases, e.g., chronic obstructive pulmonary disease (40, 45). However, the association of GC1F with protection has been reported in other diseases, like cancer (46).
We observed that the homozygous alleles (TT/CC) at both loci (rs4077/rs4588) leading to the phenotype Gc1F/Gc1F and homozygous alleles at one locus and heterozygous alleles at the other locus (GT/CC or TT/CA) leading to phenotypes Gc1S/Gc1F or Gc2/Gc1F were expressed at higher frequency in controls than patients. Whereas GC3 homozygous alleles (GG/AA) at both loci (rs4077/rs4588) leading to phenotype Gc3/Gc3 and homozygous alleles at one locus and heterozygous alleles at the other locus (GG/CA and GT/AA) leading to phenotypes Gc1S/Gc3 and Gc2/Gc3 were expressed at higher frequency in patients than controls. However, the phenotype containing both Gc1F and Gc3 in a single individual, i.e., Gc1S/Gc2/Gc1F/Gc3 due to heterozygous alleles GT/CA at both loci (rs4077 and rs4588), was expressed in equal frequencies in both MS patients and healthy subjects. These results suggest that the presence of the Gc3 and Gc1F in the same individual appeared to nullify their independent pathogenic and protective effects.
Our study indicates that both groups of subjects were deficient in 25(OH)vitamin D levels in blood and that there were no significant differences in the 25(OH)vitamin D levels in the two groups. These results are compatible with a previous report from Kuwait showing vitamin D deficiency in both healthy subjects and MS patients (47). Furthermore, no differences in the vitamin D level among healthy subjects and MS patients have been reported from other parts of the world as well (48), and no significant association between high-dose vitamin D treatment and risk of MS relapses was found in a meta-analysis published in 2013 (49). However, an increasing volume of work suggests that lower levels of serum vitamin D are associated with an increased risk of MS and a more severe disease course (50). Furthermore, recent study has suggested that vitamin D supplementation may have a therapeutic role in the treatment of MS and improvements in disease measures may be more apparent in those with lower baseline vitamin D levels (51).
Our finding that GC3 and GC1F are associated with the incidence of MS is in line with Gezmis’s et al. (52) observation that rs4588 variations are associated with an increased risk of developing MS. However, since all our patients and controls had vitamin D deficiency, we were unable to find a link between the two conditions.
We noted that VDBP concentrations were significantly higher in controls than in patients. As VDBP binds vitamin D, the higher concentrations of VDBP may be associated with lower concentrations of vitamin D in serum (53). However, our results did not support this hypothesis as vitamin D concentrations were similar and insufficient in both controls and MS patients. Our results in this and a previous study indicate that lower VDBP levels could be associated with MS pathogenesis (26). Somewhat similar results have been reported by Qin et al. (23) showing that lower concentrations of VDBP were found in the cerebrospinal fluid of relapsing and remitting MS patients during acute relapse compared to patients with other neurological diseases. However, some other studies have either shown a lack of association for VDBP level in MS patients (49, 54), or presence of an increased concentration of it in MS patients (55, 56). The difference in our study and the previous studies could be due to the variations in the studied populations.
In both groups, no significant difference in 25(OH)vitamin D levels was noted among healthy subjects and MS patients carrying various Gc phenotypes. However, we observed a protective role of Gc1F against MS risk in our cohort. Given that higher levels of 25(OH)vitamin D were associated with a lower risk of MS (57), our result aligned with those of Agnello et al. (44) who reported that patients who carried Gc1F showed higher plasma levels of Vitamin D. In this regard, it is worth to acknowledge that vitamin D is known to have some important immunomodulatory roles in the activation of T cells and their homeostasis (58), and the low VDBP in the cerebrospinal fluid during MS relapses might be mediated by vitamin D deficiency related activation of cellular immunity mediated by T cells. VDBP also regulates the availability of vitamin D and its response to antimicrobial monocytes (59). Hence, it is hypothesized that changes in VDBP levels are capable of favoring infections that are associated with relapses in MS patients (59).
Furthermore, the VDBP concentrations were significantly less in the serum of MS patients than controls with respect to the homozygous Gc phenotype Gc1S/Gc1S and heterozygous Gc phenotype Gc1S/Gc2/Gc1F/Gc3 (Table 6). However, as discussed above, these phenotypes are not associated with MS risk in Kuwaiti population. The concentrations of VDBP among MS patients and healthy subjects could not be due to phenotypes associated with MS pathogenesis (Gc1S/Gc3 + Gc3/Gc3 + Gc2/Gc3) and protection (Gc1F/Gc1F + Gc1S/Gc1F + Gc2/Gc1F) because the phenotypes Gc1S/Gc3 + Gc3/Gc3 + Gc2/Gc3 were absent in healthy subjects and only one MS patient had the phenotypes Gc1F/Gc1F + Gc1S/Gc1F + Gc2/Gc1F. We could not find any published study in the English literature to compare the levels of VDBP in relation to VDBP/Gc phenotypes in MS patients.
One important limitation of this study is that like any other case–control study the potential for recall bias cannot be ruled out. Though, an appropriate control group is recruited in this study, the expression of biochemical variables can be influenced by environmental and sociocultural practice like available solar intensity, dietary habit, shrouded dressing, and exposure to sunlight to name a few.
The results of this study have the potential to stimulate researchers from other parts of the world to look for such associations in their patients. Thus, our results, in addition to being relevant for Kuwait and the Gulf Region, may also have global implications.
ConclusionIn this study, we identified three common VDBP/GC subtypes (GC1S, GC1F, GC2) previously reported in the literature and the novel subtypes GC3 in both MS patients and healthy subjects. The GC3 was not previously reported in MS patients. The subtype GC1F was associated with protection and GC3 had association with pathogenesis in MS. However, when both GC1F and GC3 were present in the same individual, they appear to nullify their independent effect. Vitamin D levels were deficient in both patients and controls and there were no associations with the vitamin D level and different GCa alleles and phenotypes. On the other hand, VDBP concentrations were significantly low in MS patients than healthy subjects.
To the best of our knowledge, this is the first study showing the association of varying VDBP/GC genotypes and phenotypes in protection as well as pathogenesis of MS in Kuwaiti nationals. Moreover, our study has shown that there is generalized hypovitaminosis D in Kuwaiti population, which reinforces the idea that effective measures should be taken to overcome the problem in public. Furthermore, the association of VDBP/GC genotypes and phenotypes with MS in Kuwaiti patients opens the door for similar studies in the Gulf Region.
Data availability statementThe raw data supporting the conclusions of this article will be made available by the authors, without undue reservation.
Ethics statementThe study was approved by the Ethics Committees of the Health Sciences Centre, Kuwait University (approval number-VDR/EC/3073-June-6, 2017). The study was conducted in accordance with the local legislation and institutional requirements. The participants provided their written informed consent to participate in this study.
Author contributionsSA-S: Conceptualization, Funding acquisition, Investigation, Project administration, Resources, Supervision, Visualization, Writing – review & editing. AC: Data curation, Formal analysis, Investigation, Project administration, Resources, Software, Validation, Writing – original draft, Writing – review & editing. AM: Conceptualization, Investigation, Methodology, Resources, Supervision, Visualization, Writing – review & editing.
FundingThe author(s) declare that financial support was received for the research, authorship, and/or publication of this article. This study was supported by Kuwait University Research Sector Grants MM02/17 and SRUL02/13. The funders role are limited to funding of the research only.
AcknowledgmentsThe authors are grateful to Mr. Joseph Edison Gomes for helping in statistical analysis and to Mr. Numeer Kadungothayil and Mr. Mohd. Amir Shaikh for their contribution in the experimental work.
Conflict of interestThe authors declare that the research was conducted in the absence of any commercial or financial relationships that could be construed as a potential conflict of interest.
Publisher’s noteAll claims expressed in this article are solely those of the authors and do not necessarily represent those of their affiliated organizations, or those of the publisher, the editors and the reviewers. Any product that may be evaluated in this article, or claim that may be made by its manufacturer, is not guaranteed or endorsed by the publisher.
References3. Al-Din, ASN, Khogali, M, Poser, CM, Al-Nassar, KE, Shakir, R, Hussain, J, et al. Epidemiology of multiple sclerosis in Arabs in Kuwait: a comparative study between Kuwaitis and Palestinians. J Neurol Sci. (1990) 100:137–41. doi: 10.1016/0022-510X(90)90024-H
PubMed Abstract | Crossref Full Text | Google Scholar
4. Alshubaili, AF, Alramzy, K, Ayyad, YM, and Gerish, Y. Epidemiology of multiple sclerosis in Kuwait: new trends in incidence and prevalence. Eur Neurol. (2005) 53:125–31. doi: 10.1159/000085556
PubMed Abstract | Crossref Full Text | Google Scholar
5. Al-Shammri, S, Nelson, R, Al-Muzairi, I, and Akanji, A. HLA determinants of susceptibility to multiple sclerosis in an Arabian Gulf population. Mult Scler. (2004) 10:381–6. doi: 10.1191/1352458504ms1065oa
PubMed Abstract | Crossref Full Text | Google Scholar
7. Lucas, RM, Ponsonby, AL, Dear, K, Valery, PC, Pender, MP, Taylor, BV, et al. Sun exposure and vitamin D are independent risk factors for CNS demyelination. Neurology. (2011) 76:540–8. doi: 10.1212/WNL.0b013e31820af93d
PubMed Abstract | Crossref Full Text | Google Scholar
8. Al-Shammri, SN. Sociocultural and demographic risk factors for the development of multiple sclerosis in Kuwait: a case—control study. PLoS One. (2015) 10:e0132106. doi: 10.1371/journal.pone.0132106
PubMed Abstract | Crossref Full Text | Google Scholar
9. Kampman, MT, Wilsgaard, T, and Mellgren, SI. Outdoor activities and diet in childhood and adolescence relate to MS risk above the Arctic Circle. J Neurol. (2007) 254:471–7. doi: 10.1007/s00415-006-0395-5
PubMed Abstract | Crossref Full Text | Google Scholar
10. Munger, KL, Levin, LI, Hollis, BW, Howard, NS, and Ascherio, A. Serum 25-hydroxyvitamin D levels and risk of multiple sclerosis. JAMA. (2006) 296:2832–8. doi: 10.1001/jama.296.23.2832
PubMed Abstract | Crossref Full Text | Google Scholar
11. Olsson, T, Barcellos, LF, and Alfredsson, L. Interactions between genetic, lifestyle and environmental risk factors for multiple sclerosis. Nat Rev Neurol. (2017) 13:25–36. doi: 10.1038/nrneurol.2016.187
PubMed Abstract | Crossref Full Text | Google Scholar
13. Orton, SM, Ramagopalan, SV, Para, AE, Lincoln, MR, Handunnetthi, L, Chao, MJ, et al. Vitamin D metabolic pathway genes and risk of multiple sclerosis in Canadians. J Neurol Sci. (2011) 305:116–20. doi: 10.1016/j.jns.2011.02.032
PubMed Abstract | Crossref Full Text | Google Scholar
14. Smolders, J, Menheere, P, Kessels, A, Damoiseaux, J, and Hupperts, R. Association of vitamin D metabolite levels with relapse rate and disability in multiple sclerosis. Mult Scler. (2008) 14:1220–4. doi: 10.1177/1352458508094399
PubMed Abstract | Crossref Full Text | Google Scholar
15. Simpson, S Jr, Taylor, B, Blizzard, L, Ponsonby, AL, Pittas, F, Tremlett, H, et al. Higher 25-hydroxyvitamin D is associated with lower relapse risk in multiple sclerosis. Ann Neurol. (2010) 68:193–203. doi: 10.1002/ana.22043
PubMed Abstract | Crossref Full Text | Google Scholar
16. Chiuso-Minicucci, F, Ishikawa, LL, Mimura, LA, Fraga-Silva, TF, França, TG, Zorzella-Pezavento, SF, et al. Treatment with vitamin D/MOG association suppresses experimental autoimmune encephalomyelitis. PLoS One. (2015) 10:e0125836. doi: 10.1371/journal.pone.0125836
Crossref Full Text | Google Scholar
17. Hammack, BN, Fung, KYC, Hunsucker, SW, Duncan, MW, Burgoon, MP, Owens, GP, et al. Proteomic analysis of multiple sclerosis cerebrospinal fluid. Mult Scler. (2004) 10:245–60. doi: 10.1191/1352458504ms1023oa
PubMed Abstract | Crossref Full Text | Google Scholar
18. Lehmensiek, V, Süssmuth, SD, Tauscher, G, Brettschneider, J, Felk, S, Gillardon, F, et al. Cerebrospinal fluid proteome profile in multiple sclerosis. Mult Scler. (2007) 13:840–9. doi: 10.1177/1352458507076406
PubMed Abstract | Crossref Full Text | Google Scholar
20. Kamboh, MI, and Ferrell, RE. Ethnic variation in vitamin D-binding protein (GC): a review of isoelectric focusing studies in human populations. Hum Genet. (1986) 72:281–93. doi: 10.1007/BF00290950
PubMed Abstract | Crossref Full Text | Google Scholar
21. Al-Shammri, SN, Mustafa, AS, and Bhattacharya, A. Distribution of vitamin D-binding protein/group-specific component gene subtypes in Kuwaiti population. Mol Genet Genomic Med. (2022) 10:e1930. doi: 10.1002/mgg3.1930
PubMed Abstract | Crossref Full Text | Google Scholar
22. Malik, S, Fu, L, Juras, DJ, Karmali, M, Wong, BYL, Gozdzik, A, et al. Common variants of the vitamin D binding protein gene and adverse health outcomes. Crit Rev Clin Lab Sci. (2013) 50:1–22. doi: 10.3109/10408363.2012.750262
PubMed Abstract | Crossref Full Text | Google Scholar
24. Niino, M, Kikuchi, S, Fukazawa, T, Yabe, I, and Tashiro, K. No association of vitamin D-binding protein gene polymorphisms in Japanese patients with MS. J Neuroimmunol. (2002) 127:177–9. doi: 10.1016/s0165-5728(02)00099-1
留言 (0)