
記住我


In CICD patients, a small part (20–40 mm2) of DM tissue just near the recipient artery (the M4 segment of the middle cerebral artery on the ipsilateral side) was harvested during surgical procedures. The samples were stored at -80 °C. During the follow-up, digital subtraction angiography (DSA) images were used to determine the Matsushima grade (grade A, more than two-thirds of the middle cerebral artery circulation was fulfilled; grade B, one-third to two-thirds fulfillment; and grade C, less than one-third fulfillment). The expression levels of cuproptosis-related genes (DLAT, FDX1 and SDHB) in DM samples harvested from patients with Matsushima grade A (n = 8) and Matsushima grade C (n = 8) disease were compared via western blotting (WB) and real-time quantitative PCR (qPCR) analysis.
HUVEC culture and subgroupingHUVECs were obtained from the Shanghai Institute of Life Sciences, Chinese Academy of Sciences, and were cultured in Dulbecco’s modified Eagle’s medium (DMEM; Thermo Fisher Scientific, USA) supplemented with 10% fetal bovine serum and 100 U penicillin‒streptomycin at 37 °C in a Tri-gas incubator (Hypoxia, Directheat and air jacket, 637 × 768 × 869 mm, Heal Force). HUVECs were used for in vitro research and experiments until passage 6. HUVECs in the normoxic group were cultured at 37 °C in 21% O2 and 5% CO2. The cells in the hypoxia group were cultured at 37 °C in 1% O2, 5% CO2 and 94% N2. The subgroup information is shown in Table 1.
Table 1 Subgrouping of HUVECsHUVEC transfectionThe MT2A overexpression plasmid, small interfering RNA targeting MT2A, and negative control (NC) were constructed by Hanheng Biotechnology (Shanghai, CN). HUVECs were transfected with Lipofectamine 2000 (Invitrogen; Carlsbad, CA), following the manufacturer’s protocol. The transfection efficiency was determined via qPCR and WB, while the effects of MT2A transfection on HUVEC viability and mitochondrial function under hypoxia were examined via CCK-8 and JC-10. The subgroup information of MT2A-transfected cells is shown in Table 2.
Table 2 Subgrouping of HUVECs after transfectionReal-time qPCRTotal RNA was extracted via TRIzol (Thermo Scientific Co., Ltd.) according to the manufacturer’s instructions, and the concentration of total RNA was measured via a NanoDrop spectrophotometer. RNA (1000 ng) from each sample was reverse transcribed into cDNA via a RevertAid™ First Strand cDNA Synthesis Kit (Thermo Scientific Co., Ltd.) according to the manufacturer’s instructions. Finally, the cDNA was mixed with primers and 2X SYBR Green Fast qPCR Mix (ABclonal, Inc.), and the mRNA levels were determined via a qPCR instrument. The relative expression level of the target gene was normalized to that of β-actin. The primers spanned exons for each gene. The primer sequences are shown in Table S1.
Cell counting Kit-8 (CCK-8)A CCK-8 (Beyotime, China) assay was utilized to quantitatively evaluate cell viability. HUVECs were seeded onto 96-well culture plates, incubated for 24 h and then pretreated with increasing concentrations of elesclomol (LGM Pharma, USA) (0 nM, 1 nM, 10 nM, 100 nM, 1 µM, 10 µM, 100 µM, 1 mM, 10 mM, or 100 mM) and CuCl2 (0.1 µM, 1 µM, or 10 µM for all groups except the control group) for 48 h. Where specified, CuCl2 (1 µM) was added to the media 30 min before the addition of elesclomol. Then, CCK-8 reagent (10 µM) was added to each well, and the samples were incubated at 37 °C for 2 h. The absorbances at 450 nm were determined at 48 h after the elesclomol + CuCl2 treatment via a microplate reader (BioTek Instruments, USA). DMEM containing 10% CCK-8 reagent was used as a blank. Each experiment was repeated at least three times.
MitoTracker Red stainingThe cells were stained with MitoSOX Red Mitochondrial Superoxide Indicator (Yeasen, China) and Hoechst 33,342 (Cell Signaling Technology, MA). The cells at 80 − 90% confluence were treated with elesclomol with (without) CuCl2 for 30 min. Next, the cells were incubated with the MitoSOX Red Mitochondrial Superoxide Indicator for 10 min at 37 °C. Then, the cells were washed with PBS (Beyotime, China) and stained with Hoechst 33,342 labeling solution (1:10000) for 10 min at room temperature. The cells were observed under a fluorescence microscope (Olympus IX71). Each experiment was repeated at least three times.
JC-10The mitochondrial activity in cells was determined by JC-10. HUVECs were washed with PBS (Beyotime, China) and incubated with 5 µM JC-10 for 30 min in the dark. The fluorescence intensity of both the J-aggregate and monomeric forms of JC-10 was measured via a flow cytometer. Red fluorescence was monitored at excitation and emission wavelengths of 585 and 590 nm, and green fluorescence was monitored at excitation and emission wavelengths of 515 and 529 nm. After the blank values were subtracted, the red/green fluorescence ratios per cell were calculated. Each experiment was repeated at least three times.
Transmission electron microscopy (TEM)Cell mitochondrial aberrations, such as mitochondrial swelling and the appearance of vacuoles, were observed via TEM. After treatment and trypsinization, the cells were centrifuged at 1200 rpm/min for 5 min and fixed with 4% glutaraldehyde at 4 °C for 2 h. The cells were then incubated at 4 °C with 1% osmium tetroxide for 1 h, dehydrated with alcohol and acetone, and embedded in Epon 816 (Electron Microscopy Sciences, Hatfield, PA, USA). Ultrathin sections were prepared with a Leica ultramicrotome (Leica Microsystems, Buffalo Grove, IL, USA) and stained with uranyl acetate and lead citrate. TEM images were obtained via a JEM-1400Plus transmission electron microscope (HEOL, Ltd. Tokyo, Japan). Mitochondria were counted manually and the mitochondrial minor axis length was measured by ImageJ software. Abnormal mitochondria were identified as mitochondria containing vacuoles and mitochondrial with an abnormal size. Each experiment was repeated at least three times.
Tube formation testThe ability of HUVECs to form tube-like structures was determined via a tube formation test. A 96-well plate was coated with 50 µl of Matrigel per well, and HUVECs were subsequently seeded in the Matrigel-coated 96-well plate at a density of 1.5 × 10⁴ cells per well. After 6 h, pictures were taken with a light microscope (Olympus, Tokyo, Japan), and the Angiogenesis Analyzer plugin of ImageJ was used to determine the number of meshes, branches, and nodes in capillary-like structures in five random fields of view (×100). Each experiment was repeated at least three times.
Scratch wound assayThe migration ability of HUVECs was determined via a scratch wound assay. After the medium was replaced with serum-free medium, HUVECs in the 6-well plates were scratched with a micropipette tip and washed with PBS. After 24 h of incubation, the degree of wound closure was observed, and the wound width was measured via ImageJ software. The migration ability was evaluated by the percentage of wound closure. Each experiment was repeated at least three times.
Transwell migration assayThe migration ability of HUVECs was also determined via a Transwell migration assay. HUVECs (1 × 10⁴) were resuspended in serum-free medium and inoculated onto the upper Transwell chamber layer. After 24 h of incubation, the cells in the lower layer were stained with crystal violet (Beyotime, China). The number of stained cells was determined via ImageJ software, which indicates the degree of HUVEC migration. Each experiment was repeated at least three times.2.12. Animals and subgrouping.
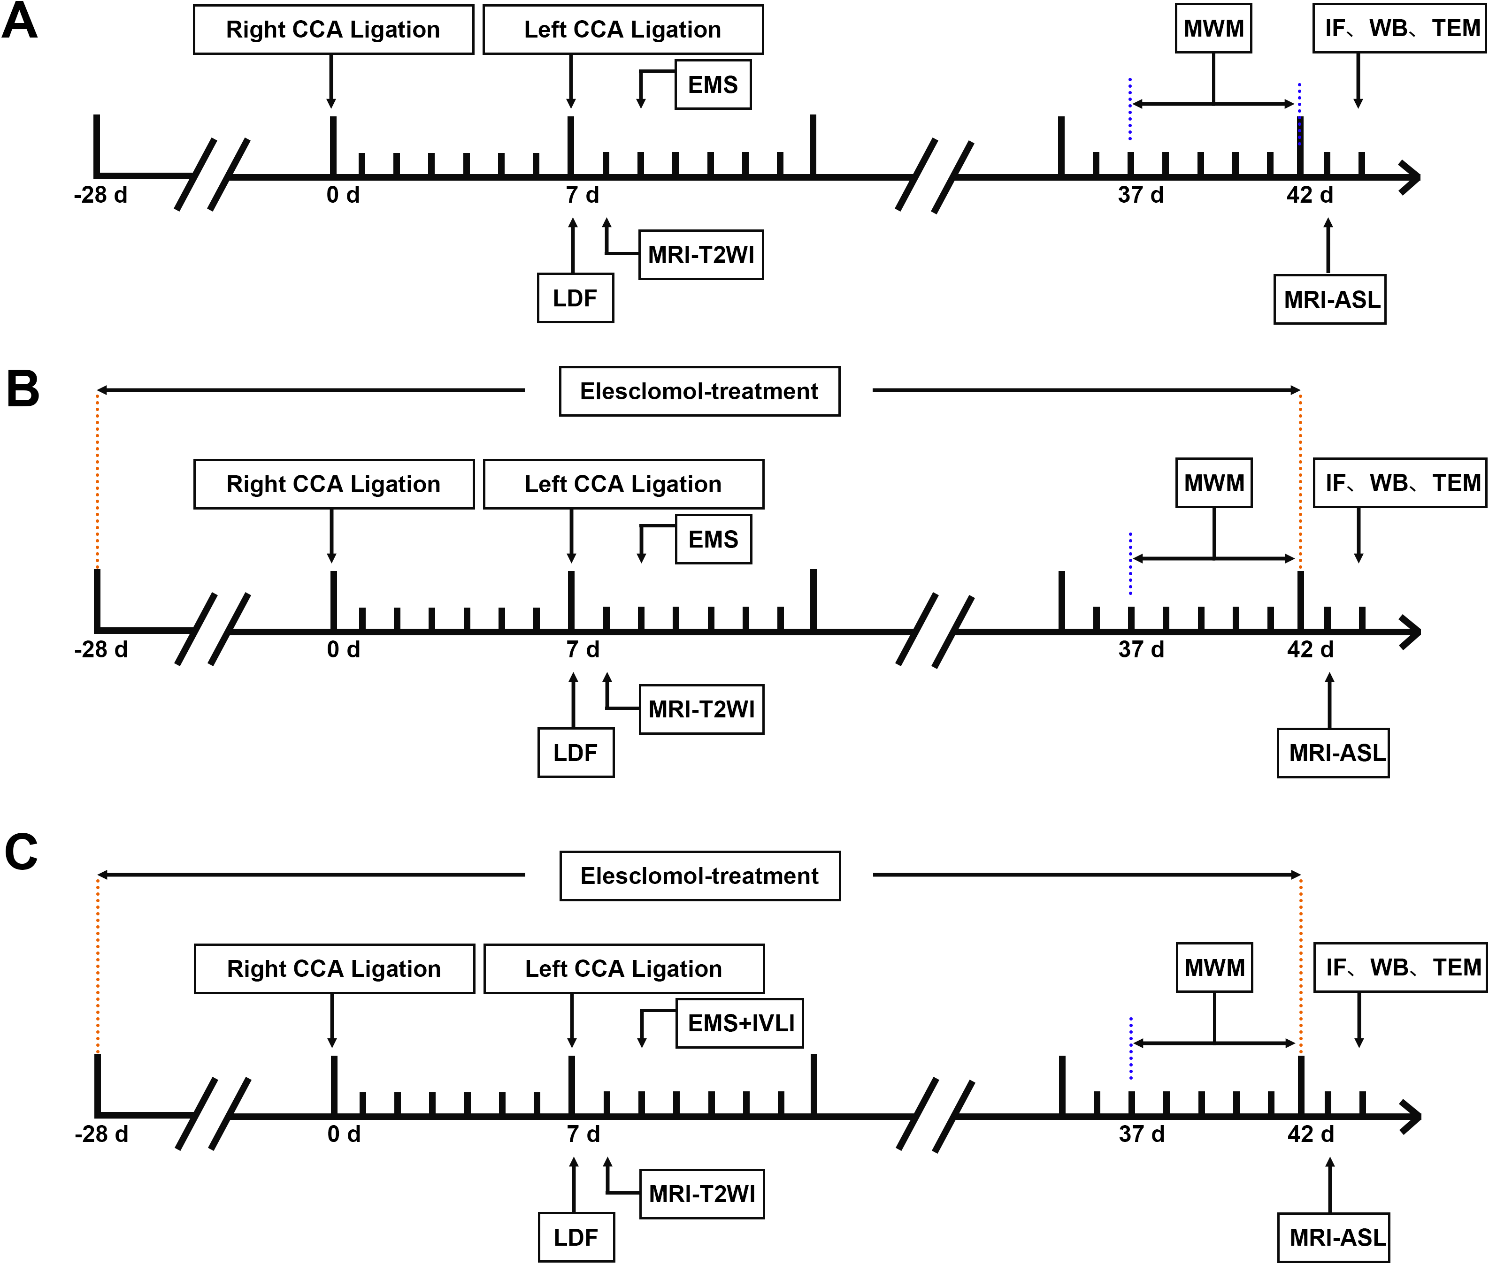
Adult male Sprague–Dawley (SD) rats (8–9 weeks of age, 300–320 g) were obtained from the Institute of Experimental Animals of Sun Yat-Sen University and were housed in temperature-controlled facilities with a 12:12 h light cycle. The rats had access to water and food ad libitum. Before intraventricular lentivirus injection, based on the materials we used during EMS, the rats were randomly divided into the following groups: (1) the Control group, (2) the 2VO + EMS group, and (3) the 2VO + EMS + CPO group. Based on the materials injected and transfected during EMS, the remaining rats were randomly divided into the following groups: (1) the control group (2VO + EMS), (2) the CPO group, (3) the CPOMT2A+ (NC) group, (4) the CPOMT2A+ group, (5) the CPOMT2A− (NC) group, and (6) the CPOMT2A− group. The experimental schedule is presented in Fig. 1. The animal experiment was performed in compliance with the ARRIVE guidelines and approved by the Animal Ethics Committee of Guangzhou Huateng Biopharmaceutical Technology Co., Ltd. (IACUC No. C202304-5). The subgroups of SD rats are shown in Tables 3 and 4.
Fig. 1
Experimental schedule. (A) Schedule used for observing the effects of EMS on EC proliferation, CBP and cognitive function in 2VO + EMS rats. (B) Schedule used for observing the effects of elesclomol on EC proliferation, CBP and cognitive function in 2VO + EMS rats. (C) Schedule used for observing the effects of MT2A on EC proliferation, CBP and cognitive function in 2VO + EMS rats during CPO. EMS: encephalo-myo-synangiosis; EC: endothelial cell; CBP: cerebral blood perfusion; CPO: copper overload; LDF: laser Doppler flowmetry; CCA: common carotid artery; MWM: Morris water maze; IF: immunofluorescence; WB: western blotting; TEM: transmission electron microscopy; IVLI: intraventricular lentivirus injection
Table 3 Subgrouping of SD rats for the animal experiments before IVLITable 4 Subgrouping of SD rats for the animal experiments with IVLIInduction of CPO in SD ratsThe rats were fed elesclomol to introduce CPO. Starting at postnatal week 9 (PNW9), the rats were treated with elesclomol or vehicle by gavage every 2 days until they were sacrificed. The body weights of the rats were recorded every day from PNW9 until sacrifice. Based on the individual rat weight, elesclomol (10 mg/kg) was dissolved in dimethyl sulfoxide (DMSO) and then mixed with 5% methyl cellulose solution (Sigma) to reach a 2% final concentration of elesclomol-DMSO. The vehicle control solution contained 0.5% methyl cellulose solution with 2% DMSO.
Induction of chronic cerebral ischemia (CCI)A model of CCI was established via 2VO. Briefly, each rat was anesthetized by inhaling isoflurane (3% for induction, 1.5% for maintenance, 0.6 l/min oxygen flow; RWD, China) and placed on an animal operating table on which a heating pad was placed to maintain body temperature at 37 °C. The right common carotid artery (CCA) was exposed before ligation with two 3–0 silk wires. After a 7-day recovery period, the left CCA was exposed and ligated via the same surgical technique.
Cerebral blood flow (CBF) was measured with laser Doppler flowmetry (LDF) before and after surgery and is expressed as a percentage relative to the baseline values. The successful establishment of the 2VO model was based on the following: (I) the CBF decreased by at least 30% before surgery; and (II) no significant cerebral infarction was observed by the MRI-T2 sequence 1 day after 2VO surgery (Fig. 2).
Fig. 2
Procedures used for modeling 2VO + EMS rats. (A, B) Procedures used for CCA ligation. The white arrows indicate the CCA. (C) Representative images showing a rat brain after opening the skull and dura. (D) Rats were subjected to IV lentivirus injection to regulate the expression level of MT2A. (E) Brain samples showing the covering of the TM in the ischemic brain (black arrow). (F) Representative graph of CBF changes before and after 2VO via LDF. 2VO: 2-vessel occlusion; EMS: encephalo-myo-synangiosis; CCA: common carotid artery; MT2A: metallothionein 2 A; TM: temporal muscle; CBF: cerebral blood flow; IV: intraventricular
Procedures for EMS surgery in ratsTwo days after 2VO, EMS was performed on the left cerebral hemispheres of the 2VO rats. Each rat was anesthetized by inhaling isoflurane, and the skin and temporal muscle (TM) were moved from the skull into a U shape. An electric drill was used to remove a skull section approximately 4 to 5 mm in diameter from the temporoparietal region. The DM was carefully cut with microscopic tweezers and scissors to prevent damage to the surface of the brain. Under the microscope, the arachnoid was opened in multiple places with a 1-mL syringe needle. The TM was stitched together with the DM, ensuring that the TM was in close contact with the ischemic brain surface, and then, the skin was stitched.
Intraventricular (IV) lentivirus injectionThe lentiviruses expressing MT2A (LV-MT2A) and its shRNA (shRNA-MT2A) and the corresponding NC were designed and packaged by Applied Biological Materials (Richmond, Canada). The anesthesia procedure was the same as above. In accordance with previous methods (Hu et al., 2020), a 1 mm diameter hole was drilled in the skull (1.5 mm posterior and 1.0 mm lateral to bregma), and a 10 µl syringe was inserted for lentiviral vector infusion into the right lateral ventricle (3.5 mm below the skull) of each rat. Five microliters of LV-MT2A (1 × 10⁹ TU/ml) or 5 µl of LV-NC (1 × 10⁹ TU/ml) was injected into rat brain tissues to induce MT2A overexpression or act as an NC, respectively. Similarly, 5 µl of shRNA-MT2A (1 × 10⁹ TU/ml) and 5 µl of shRNA-NC (1 × 10⁹ TU/ml) were injected into rat brain tissues for the MT2A knockdown and NC groups, respectively. All the lentiviral vectors were injected following the instructions for the transfection process (GeneChem, Shanghai, China). All information on the lentiviruses used for the animal experiments is provided in the supplementary materials.
Harvest of the rat brainEach rat was anesthetized with isoflurane, and its abdominal and thoracic cavities were incised to expose its liver and heart. The right atrial appendage was cut open, and normal saline (NS) was continuously injected into the left ventricle until the liver turned white. Tissue scissors were used to cut the skull at the foramen magnum of the occipital bone. As we continued to peel away the skull and gradually reveal the whole brain, small tweezers were used to remove the entire brain from the base of the skull. The samples used for immunofluorescence were fixed with 4% PFA (Beyotime, China) and 2.5% glutaraldehyde (Servicebio, China). For WB, the brain-tissue samples were immediately homogenized in RIPA buffer (Beyotime, Shanghai, China) when the samples were still fresh. Protein extraction, SDS‒PAGE and WB were conducted as described below. For TEM, the cerebral cortex tissues were immediately fixed by immersion in 2% glutaraldehyde solution buffered with 0.2 M cacodylate buffer and postfixed in osmium tetroxide before being embedded in epoxy resin. Ultrathin sections (under 1 mm) were prepared with a Leica ultramicrotome (Leica Microsystems, Buffalo Grove, IL, USA) and stained with uranyl acetate and lead citrate.
Magnetic resonance imaging (MRI)We compared the improvement in CBP in the different groups via MRI arterial spin labeling (MRI-ASL) sequence measurements. After being anesthetized by isoflurane inhalation, the brains and CBP of the rats were assessed via a 7.0-T MRI animal scanner (PharmaScan MRI with ParaVision 7 system, Bruker, Germany). The MRI parameters were set as follows: echo spacing = 1 ms, echo time (TE) = 48 ms, repetition time (TR) = 3,500 ms, TR/TE = 2,500/33 ms, matrix size = 256 × 256, field of view (FOV) = 35 × 35 mm2, scan time = 2 min 30 s, and section thickness = 0.8 mm without a gap. ASL parameters were set as follows: TR = 12,000 ms, TE = 4.95 ms, inversion times (TI) = 30, 100, 200, 300, 400, 500, 800, 1200, 3000, and 5000 ms, image size = 96 × 96, FOV = 40 × 40 mm2, slice thickness = 1.2 mm, and scan time = 10 min. The regions of interest (ROIs) were set within the brain cortex in close contact with the TM tissue after EMS, with an area of 10 mm2 per ROI. The CBP value (ml/100 g·min) of each ROI was assessed and calculated via ParaVision software, and the ratio of the CBP on the EMS side to that on the contralateral side was also calculated and set as the “perfusion ratio”, which was used to represent the improvement in CBP on the EMS side.
Morris water maze (MWM)The rats were subjected to behavioral testing for spatial memory in the MWM to analyze 2VO-induced cognitive impairment and cognitive improvement after EMS and lentiviral transduction. The maze consisted of a black circular pool 200 cm in diameter filled with water (temperature approximately 23 °C, 40 cm in depth) situated in a room with four noteworthy visual cues on the walls. The pool was conceptually divided into four quadrants and had four equidistant quadrants. A black platform 10 cm in diameter was submerged in the water (2 cm below the water surface) and placed on the center of the third quadrant. Edible melanin was added to the water so that the platform was invisible to the test rat. The first five days were the learning period, and a rat was released from the four quadrants facing the wall in random order. Each rat needed to find the underwater platform within 60 s, and the escape latency and swimming route were recorded. If a rat did not find the platform, it was guided to the platform, and its escape latency was recorded as 60 s. Each rat was allowed to stay on the escape platform for 10 s regardless of whether the platform was found. The sixth day was the test period, the platform was removed, the rats were placed in the opposite quadrant from the target quadrant, and the escape latency, time spent in the target quadrant, number of platform crossings, and swimming route were recorded. The escape latency, time spent in the target quadrant and number of platform crossings were measured and analyzed on a video surveillance system (SMART, Panlab SL, Barcelona, Spain).
Inductively coupled plasma mass spectrometry (ICP-MS)For the detection of copper, ICP-MS was conducted via Keystone analysis. The brain tissue sample was weighed into a plastic tube, and then, a certain amount of nitric acid (4.5 times the sample weight (g)) was added to the tube and incubated at 65 °C for two hours. After digestion, the sample was diluted with pure water (the same amount as nitric acid). For the cell pellet sample, the sample was digested with 0.1 mL of nitric acid at 65 °C for an hour and then diluted with 0.1 mL of water. All treated samples (brain tissue and cell pellets) were spiked with 50 µL of indium (100 ng/mL) as an internal standard and mixed well by vortexing for pumping into the ICP-MS instrument. Multielement standard solutions containing Cu and a working internal solution of indium were prepared from individual element standard stock solutions obtained from LGC (Manchester, NH). An Agilent 7800 inductively coupled plasma mass spectrometer (Santa Clara CA) was used to measure the elements. Each experiment was repeated at least three times.2.21. WB analysis.
HUVECs or the brain tissues of the rats were homogenized and lysed in ice-cold radioimmunoprecipitation lysis buffer (Beyotime, China) for 30 min and then homogenized with an ultrasonic cell crusher for 2 min. The homogenate was subsequently centrifuged at 13,000×g at 4 °C for 30 min. The supernatants were collected in steps as follows. Total proteins were extracted and separated by 10% SDS‒PAGE and transferred to nitrocellulose membranes (Bio‒Rad). The membranes were probed with primary antibodies against DLAT (Abcam Ab172617, USA), MT2A (Abcam Ab192385, USA), SDHB (Abcam Ab175225, USA), HSP70 (Abcam Ab2787, USA) and CD31 (Abcam Ab9498, USA) overnight. Then, the sections were further probed with appropriate horseradish peroxidase-conjugated secondary antibodies. The blots were visualized with SuperSignal West Femto Maximum Sensitivity Substrate (Thermo Fisher Scientific, USA) and quantified with Quantity 5.2 software (Bio-Rad, USA). Each experiment was repeated at least three times.
Immunofluorescence stainingHUVECs or paraffin sections from the brains of the rats were permeabilized with 0.3% Triton X-100 (Beyotime, China) in phosphate buffer solution (PBS, Beyotime, China) for 5 min and blocked with 10% goat serum (Beyotime, China) in PBS for 1 h. Coverslips were incubated overnight with primary antibodies at 4 °C and then incubated with secondary antibodies in blocking solution for 1 h at room temperature. The primary antibodies used targeted CD31 (Thermo Fisher Scientific, USA), DLAT (Thermo Fisher Scientific, USA) and VDAC1 (Thermo Fisher Scientific, USA). Next, the slices were incubated with secondary antibodies with Alexa Fluor 488 (Thermo Fisher Scientific, USA) and Alexa Fluor 555 (Thermo Fisher Scientific, USA) at room temperature for 1 h. The nuclei of HUVECs and paraffin-embedded sections were stained with DAPI (Thermo Fisher Scientific, USA). For the determination of mitochondrial function, the cells were incubated with 100 nM MitoTracker Red CMXRos (Thermo Fisher Scientific, USA) for 30 min prior to fixation. Each experiment was repeated at least three times.
Data analysisThe analyses were performed via the Statistical Program for Social Science (SPSS) version 23.0. The data are reported as the means ± standard deviations (SDs). The MWM results were analyzed by repeated-measures one-way analysis of variance (ANOVA). The immunofluorescence staining, qPCR, WB, MWM test and MRI-ASL results were evaluated via two-tailed unpaired Student’s t test. Differences were considered significant if P < 0.05.
留言 (0)