Animals and experimental design
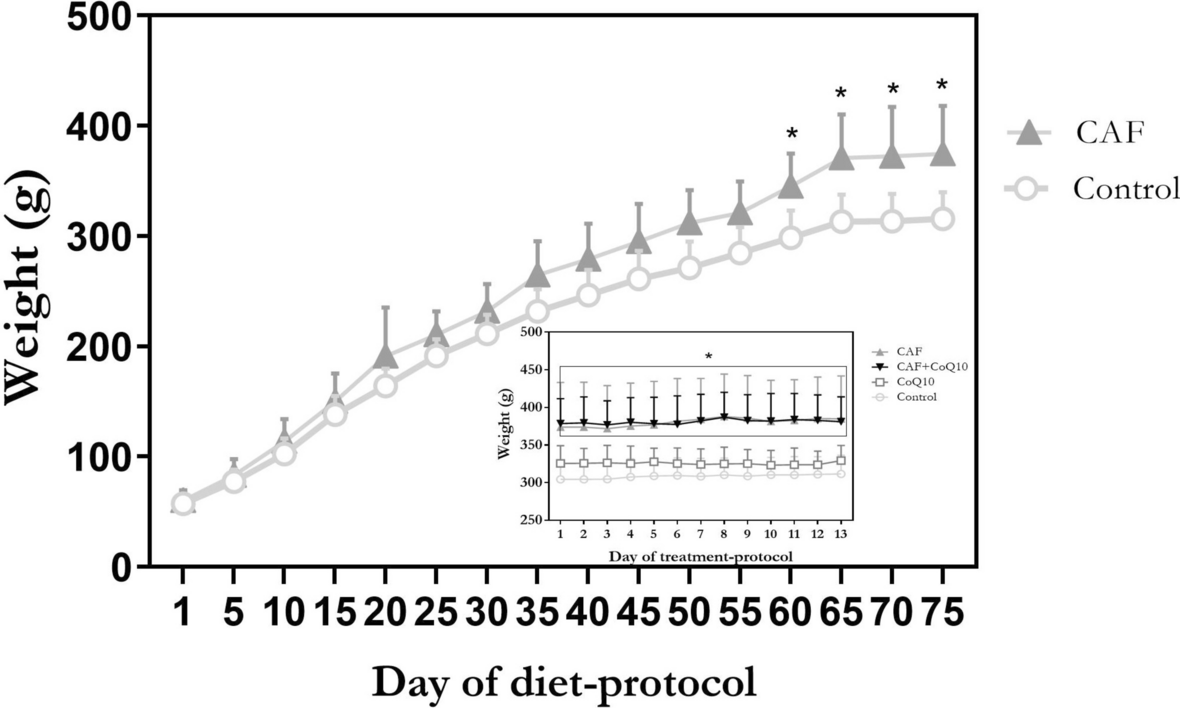
Twenty-two days old female Wistar rats (Rattus norvergicus) were, first, included in a diet-protocol, and then, in a treatment-protocol. Diet-protocol: twenty the animals were fed with standard rodent chow diet (Control group) and 20 were also offered with CAF, that consists in a varying menu of highly palatable human foods comprising sausages, cheese, snacks, peanuts, biscuits, and chocolate biscuits (Obese group). The nutritional composition of each food is described in Supplementary Fig. 1. This animal model of obesity was adapted from previous studies [31,32,33,34] and has been previously implemented by us successfully [14, 15, 35, 36]. The diet-protocol was continued until each animal in that group showed significantly higher body weight than the average of the control group (here, on day 75th of the diet protocol). Afterwards, treatment-protocol was started. During this period rats continued receiving the same diet-protocol. For that purpose, 10 rats of each group were randomly selected and then daily administered, orally, with 5 mg/kg CoQ10 for 13 days [37], while the others received vehicle. Commercial tablets containing 30 mg of CoQ10, as ubiquinol, and 10 mg of Vitamin E (Nutrifarma, Buenos Aires, Argentina) were used. Each tablet was dissolved in 3 ml of 1% Tween 80 then suspended in water to reach the necessary concentration [38, 39]. The treatment duration aligned with previous literature [39], encompassing approximately 3 estrous cycles, meeting the minimum recommended duration for clinical practice. At the conclusion of this 88-day experimental design, four groups were established (n = 10/group): Control, CoQ10, CAF and CAF + CoQ10.
All rats had ad libitum access to all diet components as well as to water and were kept on a 12:12 h light–dark cycle at 22 °C. Weight gain was monitored twice a week.
Estrous cycle staging
During the treatment-protocol, vaginal smears were collected daily by lavage with 0.9% saline solution between 09.00 and 11.00 AM from each animal. The fluid was spotted thinly on a microscope slide, and the dried slides were stained with 0.1% trypan blue in deionized water. The estrous cycle stage was determined by microscopic examination, as described by Westwood [40].
Glucose tolerance test
The glucose tolerance test (GTT) was conducted on day 88 of the experimental protocol. For that purpose, 6 h fasted control and obese rats were intraperitoneally injected with a bolus of glucose (2 g/kg) and blood glucose levels were determined at 0, 15, 30, 60, and 120 min after glucose challenge. Glycemia was measured in tail blood using glucose strips on an Accu-Chek Performa II instrument (Roche, Buenos Aires, Argentina). Data was collected for each individual animal and expressed as mean blood glucose concentration over time. The area under the curve (AUC) for glucose was calculated to evaluate glucose tolerance in control and obese animals [15].
Insulin tolerance test
The insulin tolerance test (ITT) was conducted on day 89 of the experimental protocol in rats fasted for 2 h, following the diet and treatment protocols. For that, a single intraperitoneal insulin injection (0.5 U/kg diluted in PBS) was administered, and blood glucose was sampled at times 0, 15, 30, 45, 60, 90, 120 and 150 min after insulin injection. Glycemia was measured in tail blood using glucose strips on an Accu-Chek Performa II instrument (Roche, Buenos Aires, Argentina) [15, 41].
Anesthesia and tissue collection
Euthanasia was performed by cardiac exsanguination in rats during the first estrous phase after treatment-protocol. For that purpose, animals were previously subjected to anesthesia with 50 mg/kg solution of ketamine (Brouwer, Argentina) associated with 10 mg/kg xylazine (Alfasan, Holland) that was injected intramuscularly into the inner side of one of the hind legs. Blood and ovaries were collected. Ovaries were weighed and fixed in 4% (w/v) formaldehyde for 24 h. Afterwards, they were dehydrated, embedded in paraffin, cut into seven-micron sections, and mounted on gelatin-coated glass slides for histology and immunohistochemical studies. Blood was immediately used for evaluating glucose levels and then, centrifuged at 2000 g to obtain serum that were frozen at −70 °C and thawed on the day of the metabolic/hormonal characterization.
Metabolic characterization
These determinations were performed according to the manufacturer’s instructions. Briefly, fasting blood glucose was determined by using the glucose oxidase–peroxidase enzymatic colorimetric assay (GOD/PAP; GT Laboratories, Rosario, Argentina). Serum triglycerides were determined by using the glycerol-3-phosphate oxidase enzymatic colorimetric assay (GPO-PAP; GT Laboratories); and total and HDL cholesterol were measured, in sera, by using Colestat Kit (GT Laboratories). Animals were fasted for 8 h prior to sample collection.
Hormonal characterization
Serum estradiol, estrone and progesterone (P4) concentrations were determined. For estradiol (E2), an enzyme immunoassay was used (EIA 2693, DRG Instruments GMBH, Germany). The lower limits of detection for E2 and estrone were 9.714 pg/ml and 10.00 pg/mL, respectively. Cross-reactivity of the E2 antibodies is 0.2% for estrone and 0.05% for estriol.
Estrone and P4 concentrations were determined by radioinmunoassays (RIA) using a gamma counter (Multi Crystal LB 2111, Berthold Technologies, GmbH & Co., Bad Wildbad Germany). For estrone a coated-tubes commercial RIA kit was used (DSL 8700, IMMUNOTECH s.r.o., Praga, Czech Republic). All measurements were completed in a single assay. The detection limit was 18.45 pg/ml. Mean intra-assay CV was 4.27%.
Progesterone concentrations were determined using a coated-tubes commercial RIA kit (RIA progesterone, Ref IM1188, Immunotech s.r.o. Hostivar, Czech Republic). All measurements were also completed in a single assay. The detection limit was 0.059 ng/ml. Mean intra-assay CV was 1.85%.
Ovarian histology and follicle counting
Tissue sections were stained with Masson trichrome stain, which was used to show the smooth muscle according to standard protocols, and then analyzed using an Olympus light microscope. Seven-micrometer step sections were mounted at 50-mm intervals onto microscope slides to prevent counting the same structure twice, according to the method described by Woodruff et al. [42]. To prevent multiple counts of the same follicle, only follicles with a visible oocyte nucleus were included [43]. Follicles were classified as either primary, secondary, antral or preovulatory. In addition, the number of corpora lutea (CL) was counted in each section analyzed. The abundance of each type of follicle or corpora lutea was normalized by the total ovarian area in the section, as reported previously [44]. The ovary area was measured with Image J (version 1.42q) and expressed per 10 mm2.
Immunohistochemistry
The expression of anti-Müllerian hormone (AMH) was detected by immunohistochemistry as previously [15]. Briefly, ovarian sections were subjected to an antigen retrieval technique by heat. Tissue slides were placed in a solution containing 0.01 M citrate buffer, pH 6.2 for 5 min in a microwave oven at 100 °C at 600 W. Endogenous peroxidase activity was blocked by incubation in 3% (v/v) hydrogen peroxide at room temperature for 15 min. Background blocking was achieved by incubating with 5% (w/v) non-fat milk at room temperature for 30 min. The tissue sections were then incubated at 4 °C overnight with 1:50 mouse monoclonal anti-AMH (AbD Serotec, Oxford, UK) as primary antibody. The sections were incubated with 1:500 biotinylated goat anti-mouse antibody (Dako Cytomation, Carpinteria, CA, USA) at room temperature for 40 min. Then, 40-min incubation with 1:400 streptavidin–biotin horseradish peroxidase complex reagent (Dako) was done. Color development was performed with a solution containing 3,3′-diaminobenzidine (Dako), and then the sections were counterstained with hematoxylin. Finally, the sections were dehydrated, mounted with Entellan New (Merck, Darmstadt, Germany) and observed with an FV-300 Olympus light microscope. Control sections were performed by omitting the primary antibody.
Follicles were, first, classified according to the stage of development and then according to immunoreactivity for AMH (as positive or negative). The abundance of immunoreactive follicles was normalized by the total number of the same structure detected in the ovarian section.
Ovarian RNA extraction and retrotranscription
Total ovarian RNA was extracted from the ovary using Trizol reagent (Invitrogen, CA, USA) according to the manufacturer’s protocol. cDNA was synthesized by incubating 2 μg of extracted RNA in a buffer containing 3U AMV Reverse transcriptase (Promega, Madison, WI, USA), 1uM oligo d(T)15 Primer (Dongsheng Biotech, Guangdong, China) and 1 mM Mix dNTPS (Dongsheng Biotech). The reaction mixture was incubated for 60 min at 42 °C followed by 15 min at 70 °C.
Polymerase chain reaction
The obtained cDNA (2 μl, selected to work within the linear range) was amplified by Polymerase Chain Reaction (PCR) in a buffer containing: 0.5 U Taq-DNA polymerase (Invitrogen), 0.2 mM of each primer (Invitrogen), 0.2 mM of each dNTP, 1.5 mM MgCl2 and each specific primer.
For amplification of Steroidogenic acute regulatory protein (StAR) cDNA, the primers were: sense 5′-GCCTGAGCAAAGCGGTGTC-3′, antisense 5′-CTGGCGAACTCTATCTGGGTCTGT-3′; for aromatase were: sense 5′-GAACGGTCCGCCCTTTCT-3′, antisense 5′-TGGATTCCACACAGACTTCT-3′, and for hydroxysteroid (17-beta) dehydrogenase 1 (Hsd17b1) were: sense 5′-TTCTGCAAGGCTTTACCAGG-3′, antisense 5′-ACAAACTCATCGGCGGTCTT-3′. The specific annealing temperature and the number of cycles used were primer dependent. The optimum cycle number was determined for each primer pair, so that signals were always in the exponential portion of the amplification curve. Each cycle consisted of denaturation at 95 °C for 15 s, primer annealing at the specific temperature for 30 s and extension at 72 °C for 15 s. Negative controls were performed without reverse transcriptase or RNA. PCR products were electrophoresed on 2% agarose (Biodynamics, Buenos Aires, Argentina) gels. Gel images were taken with the ImageQuant RT ECL (General Electric) software and quantified using Image J software (version 1.42q, National Institute of Health, USA). Density of the bands of interest was normalized to that of GADPH in each sample.
Statistical analysis
Statistical analyzes were performed with the GraphPad Prism 5.0 program (GraphPAD software, San Diego, CA, USA) considering a value of p < 0.05 to be significant. Homogeneity of variances was verified with the Levenne test and normal distribution of the data was evaluated using the Shapiro-Willks test using the R-studio program (version 3.5.1). Results were expressed as the mean ± SD except where otherwise specified.
Body weights, glucose tolerance and insulin resistance curves were analyzed using repeated measures analysis of variance (ANOVA) followed by the Bonferroni test. Metabolic parameters and follicular counting were analyzed using a two-way ANOVA (Diets and Treatment) followed by the Bonferroni test.
The evaluation of the estrous cycle was carried out by comparing the percentage of days spent in each stage with respect to the total time evaluated by Chi2 analysis.


留言 (0)