Data source
We used data from the 2018 Nigeria demographic and health survey (NDHS) individual woman questionnaire. In total, 21,792 women who are of reproductive age (15–49 years) made up the study's sample. The National Population Commission (NPC) has conducted this type of survey six times, with the most recent being the 2018 NDHS [16]. From August 14 to December 29, 2018, data were collected [16]. The sample was chosen using a stratified, multi-stage cluster design, with enumeration areas (EAs) serving as the sampling units for the first stage. A total of approximately 30 households were chosen from the complete list of households in each of the 1389 selected EAs, resulting in a 99% response rate.
Sampling technique
In the three-stage sampling stratification process used for the NDHS 2018, respondents were first divided into urban and rural housing strata, and then EAs were randomly chosen within each stratum. Following that, equal probability sampling was used to choose households within each EA for the survey. In order to ensure that the sample was representative of the general population, the three-stage sampling method was used when calculating survey weights. The Federal Republic of Nigeria's 2006 Population and Housing Census (NPHC), which was carried out by the National Population Commission, served as the sampling frame for the 2018 NDHS. A stratified sample was chosen in two phases for the 2018 NDHS. The 36 states and the Federal Capital Territory were divided into urban and rural regions in order to stratify the country. There were 74 different sampling strata identified in total. The individual female data used for analysis in this study served as the source of the data. Information regarding the DHS sampling process has previously been reported [17].
Measurements of outcome variable
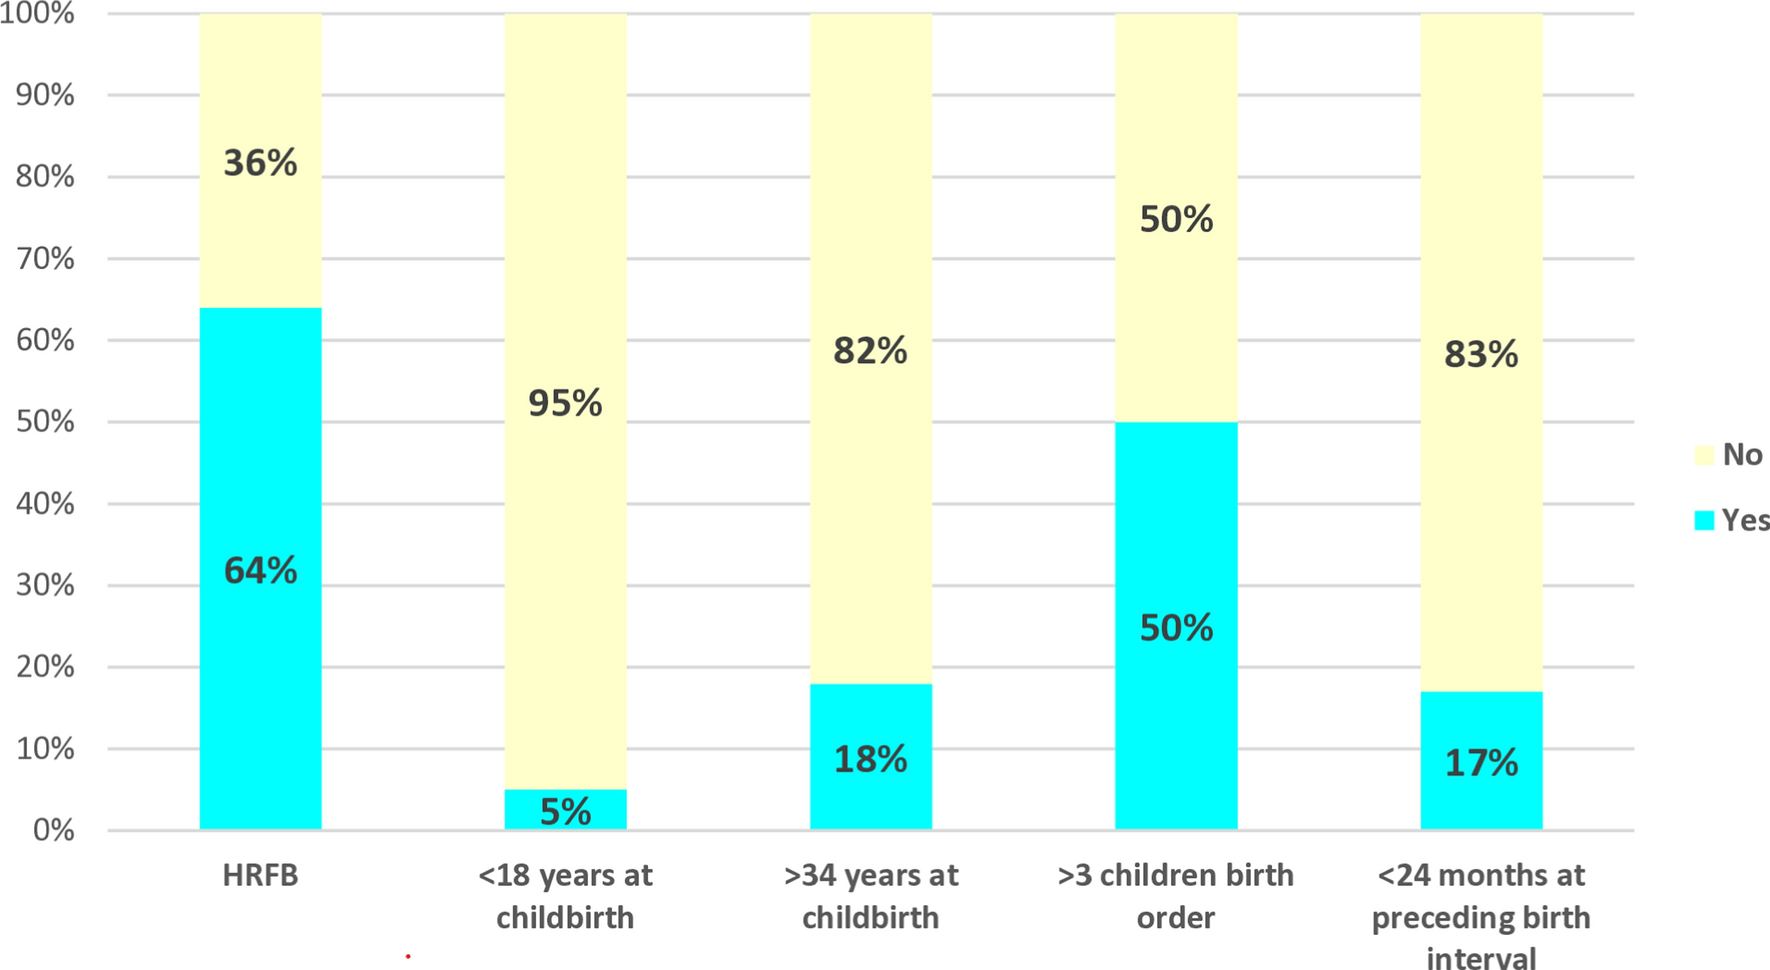
The outcome variable, HRFB, was calculated using four criteria: (a) women who were younger than 18 years old at the time of delivery; (b) women who were older than 34 years old at the time of delivery; (c) women who had more than three children; and (d) women who had a child born within a short time frame (less than 24 months). A woman was classified as having had HRFB if she had at least one of the indicators, which were categorised as 1 or "yes," and 0 or "no" otherwise [18,19,20].
Explanatory variables
Previous studies provided the basis for the factors this study examined [21,22,23]. Education: none or primary, secondary or higher; religion: Christianity, Islam, traditional or others; number of living children: 0, 1–2, 3–4, 5 + ; years spent in residence: < 5 years, 5 + years; age (years): 15–24, 25–34, 35–49; marital status: not married, married; covered by health insurance: no, yes; exposed to media: no, yes; employment status: no, yes; socioeconomic disadvantaged status: low, medium, high; husband or partner’s education level: none, primary, secondary, higher, don’t know; household wealth: poor, non-poor; sex of household head: male, female; region: North-Central, North-East, North-West, South-East, South-South, South-West; residential status: urban, rural; community-level poverty: community level poverty was defined as the proportion of women who were below the middle class in wealth status and categorized into low, medium, high; community-level education: community level women’s education was defined as proportion of women from community with at least primary education and categorized into low, medium, high; community-level ethnicity: ethnic diversity refers to the concentration of different ethnic groups in a community. It was defined as the proportion of women from different ethnic groups in the primary sampling unit. The value ranges from 0 to 100. A value of 0 (low) reflects a mono-ethnic community, whereas a value of 100 (high) reflects that the community is multi-ethnic in nature and this variable was categorized into mono-ethnic, multi-ethnic. The community-level poverty, education and ethnicity were constructed using principal component analysis technique respectively.
Analytical approach
Stata software version 17.0 (Stata Corporation, College Station, Texas, USA) was used for data analysis. Since the study included the multi-stage stratified cluster sample design, we employed the survey module's ('svy') function to account for sampling design (weighting, clustering, and stratification). Percentage was employed in the univariable analysis. A bivariate analysis chi-square test between each independent variable and the outcome variable (HRFB) was used to determine the significant variables to be included in the multivariable models. The fixed and random effects of the parameters connected to HRFB were investigated using the multilevel multivariable binary logistic regression. In order to assess multicollinearity, which is known to raise serious issues with the logit model, the variance inflation factor was employed [24].
We designed a three-level model for binary response reporting HRFB, at level 1 for individual women and level 2 for households from Enumeration Areas. We built five models. First, the amount of variance between the community and household levels was broken down into several components using an empty or unconditional model that lacked any explanatory factors. We utilised the null or empty model as the benchmark to calculate the extent to which household and community characteristics may account for the observed changes because it is crucial for comprehending the variations in the community and households. Furthermore, we utilised it to support the application of the multilevel statistical framework, as it recommended using single-level logistic regression in cases when the community variance in the empty model was not significant. The second model alone included elements at the individual level, the third model exclusively included factors at the household level, and the fourth model exclusively included factors at the community level. Ultimately, the fifth model (full model) simultaneously adjusted for variables at the individual, household, and community levels. The level of significance was determined at p < 0.05. To choose the best model from the five models, the Bayesian and Akaike Information Criteria were applied. A lower Akaike or Bayesian Information Criterion score denotes a better model fit [25].
Fixed and random effects
Adjusted odds ratios (aORs) along with their 95% confidence interval (CI) were used to report the outcomes of fixed effects (measures of association). The Intra-class Correlation (ICC) and Median Odds Ratio (MOR) were used to quantify the likely contextual effects [26]. With the use of ICC, we assessed the similarity between respondents living in the same household and community. The ICC is a measure of the clustering of odds of HRFB in the same household and community. It shows the percentage of the total variance in the likelihood of HRFB that is connected to the household and community level. The MOR estimates the probability of HRFB that may be assigned to the household and community by measuring the second or third level (household or community) variance as odds ratios. When the MOR is one, there is no variance in households or communities. Conversely, the higher the MOR, the more important are the contextual effects for understanding the probability of HRFB. The linear threshold was utilised to compute ICC using the Snijders and Bosker formula [27], MOR, on the other hand, measures the heterogeneity of unexplained clusters.
Ethical consideration
The de-identified public secondary dataset was used for this study. The respondents' informed consent was collected by NDHS in accordance with established ethical protocol. The authors were granted permission to use the data, which was collected by NDHS in accordance with ethical standards, therefore no further participants' agreement or consent was required. The details of DHS ethical guidelines can be found here: http://goo.gl/ny8T6X.


留言 (0)