
記住我
Cardiovascular disease (CVD) is recognized as a significant public health concern due to its high prevalence, morbidity, and mortality rates globally (1, 2). The global burden of CVD is expected to increase, primarily driven by an aging population (3). A study examining the global burden of disease from 1990 to 2019 noted a rise in CVD cases from 271 million to 523 million, along with a marked increase in mortality rates (4). Cardiometabolic factors make one of the major contributors to the risk of CVD. Hypertension, hyperlipidemia, diabetes and obesity are modifiable metabolic risk factors for CVD (5, 6). Hence, it is important to identify and screen people at risk for CVD at an early stage, especially those with metabolic risk factors, and to implement timely interventions.
Cardiometabolic syndrome (CMS) serves as a significant risk factor for CVD. It contributes to heightened cardiovascular and all-cause mortality rates (7). CMS is defined by abdominal obesity, hypertension, increased triglycerides, reduced levels of high-density lipoprotein cholesterol (HDL-C), and glucose intolerance (8, 9). Typically, the diagnosis of CMS demands the existence of at least three of these risk factors. As the population ages, the global metabolic risk is rising, leading to an increased prevalence of CMS between 1999 and 2018 (10), the prevalence of CMS among American adults rose from 28.23% to 37.09%, suggesting a deterioration in cardiometabolic health status (11). Alarmingly, merely 6.8% of adults preserve optimal cardiometabolic well-being (12). It is widely recognized that excessive obesity, particularly centripetal obesity, independently intensifies a multitude of metabolic risk factors for CVD, including the induction of dyslipidemia, increased blood pressure, hyperglycemia, insulin resistance (IR), and systemic inflammation (5, 13). Obesity may also lead to an increased risk of cardio-metabolic disease in children and adolescents (14).
Obesity is identified as a primary contributor to the burden of CMS (11, 15, 16). Moreover, the incidence of CVD is significantly higher in obese people, and the excessive accumulation of body fat leads to the development of CVD by inducing an inflammatory response and increasing oxidative stress (17). Obesity is increasingly being used to identify people at risk for cardiovascular risk factors, and notably abdominal obesity is a strong risk factor for CVD. Thomas proposed a novel body roundness index (BRI) that estimates the rate of visceral fat to total body fat by combining waist circumference (WC) and height data (18). Traditional research methods frequently depend on indicators like body mass index (BMI) and WC for the identification and management of obesity (19, 20). However, they all have certain limitations. Compared with BMI and WC, BRI seems to reflect abdominal obesity more accurately and effectively predict obesity-related metabolic chronic diseases (21). The study by Lucas et al. confirmed that metabolically unhealthy/obese individuals present a higher risk of developing CVD compared to metabolically healthy/obese individuals (22). BRI can significantly identify the presence of CMS (23). At the same time, BRI is a valid predictor of the risk of CVD (24). A cohort study in China found that individuals with intermediate and high BRI levels had a 22% and 55% higher risk of experiencing cardiovascular events, respectively, compared to those with low BRI (25). However, the relationship between BRI and the risk of CVD in patients with CMS in the United States (U.S.) remains underexplored. The above suggests that it would be positive to further explore the relationship between BRI and the occurrence of CVD among CMS patients.
Therefore, this study intends to investigate the association of BRI with the risk of CVD and its components including congestive heart failure (CHF), coronary heart disease (CHD), angina, heart attack, and stroke in patients with CMS in the U.S. In addition, we assessed the ability of the BRI to identify CVD and its components in the U.S. population. We hypothesized that the BRI would identify CVD better than BMI or WC.
Materials and methodsStudy designThis cross-sectional investigation employed data from the NHANES implemented in the U.S. NHANES is a research initiative of the Centers for Disease Control and Prevention (CDC). It is designed to evaluate the health and nutritional status of the American population by means of comprehensive interviews and physical examinations. This survey protocol was approved by the Review Board of the National Center for Health Statistics (NCHS). All participants provided written informed consent. A detailed synopsis of the NHANES study and associated data can be found at https://www.cdc.gov/nchs/nhanes/.
Study populationThe study encompassed subjects from the NHANES database covering the period from 2009 to 2018. These surveys offered extensive data on the BRI and multiple CVD, such as CHF, CHD, heart attack, angina, and stroke. Initially, 49,693 participants were included. After specific inclusion criteria were applied to filter the data, resulting in the exclusion of participants who met any of the following criteria: (1) age < 20 years; (2) missing data on height and WC data; (3) not diagnosed with CMS; (4) missing questionnaire data related to CVD; (5) missing data of covariates. Ultimately, a total of 6,640 subjects were included in the analysis (Figure 1).
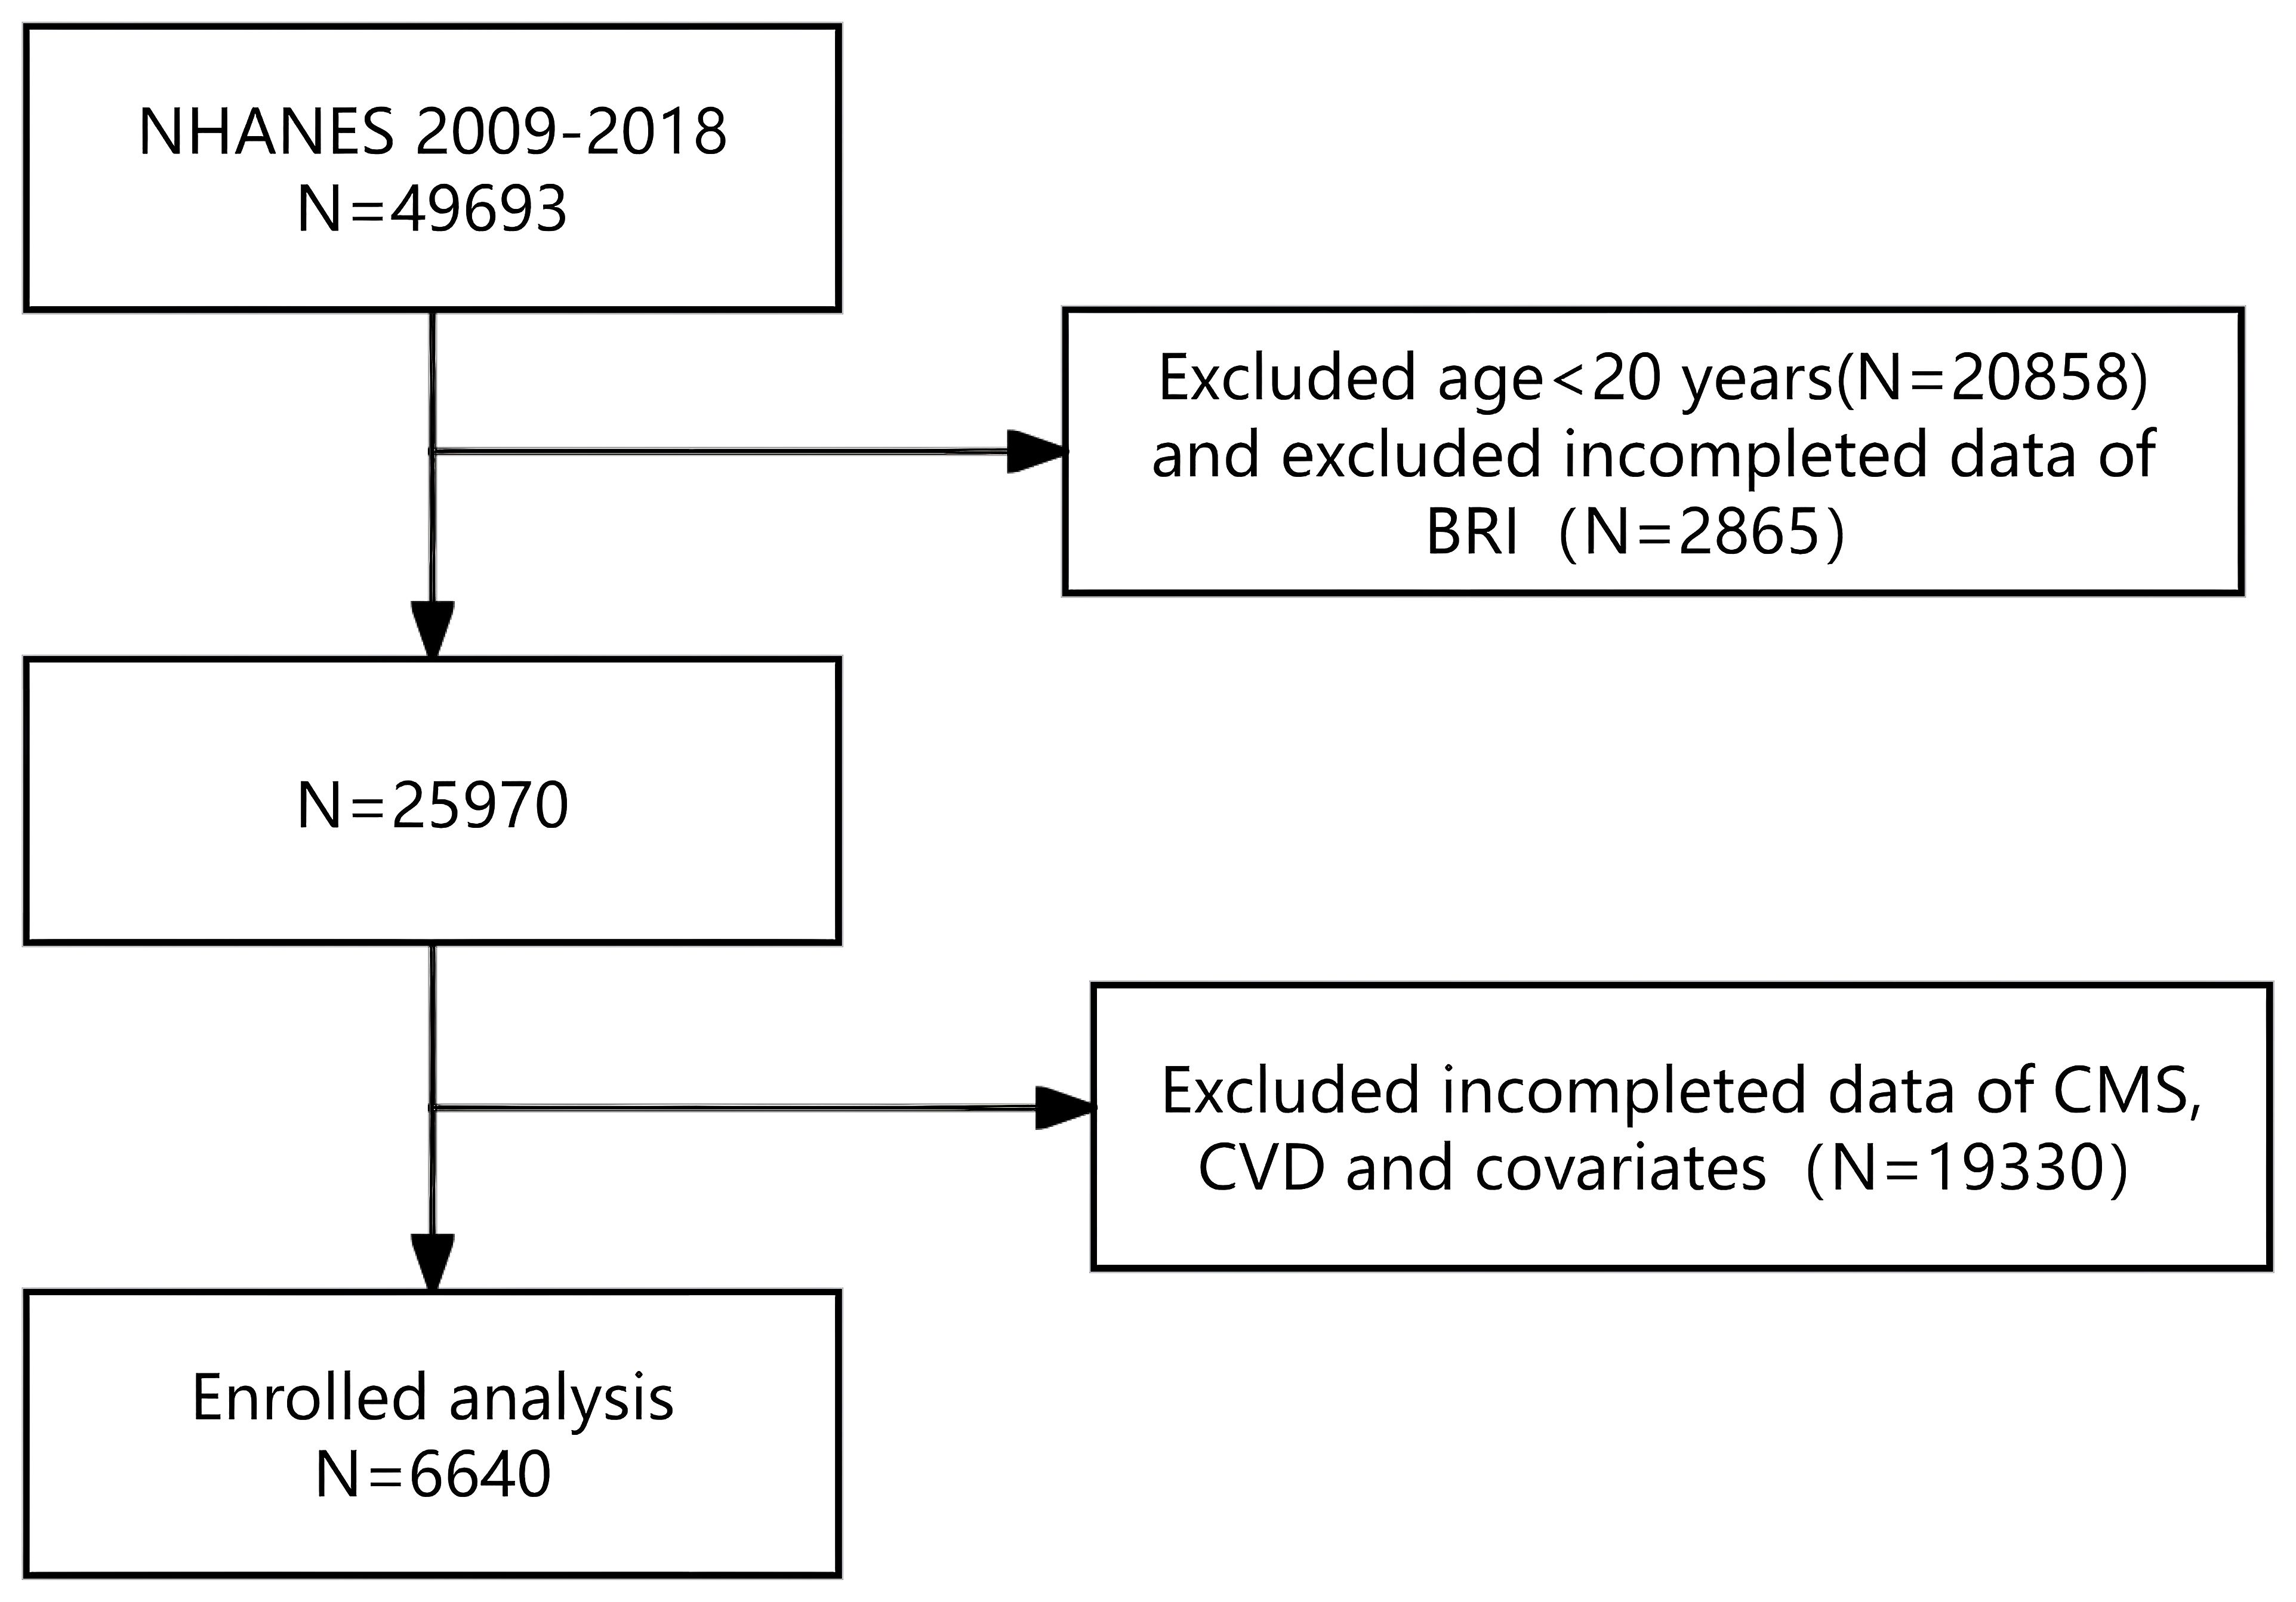
Figure 1. Screening flow of respondents.
Measurement of the body roundness indexThe BRI was utilized as an exposure factor and calculated using the following equation (18): BRI = 364.2 - 365.5 × (1- [WC (m)/2π]2/[0.5 × height (m)]2)½. Waist circumference and height can be found in the body measurements of the examination data.
Measurement of cardiovascular diseaseData on cardiovascular conditions were obtained from the medical conditions section identified by the variable name prefix MCQ. This variable includes both self-reported and proxy-reported information that is collected through personal interviews regarding various health issues and histories for both children and adults. This section includes questions about whether a physician has diagnosed the participant with specific conditions, such as angina, congestive heart failure (CHF), coronary heart disease (CHD), heart attack, and stroke. Participants who responded ‘yes’ to these inquiries were categorized as having a history of CVD. We defined a composite endpoint for CVD. This endpoint included angina, congestive heart failure (CHF), coronary heart disease (CHD), heart attack, and stroke as primary outcomes. Meanwhile, the events related to these diseases were analyzed separately as secondary outcomes.
Measurement of cardiometabolic syndromeThe diagnostic criteria for CMS were founded on the guidelines of the National Cholesterol Education Project (NCEP) Adult Treatment Panel III (ATP III) (9). CMS is characterized by the occurrence of three or more of the following conditions: (1) WC ≥ 102 cm for men and ≥ 88 cm for women; (2) Elevated serum TG ≥ 150 mg/dL; (3) HDL-C < 40 mg/dL for men and < 50 mg/dL for women; (4) Elevated fasting blood glucose ≥ 110 mg/dL; (5) Elevated blood pressure is defined as having a systolic blood pressure (SBP) of at least 130 mmHg or a diastolic blood pressure (DBP) of at least 85 mmHg, or for individuals who are currently taking oral antihypertensive medications. WC was collected using standard procedures during the physical examination. SBP and DBP were calculated as the arithmetic mean of up to four repeated measurements for each participant. TG and HDL-C were measured in serum, while fasting glucose was measured in plasma.
CovariatesThe covariates included in the analyses were age, sex, ethnicity, educational level, smoking status, diabetes, hypertension, BMI, SBP, and DBP. Laboratory test data comprised serum creatinine (SCR), serum uric acid (SUA), total cholesterol (TC), and HDL-C. Participants’ age were categorized as < 60 years and ≥ 60 years. Ethnicity classifications included Mexican American, Other Hispanic, Non-Hispanic White, Non-Hispanic Black, and Others. Educational attainment was categorized into three groups: below high school, high school or general educational development (GED), and above high school. Smoking status was classified as never smoked, previously smoked, and currently smoking; BMI was further categorized into normal, overweight, and obese groups. Hypertension was defined as a medical diagnosis of hypertension, intake of blood pressure-lowering drugs, or a sequence of three or more readings with systolic pressure at least 130 mmHg or diastolic pressure at least 80 mmHg (26). Diabetes mellitus defined as medically diagnosed or oral hypoglycemic drugs or insulin use. Each participant in the study received 3-4 blood pressure readings, and the blood pressure recordings represent the average of the readings.
Statistical analysisParticipants were divided into quartiles (Q1 - Q4) according to their BRI values for analysis. Categorical variables were expressed as frequencies (percentages). Comparisons among groups were conducted using the chi-square test. Continuous variables were presented as mean ± standard deviation (SD). Evaluation was carried out using the t-test.
Multivariate logistic regression models were utilized to assess the connection between BRI and the primary outcome of CVD, as well as secondary outcomes including angina, CHF, CHD, heart attack, and stroke. Odds ratios (ORs) were calculated through three models. Model 1 had no adjustments made. Model 2 was adjusted for age, gender, and race. Model 3 included adjustments for age, gender, and race, education level, smoking status, diabetes, hypertension, BMI, SBP, and DBP. A generalized additive model (GAM) was employed for smooth curve fitting to examine potential non-linear associations between BRI and CVD. If the relationship was nonlinear, we estimated the threshold value and selected the infection point with the highest likelihood. Additionally, stratified logistic regression models were conducted to analyze subgroups based on age, sex, race, hypertension, diabetes, and BMI, with interaction tests employed to assess any variations in subgroup relationships. We reassessed the robustness of the results by multiple imputation for missing covariates mainly including HDL-C, TC, SCR, SUA, and BMI. Receiver operating characteristic (ROC) curves were used to assess the ability of BRI, WC and BMI in predicting CVD. Statistical analyses were carried out using R (version 4.4.1) and EmpowerStats (version 2.0). Statistical significance was defined as P < 0.05.
ResultsBaseline characteristics of study participantsThe study included 6,640 participants diagnosed with CMS, categorized according to BRI quartiles, as detailed in Table 1. The participants had a mean age of 56.72 ± 15.09 years, with females comprising 53.57% of the sample. The average BRI was 7.17± 2.27. The overall prevalence of CVD was 18.09%. This prevalence increased significantly as one moved across higher quartiles of BRI. Quartiles of higher BRI were linked with an elevated incidence of CHF, heart attack and stroke.

Table 1. Baseline characteristics of the study population.
Obvious differences were detected among quartiles of BRI in terms of age, gender, race, education level, BMI, DBP, SCR, SUA, TC, smoking status, hypertension, diabetes, CHD, angina, and heart attack (P < 0.05). Participants in the highest quartile of BRI were more likely to have hypertension, diabetes, a higher obesity rate, and elevated SUA levels compared to those in the lowest quartile of BRI. No significant difference were found regarding SBP, HDL-C, or stroke among the quartiles.
Association between BRI and the risk of CVDLogistic regression analysisLogistic regression analysis was carried out to assess the connection between BRI and both the primary outcome of CVD as well as secondary outcomes such as CHF, CHD, angina, heart attack, and stroke. The results from the three multivariate logistic regression models are presented in Table 2.
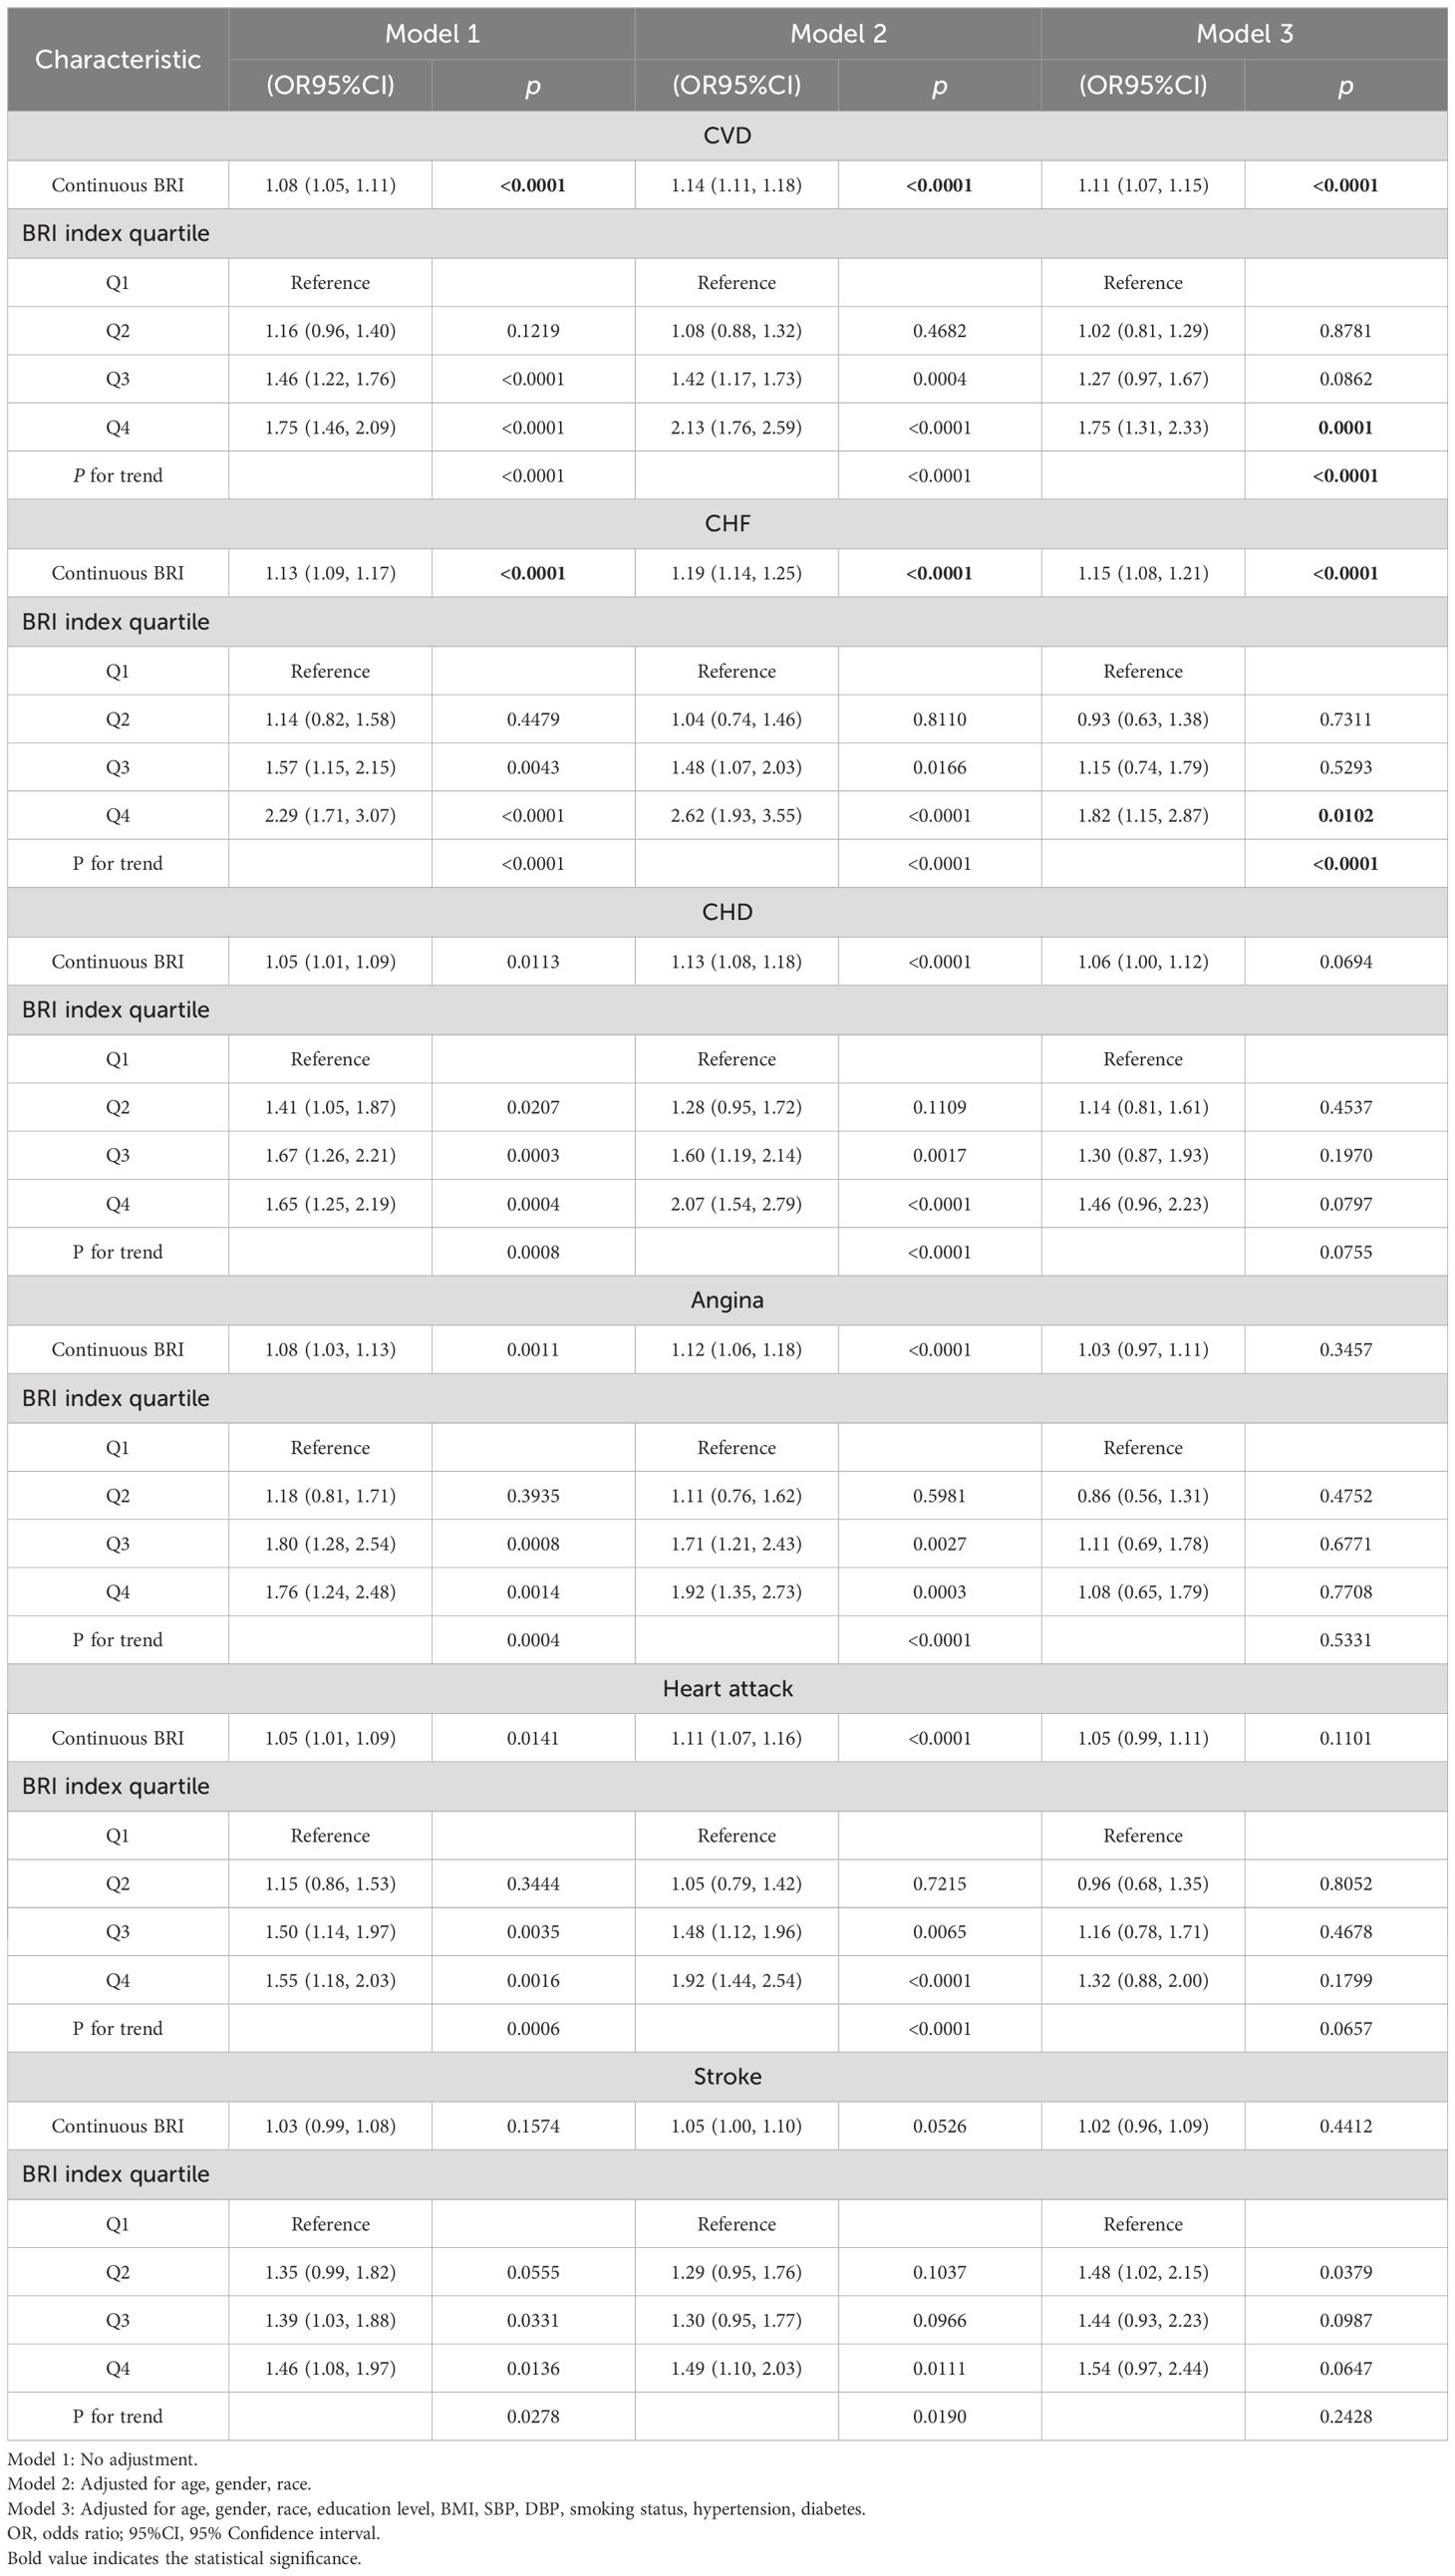
Table 2. The association between the BRI index and the risk of CVD.
A consistent positive association was observed between elevated BRI levels and the heightened likelihood of CVD. In Model 1, without any adjustments, each 1-unit increase in BRI was associated with a 8% increase in the prevalence of CVD among participants with CMS (OR = 1.08, 95% CI 1.05 - 1.11, P < 0.0001). This relationship remained significant after adjustments for age, sex, and race in Model 2 (OR = 1.14, 95% CI 1.11 - 1.18, P < 0.0001), and further adjustments in Model 3, which accounted for age, gender, race, education level, BMI, SBP, DBP, smoking status, hypertension, diabetes (OR = 1.11, 95% CI 1.07 - 1.15, P < 0.0001). In the fully adjusted model 3, participants in the highest BRI quartile showed a 75% greater risk of CVD (OR = 1.75, 95% CI 1.31 - 2.33, P = 0.0001) compared to those in the lowest quartile of BRI.
No significant correlations were found for CHD, angina, heart attack, and stroke. (Table 2). Our investigation revealed a positive association between the BRI and an increased probability of the prevalence CHF among participants with CMS. In our unadjusted model 1, each 1-unit increase in BRI was associated with a 13% increase in the risk of CHF (OR = 1.13, 95% CI 1.09 - 1.17, P < 0.0001). This relationship remained significant after adjustments for age, sex, and race in Model 2 (OR = 1.19, 95%CI 1.14 - 1.25, P < 0.0001), and further adjustments in Model 3, which accounted for age, gender, race, education level, BMI, SBP, DBP, smoking status, hypertension, diabetes (OR = 1.15, 95% CI 1.08 - 1.21, P < 0.0001). After classifying the BRI into four quartiles, a significant statistical relationship was still observed. In comparison to individuals in the lowest quartile of BRI, those in the highest BRI quartile showed a 82% greater risk of CHF (Model 3: OR = 1.82, 95% CI 1.15 - 2.87, P = 0.0102).
Multiple imputation indicated that BRI remained positively associated with the risk of CVD and CHF in CMS patients, demonstrating robust results (Supplementary Tables S1).
Smooth curve analysisWe conducted a smoothed curve-fitting analysis using GAM, which indicated that the BRI was linearly associated with the risk of CVD in CMS patients (Figure 2). However, the association between BRI and CHF were revealed to be a U-shaped association (Figure 3). And then, the threshold effects analysis showed a BRI cut-off of 4.53 units, and showed that when the BRI level was lower than 4.53, the prevalence of CHF decreased by 58% for every 1-unit decrease in BRI (OR = 0.42, 95% CI 0.22 - 0.79, P = 0.0072), but after this inflection point, the prevalence of CHF increased by 16% for every 1-unit increase in BRI (OR = 1.16, 95% CI 1.09 - 1.22, P <0.0001) (Table 3).
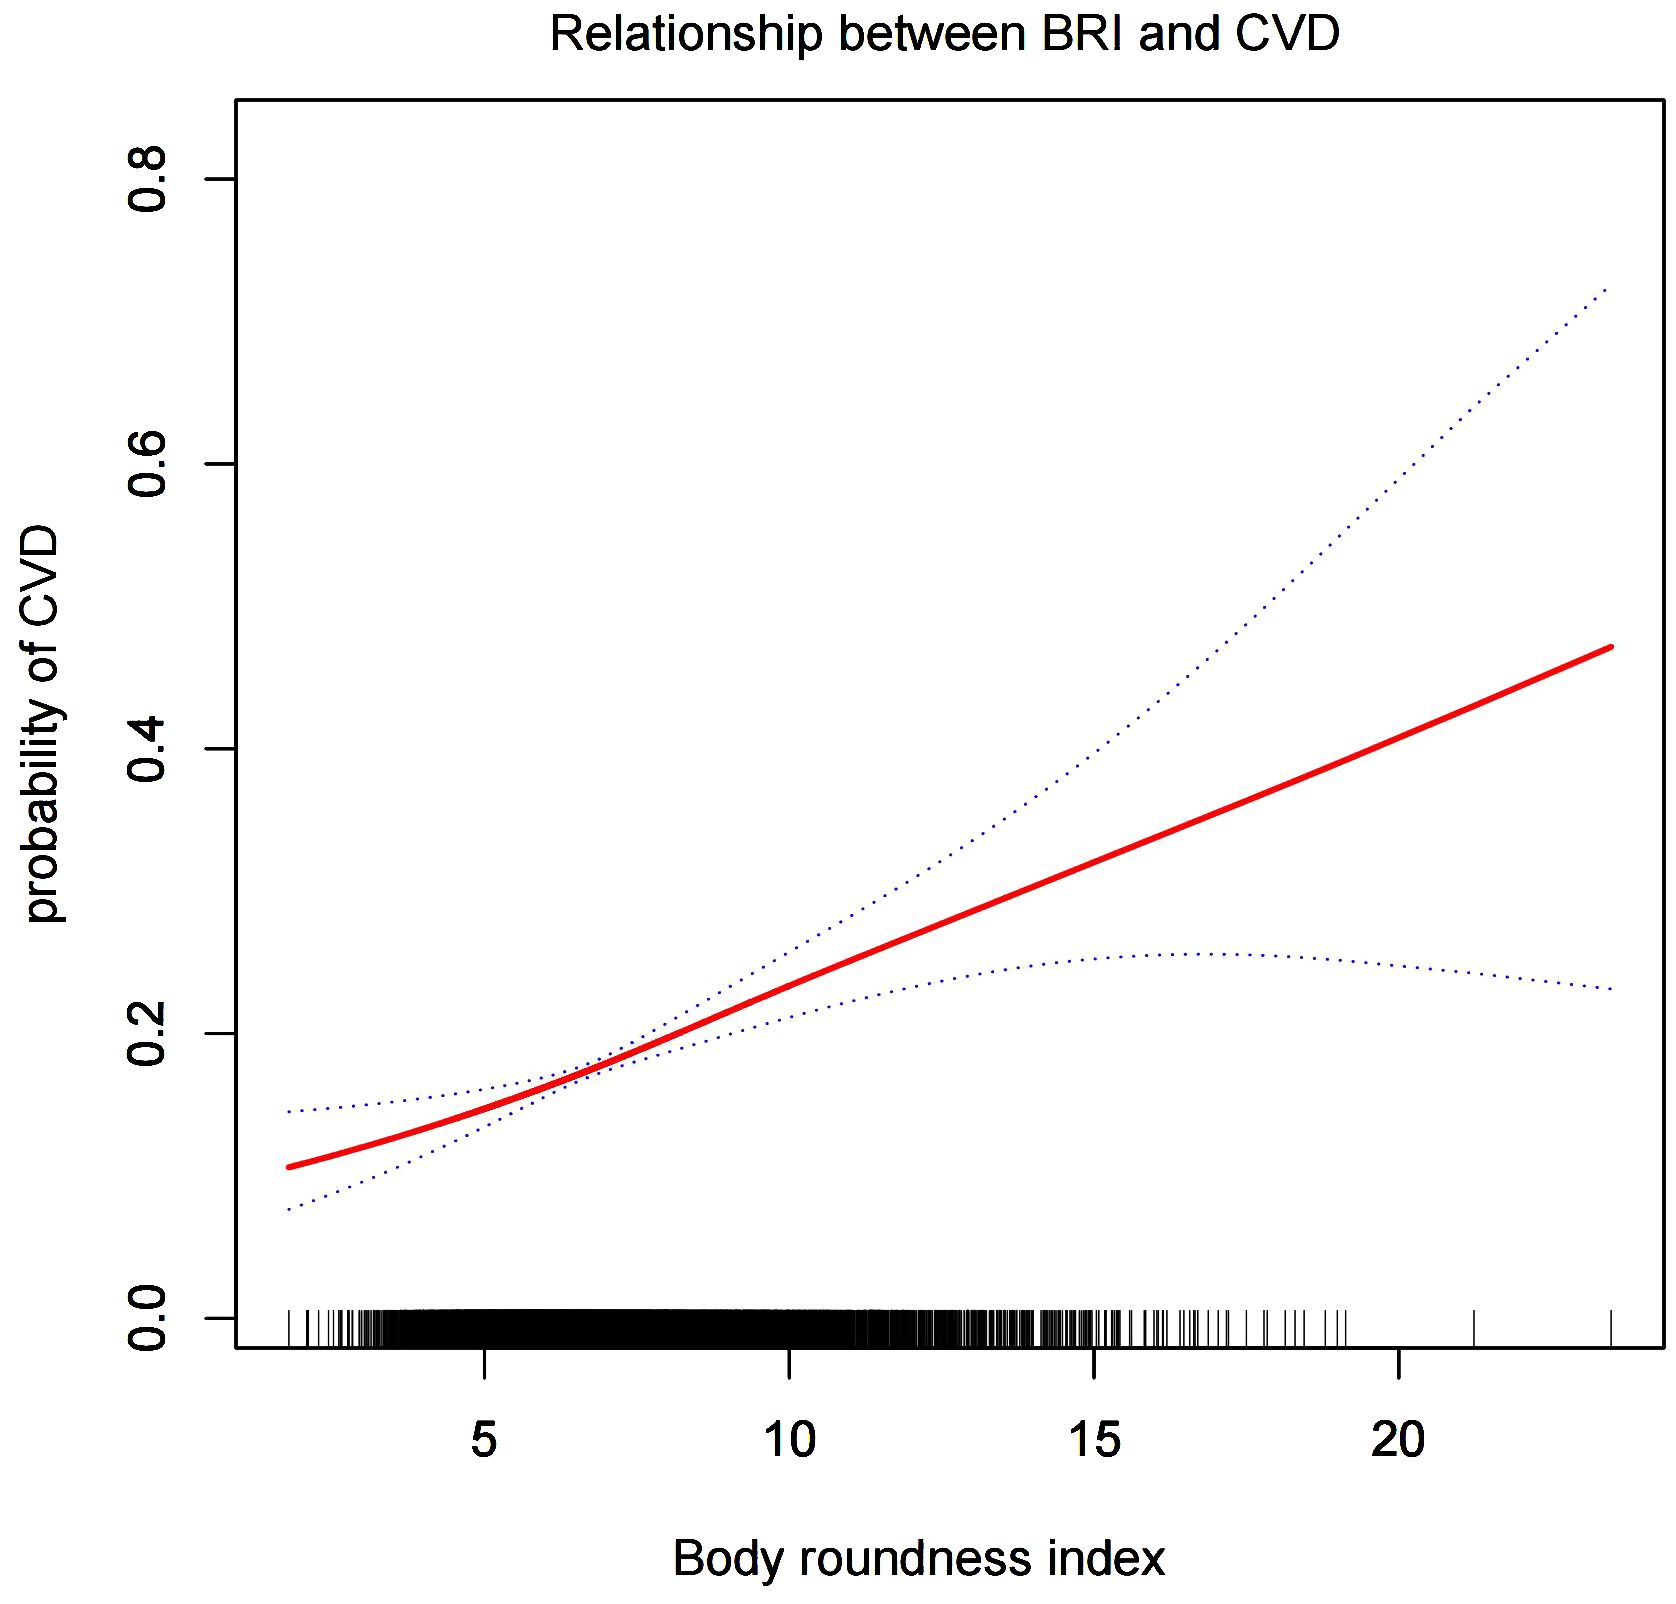
Figure 2. The smooth curve analysis between the BRI and the risk of CVD.
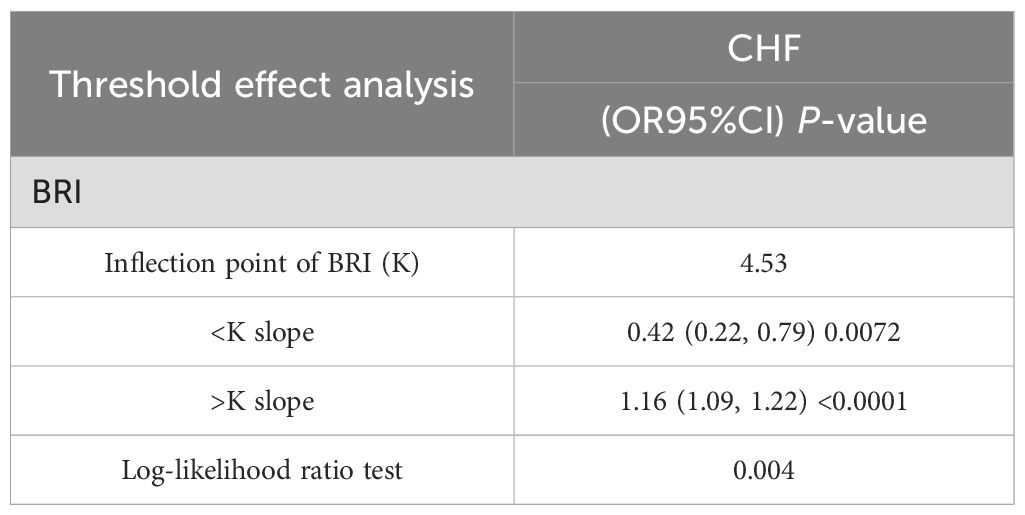
Table 3. Analysis of the threshold effect between BRI and the risk of CHF.
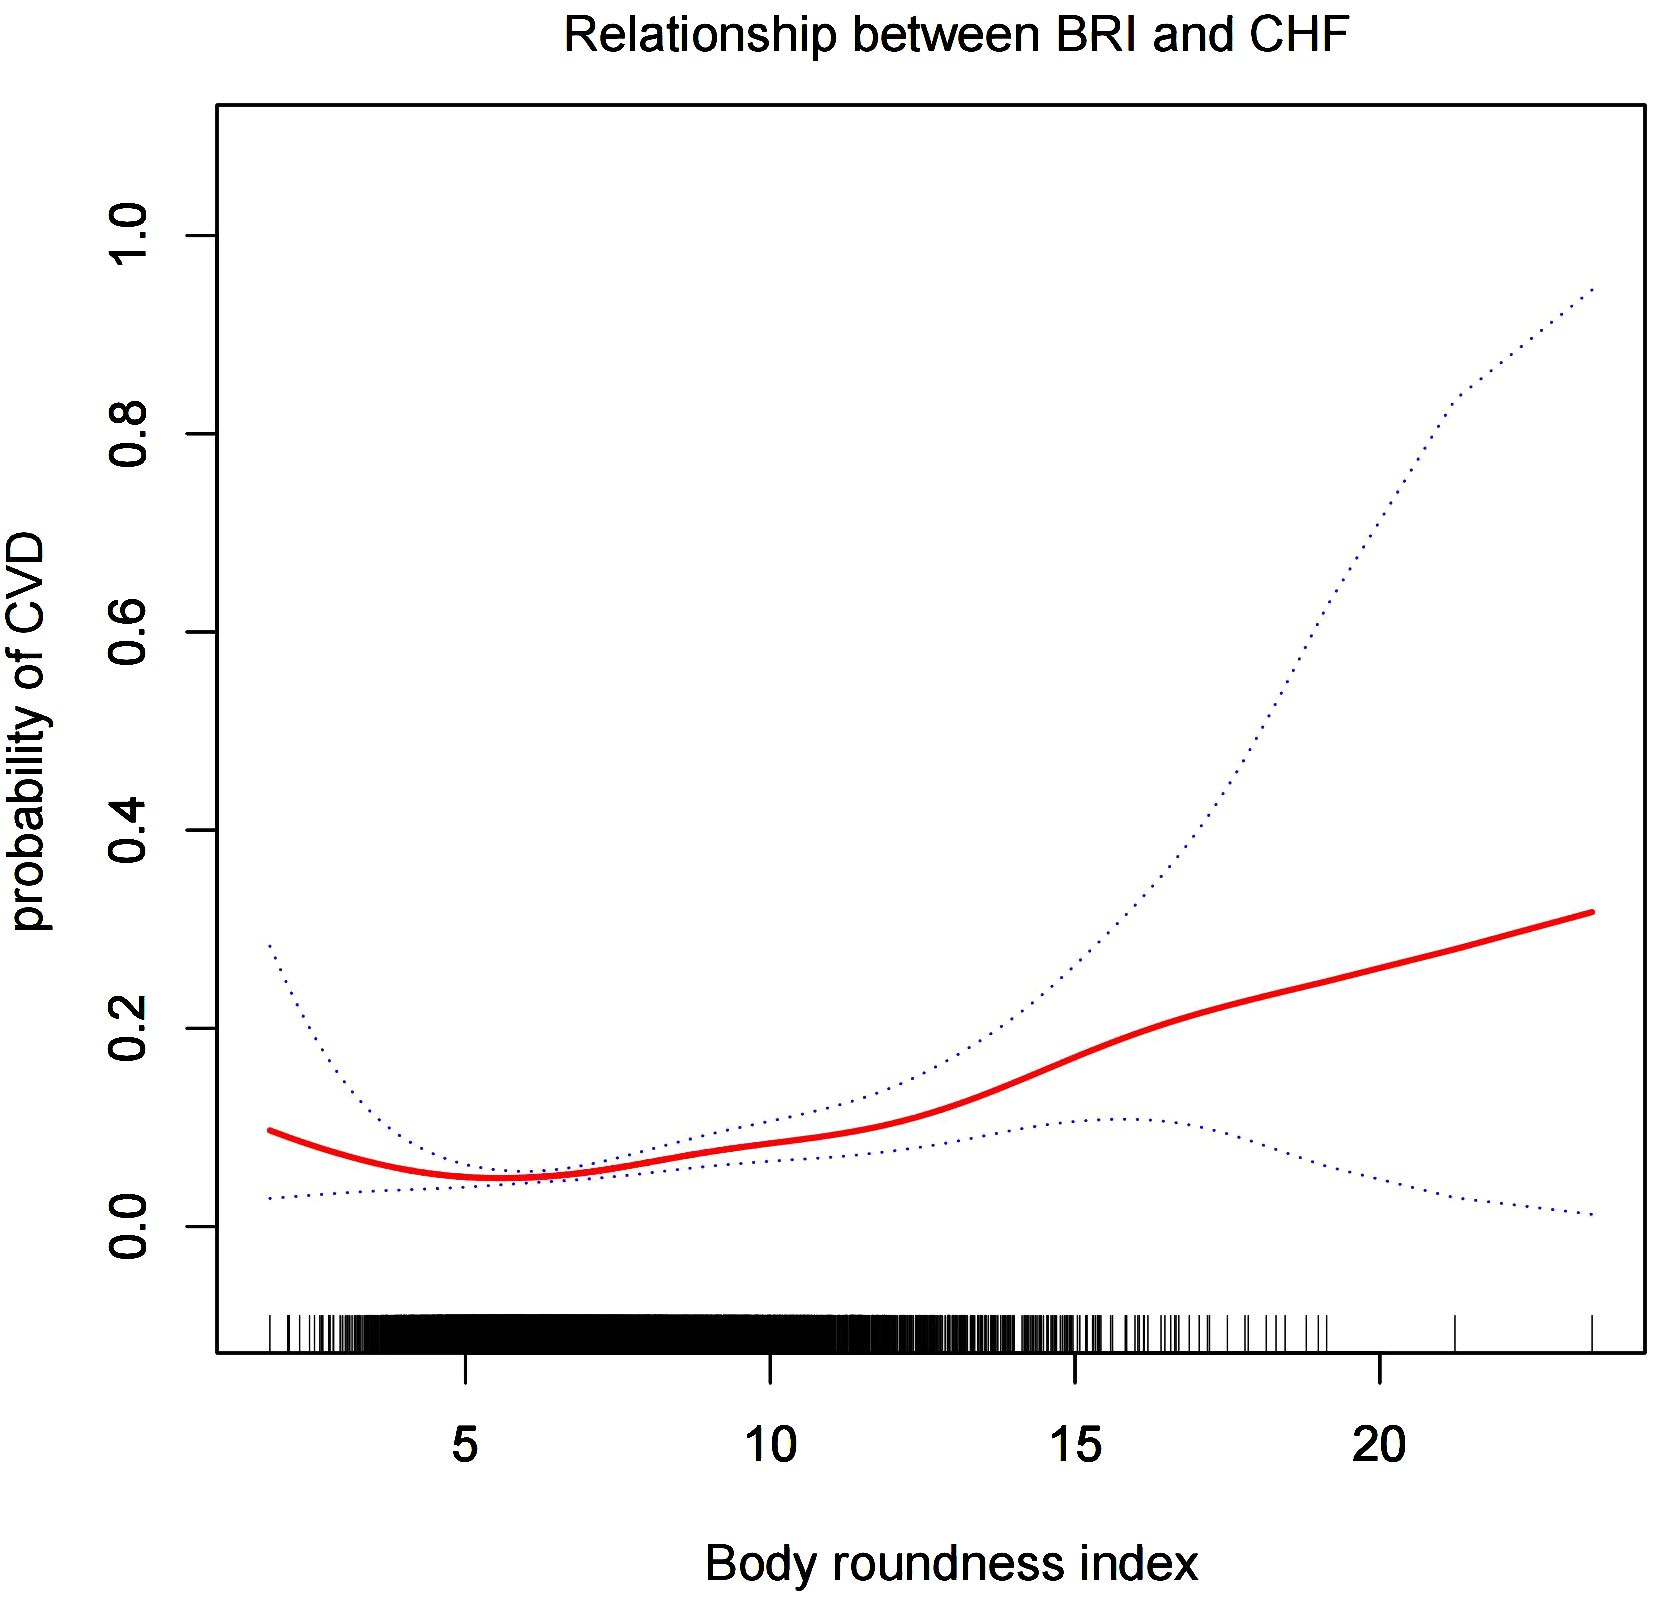
Figure 3. The smooth curve analysis between the BRI and the risk of CHF.
Subgroup analysisStratification and interaction analysis were conducted for age, gender, race, hypertension, diabetes and BMI to further investigate the association between BRI and the risk of CVD and CHF among CMS patients. Table 4 and Table 5 demonstrated that the relationship between BRI and CVD was consistent across the various subgroups. There was no significant interaction effect between BRI and stratified variables (P for interaction > 0.05). Notably, BMI interacted with the association (P for interaction = 0.0118), with BRI being associated with decreased risk of CHF in a subgroup of normal weight subjects (OR = 0.45, 95% CI 0.24 - 0.86, P = 0.0154) and increased risk of CHF in a subgroup of obese subjects (OR = 1.16, 95% CI 1.10 - 1.23, P = 0.0154). Age, gender, race, hypertension, and diabetes did not influence the association (P for interaction > 0.05).
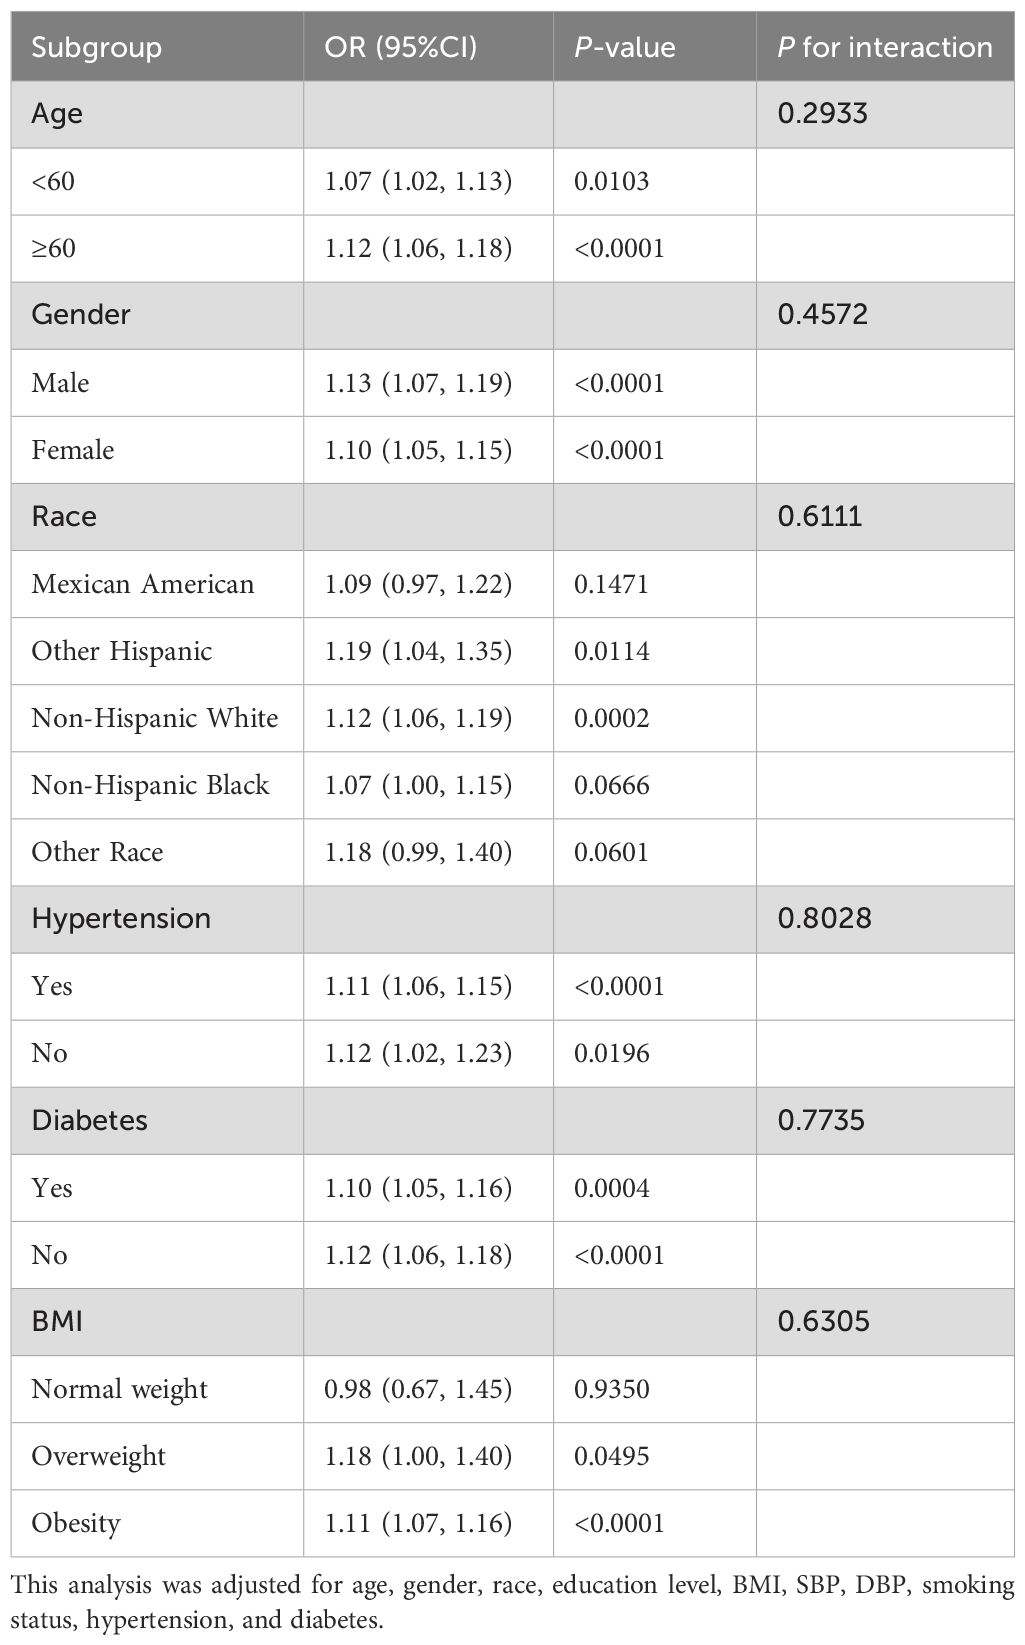
Table 4. Subgroup analysis for the association between BRI and CVD.
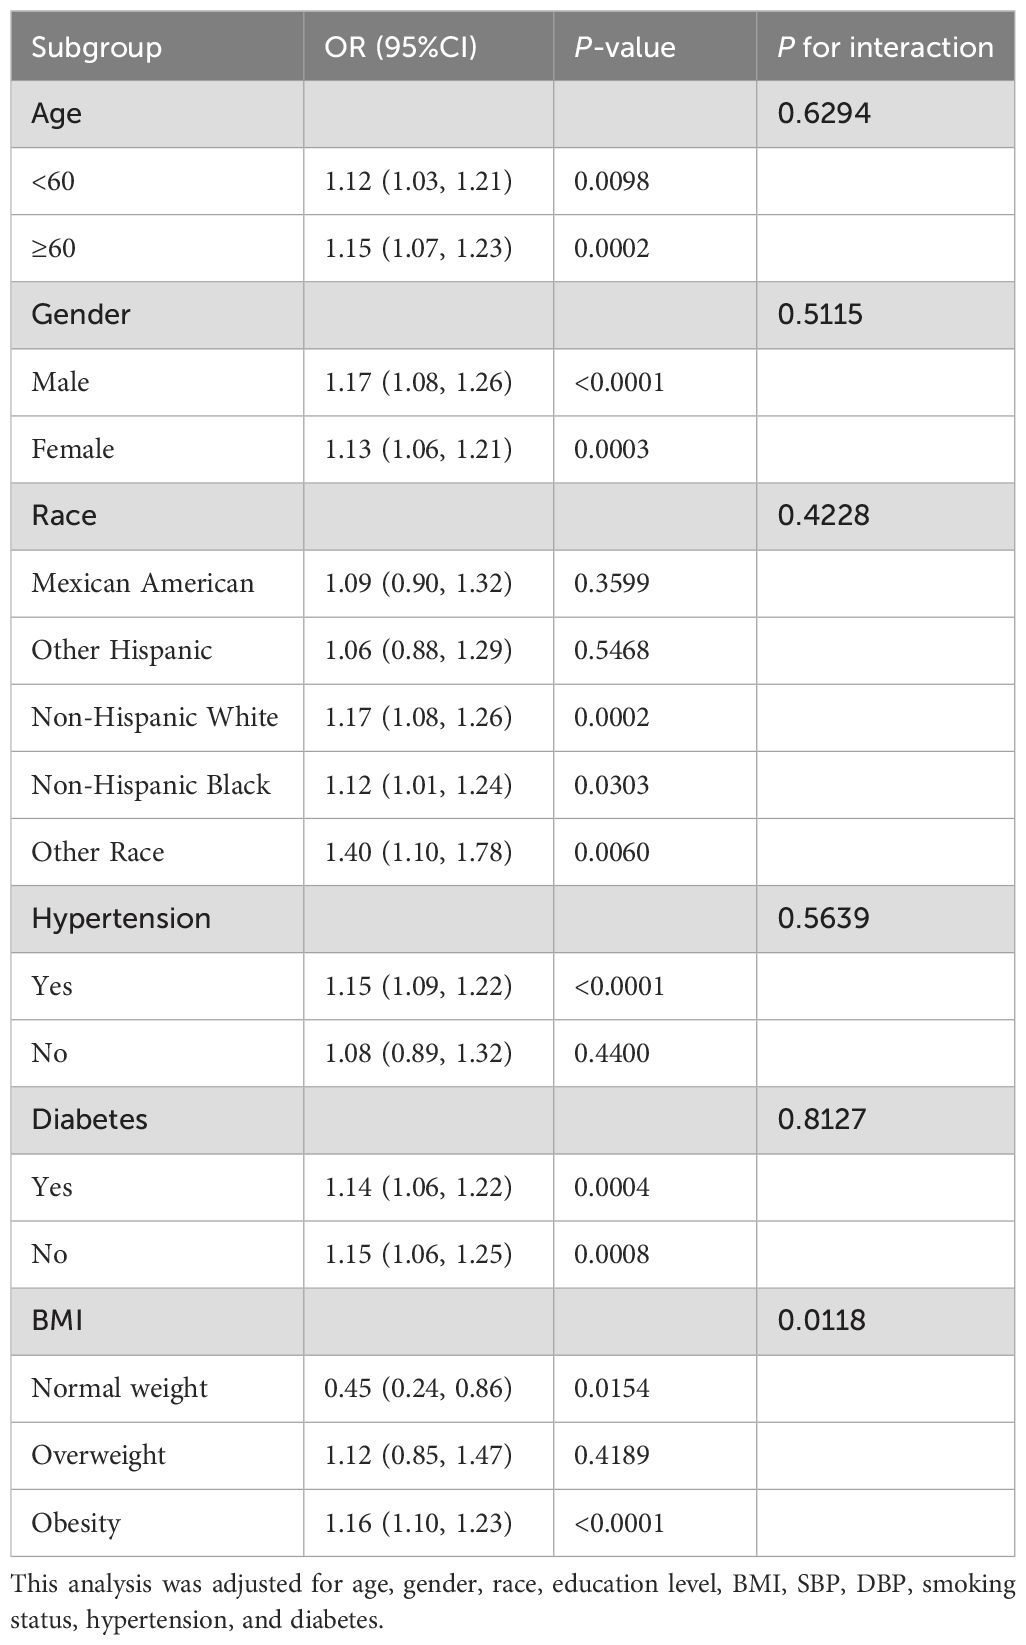
Table 5. Subgroup analysis for the association between BRI and CHF.
BRI as a predictor for CVD and CHFFigures 4 and 5 showed the area under the curve (AUC) of diagnostic capability in the CVD and CHF. These results revealed that both BRI, WC and BRI had statistically significant diagnostic capability for the detection of CVD and CHF (AUC > 0.5). BRI has diagnostic capability in detecting CVD and CHF Superior to BMI (for CVD: AUC = 0.563, for CHF: AUC = 0.594), but not better than WC (for CVD: AUC = 0.564, for CHF: AUC = 0.599).
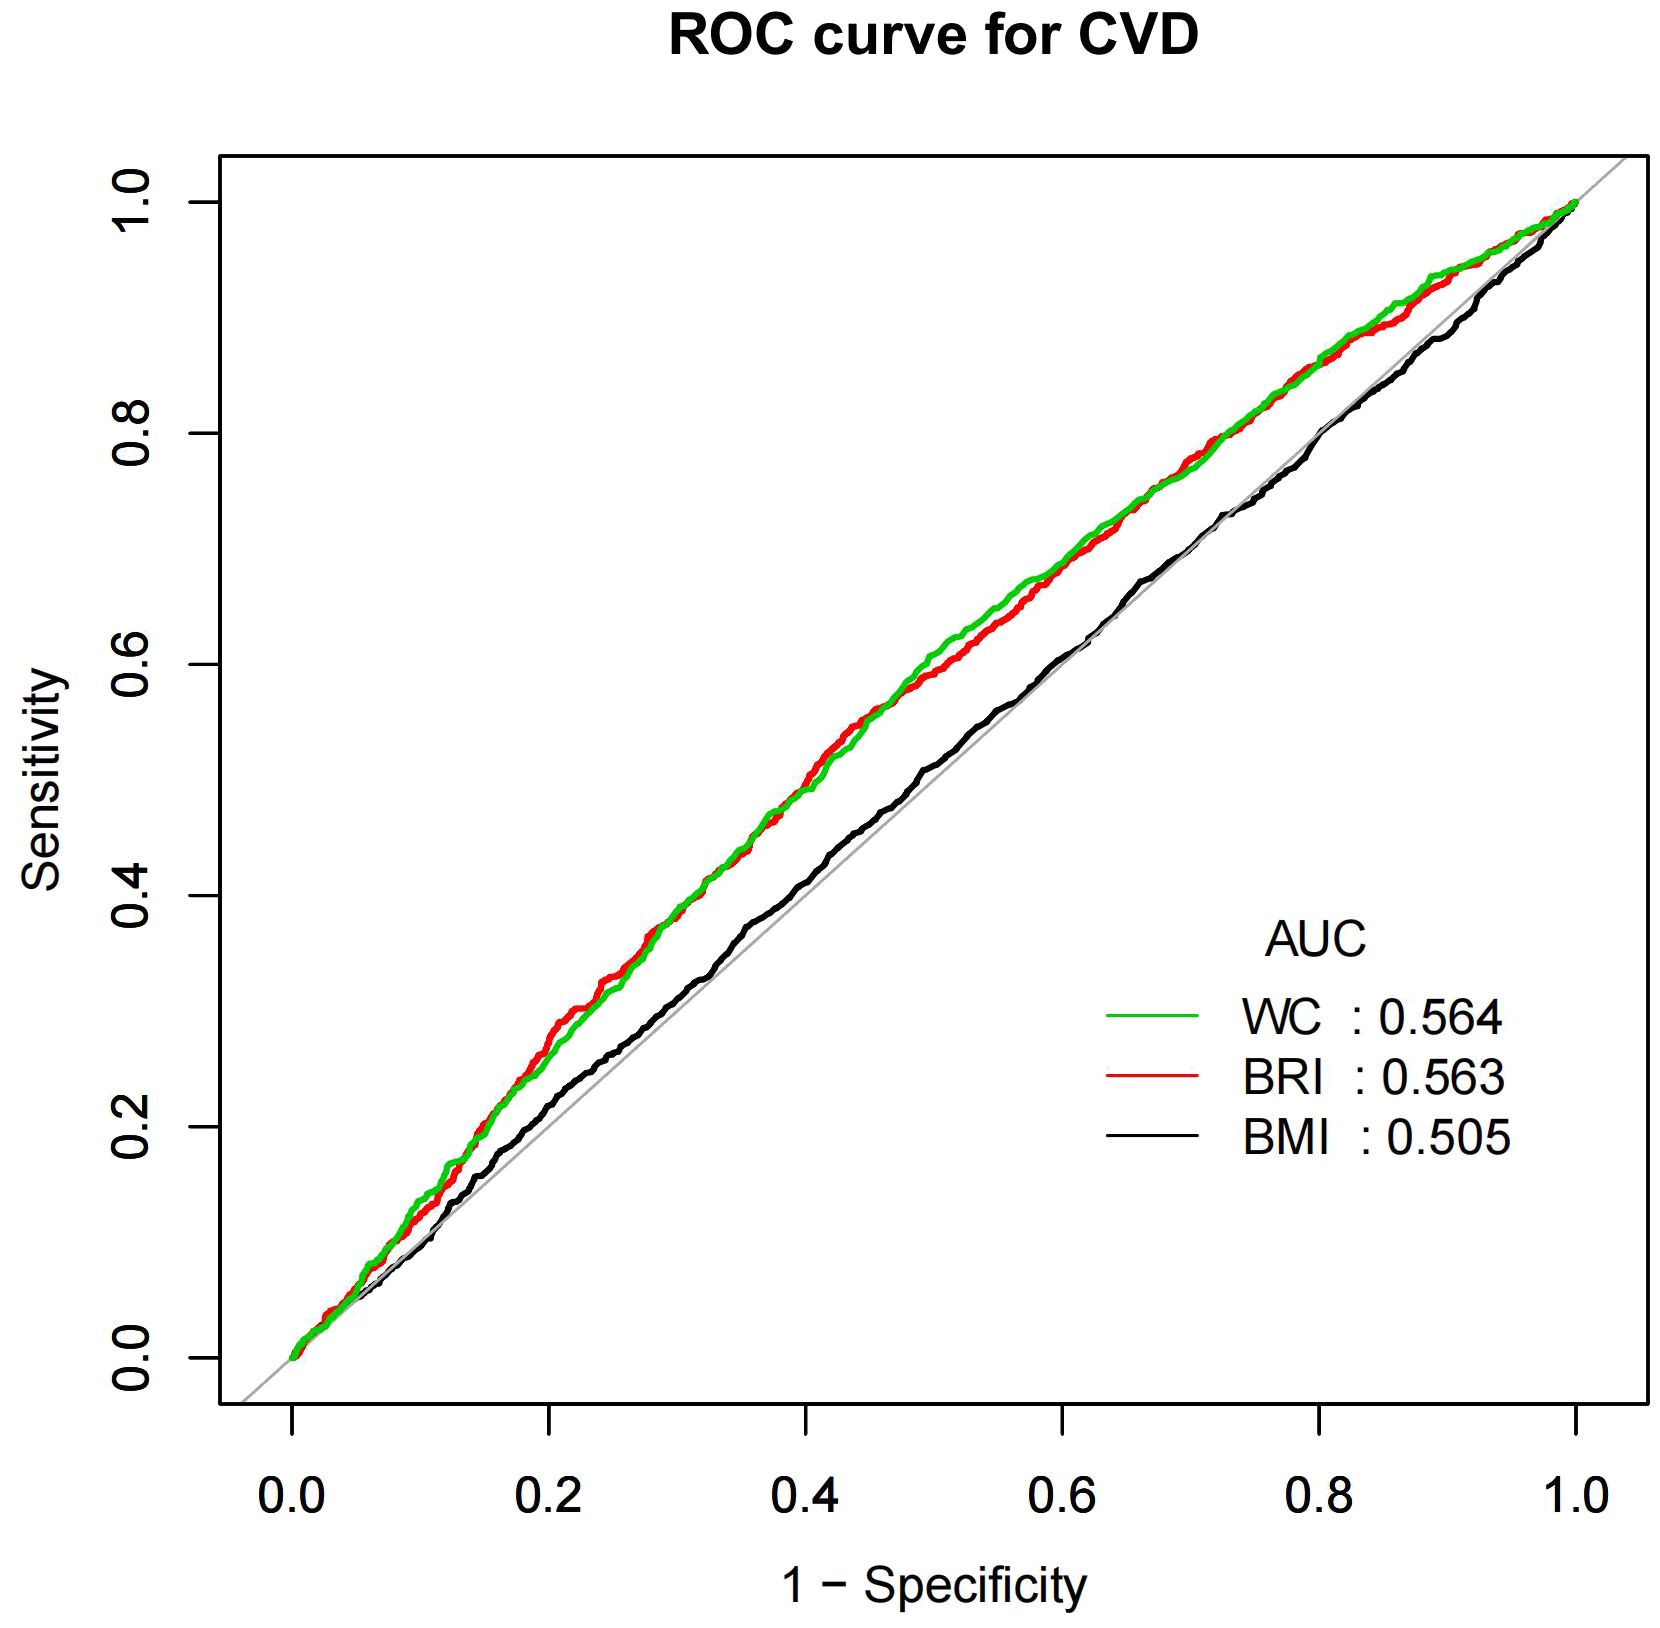
Figure 4. CVD, Cardiovascular disease; WC, Waist; BRI, Body roundness index; BMI, Body mass index; AUC, Area under the curve; ROC, Receiver operating characteristic.
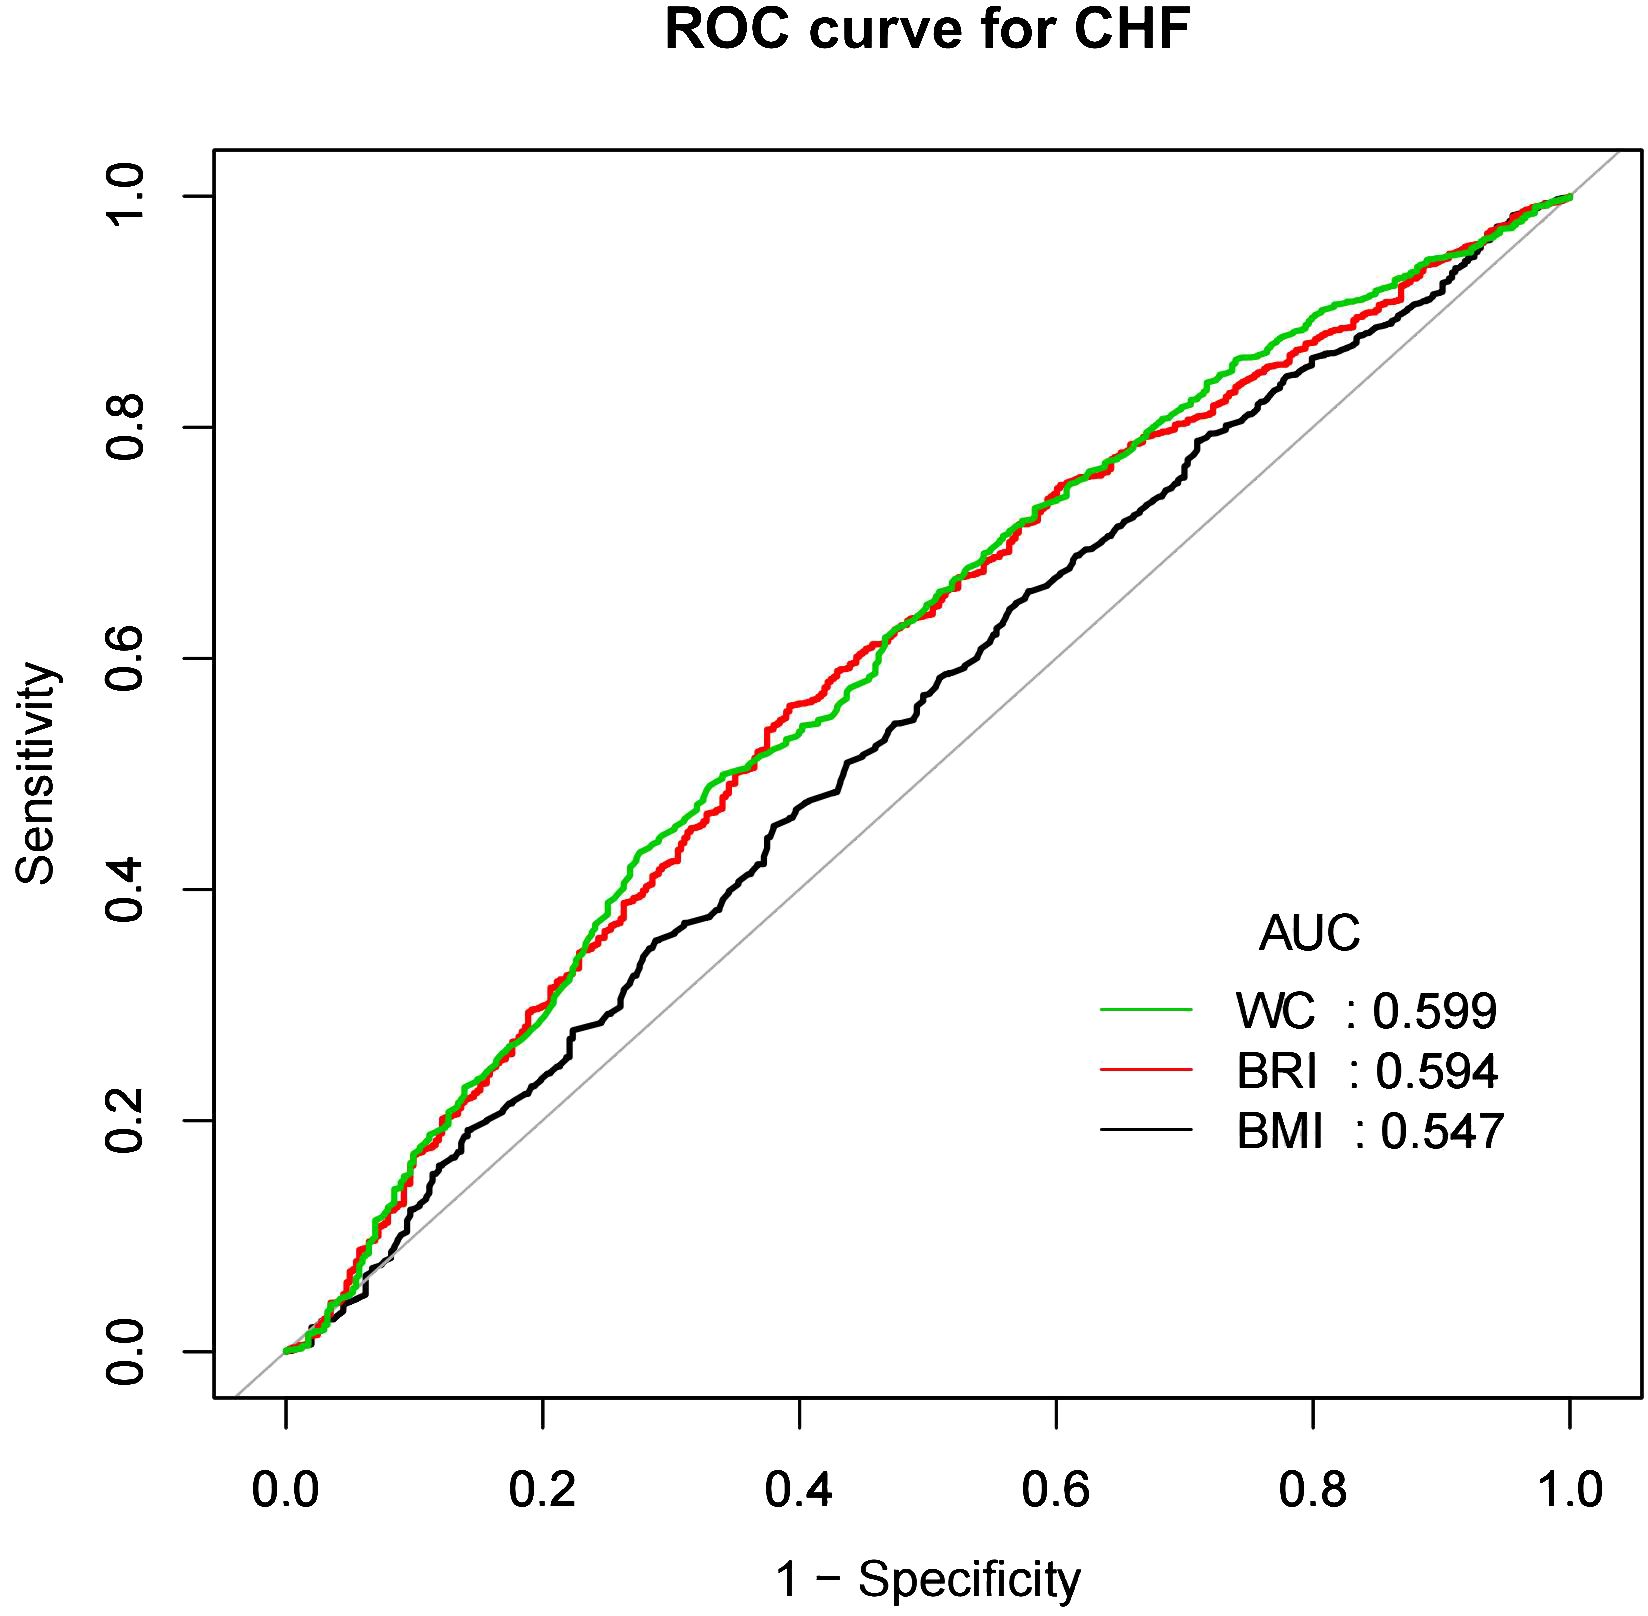
Figure 5. CHF, Congestive heart failure; WC, Waist; BRI, Body roundness index; BMI, Body mass index; AUC, Area under the curve; ROC, Receiver operating characteristic.
DiscussionThis study, which encompassed 6,640 participants, detected a positive correlation between a high BRI and an elevated risk of CVD among adults with CMS in the U.S.
Additionally, our results reveal a nonlinear relationship between BRI and CVD risk, whereas a u-shaped correlation was observed with the risk of CHF. When the BRI level was lower than 4.53, the risk of CHF decreased by 58% for every 1-unit decrease in BRI, but after this inflection point, the risk increased by 16% for every 1-unit increase in BRI. The association between BRI and CVD was consistent across subgroups and there was no significant interaction. However, BMI interacted with the association, with BRI being associated with decreased risk of CHF in a subgroup of normal weight subjects and increased risk of CHF in a subgroup of obese subjects. Multiple imputation suggests proof of the robustness of the findings. More importantly, BRI has similar ability to predict CVD and CHF as WC, and better than BMI.
Previous studies have focused on the potential role of BRI in cardiovascular disease morbidity and mortality or cardiometabolic risk factors (23, 25, 27). BRI has been shown to be a valid predictor of cardiometabolic risk and is significantly associated with cumulative cardiometabolic risk factors (23, 27, 28). Cohort studies in China have shown that a long-term increase in BRI is associated with an increased risk of CVD, stroke, or cardiac events (25, 29). Moreover, Li et al. demonstrated that the BRI was superior to other anthropometric measures, including waist circumference, in predicting the risk of cardiovascular disease in a Chinese population (24). However, Maessen et al. showed that the BRI was not superior as a novel body metric for identifying CVD compared to established anthropometric measures such as BMI and WC (30). Higher WC is associated with an increased risk of CVD, and the positive association between WC and new myocardial infarction and stroke has been shown to be higher in individuals <60 years of age (31). Our conclusions are consistent with previous studies that a higher BRI is associated with an increased risk of CVD. Also, BRI predicted CVD similarly to WC but better than BMI. Unusually, we also found a U-shaped association between BRI and CHF in participants evaluated for CMS, which has not been found in previous studies. This may be since previous studies focused on cardiovascular diseases such as stroke and myocardial infarction. However, the low prevalence of CHF in this study encourages future studies to further explore the potential nonlinear association between BRI and CHF. In addition, our study found that BRI was associated with a reduced risk of CHF in a subgroup of normal-weight subjects and an increased risk of CHF in a subgroup of obese subjects. There is a complex link between BMI and CHF that may involve multiple aspects. Higher BMI may increase the risk of CHF through melatonin secretion and metabolism, reduced sleep quality, and reduced activity (32). In the Belgian cohort, patients in the high inositol level group (highest tertile) also had a higher BMI, predicting poor clinical outcomes in heart failure patients with preserved ejection fraction (HFpEF) (33). This may be related to IR or other metabolic disorders due to obesity, which in turn affects inositol metabolism. This suggests that weight control may help reduce the risk of heart failure and improve prognosis. Another study suggested that machine learning algorithms may help to address the heterogeneity of HFpEF patients and provide new directions for precision therapy (34). This deserves further exploration.
Traditional indicators like BMI and WC have limitations in clinical scenarios. BMI does not distinguish between fat, muscle, and bone mass. Meanwhile, WC measures abdominal fat without taking height into consideration, resulting in potential misclassification of obesity in individuals with different heights (35). In contrast, the BRI uses an ellipsoid model to assess body size by integrating waist circumference and height independent of body weight, allowing for a more accurate representation of body fat as a proportion of total body weight (18). And it is critical for identifying health risks in individuals with an abnormal distribution of body fat (36). BRI effectively quantifies central obesity and is significantly associated with metabolic dysregulation, inflammatory response, vascular dysfunction, and oxidative stress, all of which can accelerate the progression of CVD (37). A study showed that the BRI performed similarly or better than BMI and WC in predicting CMS and CMS components in Peruvian adults, and showed the best ability to identify IR in obese and overweight populations (38). The mechanisms linking elevated BRI levels to increased CVD risk are not fully understood in patients with CMS. We will elaborate on the following aspects. First, previous cross-sectional studies have demonstrated a role for branched-chain amino acids (BCAAs) and lipid metabolism in the pathogenesis of type 2 diabetes mellitus (T2D) and coronary atherosclerotic heart disease (CAD), suggesting that obesity has an important role in the development of CVD (39). Secondly, the accumulation of excess body fat contributes to an inflammatory response in the blood and leads to oxidative stress, which increases the risk of CVD (17). This suggests that by calculating the BRI, we can identify the risk of metabolism in overweight and obese people at an early stage and reduce the risk of CVD by controlling weight and reducing fat accumulation. In recent years, an increasing number of studies have focused on the association between gut fungi and metabolism (40). This suggests that the relationship between gut fungi and other metabolic diseases, such as diabetes and cardiovascular disease, deserves further investigation. Kun et al. showed that gut fungi may affect CAD through mechanisms such as influencing immunity, metabolic processes, or systemic inflammation (41). Therefore, it is promising to develop interventional strategies based on gut fungi in the future, e.g., by modulating the intestinal fungal community for the prevention and treatment of metabolic diseases.
LimitationThere are several limitations of our study. Firstly, being a cross-sectional study, it cannot establish a causal connection between BRI and the risk of CVD in patients with CMS. This design is unable to track changes in variables over time or recognize trends and dynamic patterns in time-series data, thus limiting its ability to assess long-term impacts and changes in time dynamics. In future studies, prospective cohort studies could be used to validate our findings. Secondly, diagnosis of CVD relied on participant self-reporting, but participants’ lack of knowledge about cardiovascular disease could affect the accuracy of subsequent analyses. Thus, the BRI’s ability to recognize CVD may be somewhat higher. In addition, the research sample is largely composed of subjects originating from the US., which limits the applicability of the findings to a worldwide context. Although we have strived to control for potential complicating variables, the likelihood of remaining confounding factors cannot be entirely ruled out (such as dietary habits and physical activity levels). Undocumented eating habits may affect body weight and fat distribution, which in turn affects BRI. Physical activity not only affects body weight and shape, but also directly affects cardiovascular health. Physical inactivity may lead to a higher risk of BRI and CVD, but this confounder may not be adequately captured in the NHANES data. Future studies should consider a more comprehensive assessment and adjustment of these potential confounders. Furthermore, we did not account for the influence of pharmacological treatments. Patients with CMS often experience multiple coexisting chronic diseases that necessitate antihypertensive, hypoglycemic, and lipid-lowering therapies. This could lead to a decrease in the number of patients we have diagnosed with CMS. Despite these limitations, this study highlights the association between BRI and the risk of cardiovascular disease in patients with CMS and paves the way for future longitudinal studies.
ConclusionThis study demonstrated the positive relationship between the BRI and CVD in individuals diagnosed with CMS. Notably, a U-shaped correlation was observed between BRI and the risk of CHF. Increased assessment of BRI would facilitate easier and more effective screening of individuals at risk for CHF. In addition, this threshold could be used as a target for interventions to reduce CHF risk. Future studies should further explore whether interventions targeting the BRI may improve the clinical prognosis of CMS patients with CVD.
Author contributionsXH: Conceptualization, Software, Validation, Visualization, Writing – original draft. JZ: Formal analysis, Software, Writing – original draft. WL: Data curation, Formal analysis, Writing – original draft. XY: Data curation, Visualization, Writing – original draft. WN: Methodology, Supervision, Writing – review & editing. ZZ: Supervision, Writing – review & editing. JC: Project administration, Supervision, Writing – review & editing. QH: Project administration, Resources, Supervision, Writing – review & editing.
FundingThe author(s) declare that financial support was received for the research, authorship, and/or publication of this article. This article was supported by the Key Laboratory for Brain Intractable Diseases, Dongguan [No. 117 of Dongke Tong (2023)] and the Guangdong Famous Traditional Chinese Medicine Practitioners Inheritance Workshop Construction Project [No. 108 of the Office of Guangdong University of Chinese Medicine (2023)].
Conflict of interestThe authors declare that the research was conducted in the absence of any commercial or financial relationships that could be construed as a potential conflict of interest.
Generative AI statementThe author(s) declare that no Generative AI was used in the creation of this manuscript.
Publisher’s noteAll claims expressed in this article are solely those of the authors and do not necessarily represent those of their affiliated organizations, or those of the publisher, the editors and the reviewers. Any product that may be evaluated in this article, or claim that may be made by its manufacturer, is not guaranteed or endorsed by the publisher.
Supplementary materialThe Supplementary Material for this article can be found online at: https://www.frontiersin.org/articles/10.3389/fendo.2025.1524352/full#supplementary-material
References1. Martin SS, Aday AW, Almarzooq ZI, Anderson CAM, Arora P, Avery CL, et al. 2024 Heart disease and stroke statistics: A report of US and global data from the American heart association. Circ (New York N.Y.). (2024) 149:e347. doi: 10.1161/CIR.0000000000001209
PubMed Abstract | Crossref Full Text | Google Scholar
2. Li Y, Cao Y, Jing Y, Liu Y, Liu Y. Global trends and regional differences in incidence and mortality of cardiovascular disease, 1990–2019: findings from 2019 global burden of disease study. Eur J Prev Cardiol. (2023) 30:276–86. doi: 10.1093/eurjpc/zwac285
PubMed Abstract | Crossref Full Text | Google Scholar
3. Chong B, Jayabaskaran J, Jauhari SM, Chan SP, Goh R, Kueh M, et al. Global burden of cardiovascular diseases: projections from 2025 to 2050. Eur J Prev Cardiol. (2024) zwae281. doi: 10.1093/eurjpc/zwae281
PubMed Abstract | Crossref Full Text | Google Scholar
4. Roth GA, Mensah GA, Johnson CO, Addolorato G, Ammirati E, Baddour LM, et al. Global burden of cardiovascular diseases and risk factors, 1990-2019: update from the GBD 2019 study. J Am Coll Cardiol. (2020) 76:2982–3021. doi: 10.1016/j.jacc.2020.11.010
PubMed Abstract | Crossref Full Text | Google Scholar
5. Powell-Wiley TM, Poirier P, Burke LE, Despres JP, Gordon-Larsen P, Lavie CJ, et al. Obesity and cardiovascular disease: A scientific statement from the American heart association. Circulation. (2021) 143:e984–e1010. doi: 10.1161/CIR.0000000000000973
PubMed Abstract | Crossref Full Text | Google Scholar
6. Li X, Wu C, Lu J, Chen B, Li Y, Yang Y, et al. Cardiovascular risk factors in China: a nationwide population-based cohort study. Lancet Public Health. (2020) 5:e672–81. doi: 10.1016/S2468-2667(20)30191-2
PubMed Abstract | Crossref Full Text | Google Scholar
9. Grundy SM, Brewer HJ, Cleeman JI, Smith SJ, Lenfant C. Definition of metabolic syndrome: report of the National Heart, Lung, and Blood Institute/American Heart Association conference on scientific issues related to definition. Arterioscler Thromb Vasc Biol. (2004) 24:e13–8. doi: 10.1161/01.ATV.0000111245.75752.C6
PubMed Abstract | Crossref Full Text | Google Scholar
10. Global burden and strength of evidence for 88 risk factors in 204 countries and 811 subnational locations, 1990-2021: a systematic analysis for the Global Burden of Disease Study 2021. Lancet. (2024) 403:2162–203. doi: 10.1016/S0140-6736(24)00933-4
PubMed Abstract | Crossref Full Text | Google Scholar
11. Yang C, Jia X, Wang Y, Fan J, Zhao C, Yang Y, et al. Trends and influence factors in the prevalence, intervention, and control of metabolic syndrome among US adults, 1999-2018. BMC Geriatr. (2022) 22:979. doi: 10.1186/s12877-022-03672-6
PubMed Abstract | Crossref Full Text | Google Scholar
12. O’Hearn M, Lauren BN, Wong JB, Kim DD, Mozaffarian D. Trends and disparities in cardiometabolic health among U.S. Adults, 1999-2018. J Am Coll Cardiol. (2022) 80:138–51. doi: 10.1016/j.jacc.2022.04.046
PubMed Abstract | Crossref Full Text | Google Scholar
14. Stinson SE, Kromann RP, Lund M, Lausten-Thomsen U, Aas HL, Huang Y, et al. The interplay between birth weight and obesity in determining childhood and adolescent cardiometabolic risk. EBioMedicine. (2024) 105:105205. doi: 10.1016/j.ebiom.2024.105205
PubMed Abstract | Crossref Full Text | Google Scholar
15. Safaei M, Sundararajan EA, Driss M, Boulila W, Shapi'I A. A systematic literature review on obesity: Understanding the causes & consequences of obesity and reviewing various machine learning approaches used to predict obesity. Comput Biol Med. (2021) 136:104754. doi: 10.1016/j.compbiomed.2021.104754
PubMed Abstract | Crossref Full Text | Google Scholar
16. Mohamed SM, Shalaby MA, El-Shiekh RA, El-Banna HA, Emam SR, Bakr AF. Metabolic syndrome: risk factors, diagnosis, pathogenesis, and management with natural approaches. Food Chem Adv. (2023) 3:100335. doi: 10.1016/j.focha.2023.100335
Crossref Full Text | Google Scholar
17. Zheng J, Xu M, Yang Q, Hu C, Walker V, Lu J, et al. Efficacy of metformin targets on cardiometabolic health in the general population and non-diabetic individuals: a Mendelian randomization study. EBioMedicine. (2023) 96:104803. doi: 10.1016/j.ebiom.2023.104803
PubMed Abstract | Crossref Full Text | Google Scholar
18. Thomas DM, Bredlau C, Bosy-Westphal A, Mueller M, Shen W, Gallagher D, et al. Relationships between body roundness with body fat and visceral adipose tissue emerging from a new geometrical model. Obes (Silver Spring). (2013) 21:2264–71. doi: 10.1002/oby.20408
PubMed Abstract | Crossref Full Text | Google Scholar
19. Sweatt K, Garvey WT, Martins C. Strengths and limitations of BMI in the diagnosis of obesity: what is the path forward? Curr Obes Rep. (2024) 13:584–95. doi: 10.1007/s13679-024-00580-1
PubMed Abstract | Crossref Full Text | Google Scholar
20. Sommer I, Teufer B, Szelag M, Nussbaumer-Streit B, Titscher V, Klerings I, et al. The performance of anthropometric tools to determine obesity: a systematic review and meta-analysis. Sci Rep. (2020) 10:12699. doi: 10.1038/s41598-020-69498-7
PubMed Abstract | Crossref Full Text | Google Scholar
21. Wu L, Zhu W, Qiao Q, Huang L, Li Y, Chen L. Novel and traditional anthropometric indices for identifying metabolic syndrome in non-overweight/obese adults. Nutr Metab (Lond). (2021) 18:3. doi: 10.1186/s12986-020-00536-x
PubMed Abstract | Crossref Full Text | Google Scholar
22. Jurado-Fasoli L, Sanchez-Delgado G, Alcantara JM, Acosta FM, Sanchez-Sanchez R, Labayen I, et al. Adults with metabolically healthy overweight or obesity present more brown adipose tissue and higher thermogenesis than their metabolically unhealthy counterparts. EBioMedicine. (2024) 100:104948. doi: 10.1016/j.ebiom.2023.104948
PubMed Abstract | Crossref Full Text | Google Scholar
23. Rico-Martin S, Calderon-Garcia JF, Sanchez-Rey P, Franco-Antonio C, Martinez AM, Sanchez MJ. Effectiveness of body roundness index in predicting metabolic syndrome: A systematic review and meta-analysis. Obes Rev
留言 (0)