
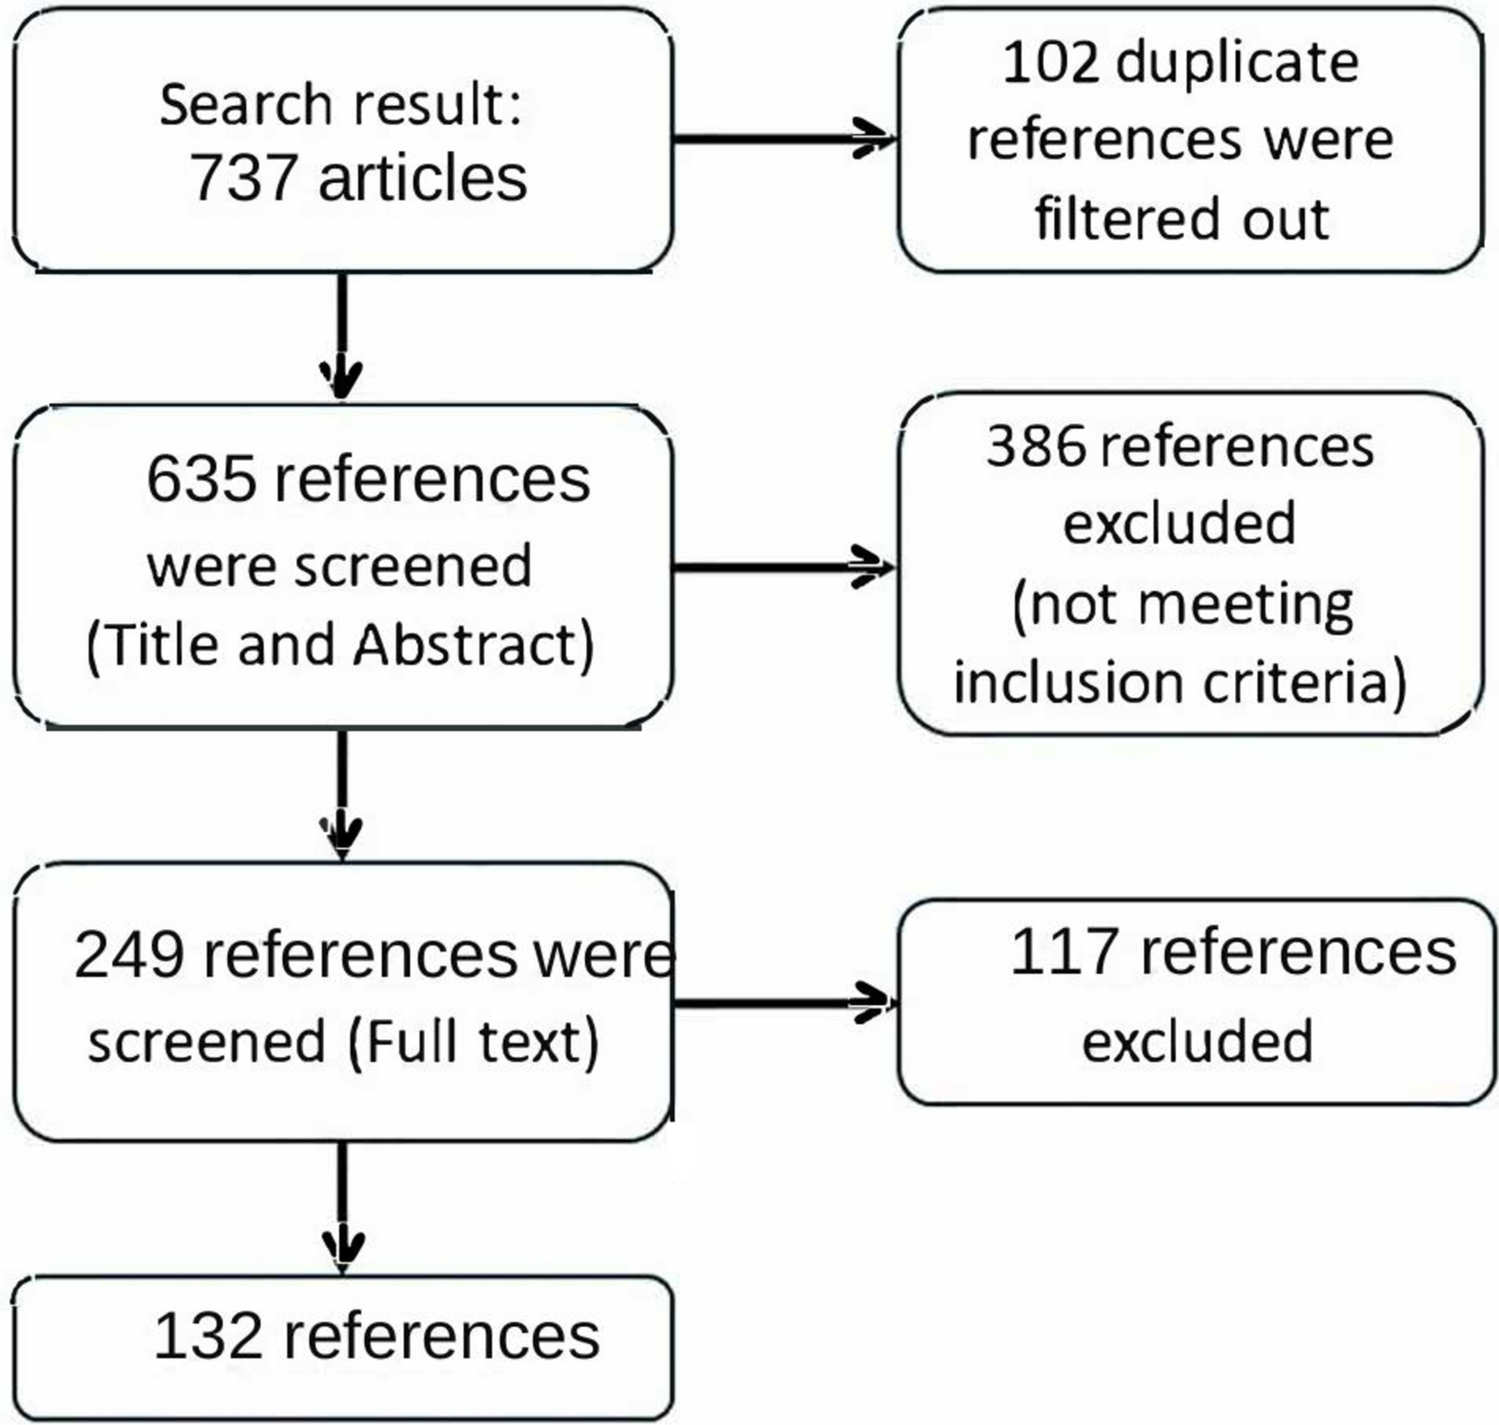
記住我


This study included 37 patients. Table 1 summarizes the patient characteristics. The mean age of the patients was 58.7 ± 9.6 years, and the mean MD value of the HFA10-2 tests was −25.0 ± 9.0 decibels (dB) (Table 1). Regarding CYP4V2 mutations, 20 patients exhibited a homozygous c.802-8_810delinsGC mutation, one patient had a homozygous c.518T>G mutation, and the remaining patients showed compound heterozygous mutations (Supplementary Table S1). Twenty-five eyes underwent ≥ 2 HFA10-2 tests during the observation period of > 6 months. The observation period ranged from 0.77 to 14.05 years, with a mean duration of 5.9 ± 3.8 years. The mean MD slope was −0.91 ± 1.02 dB/year (Table 2).
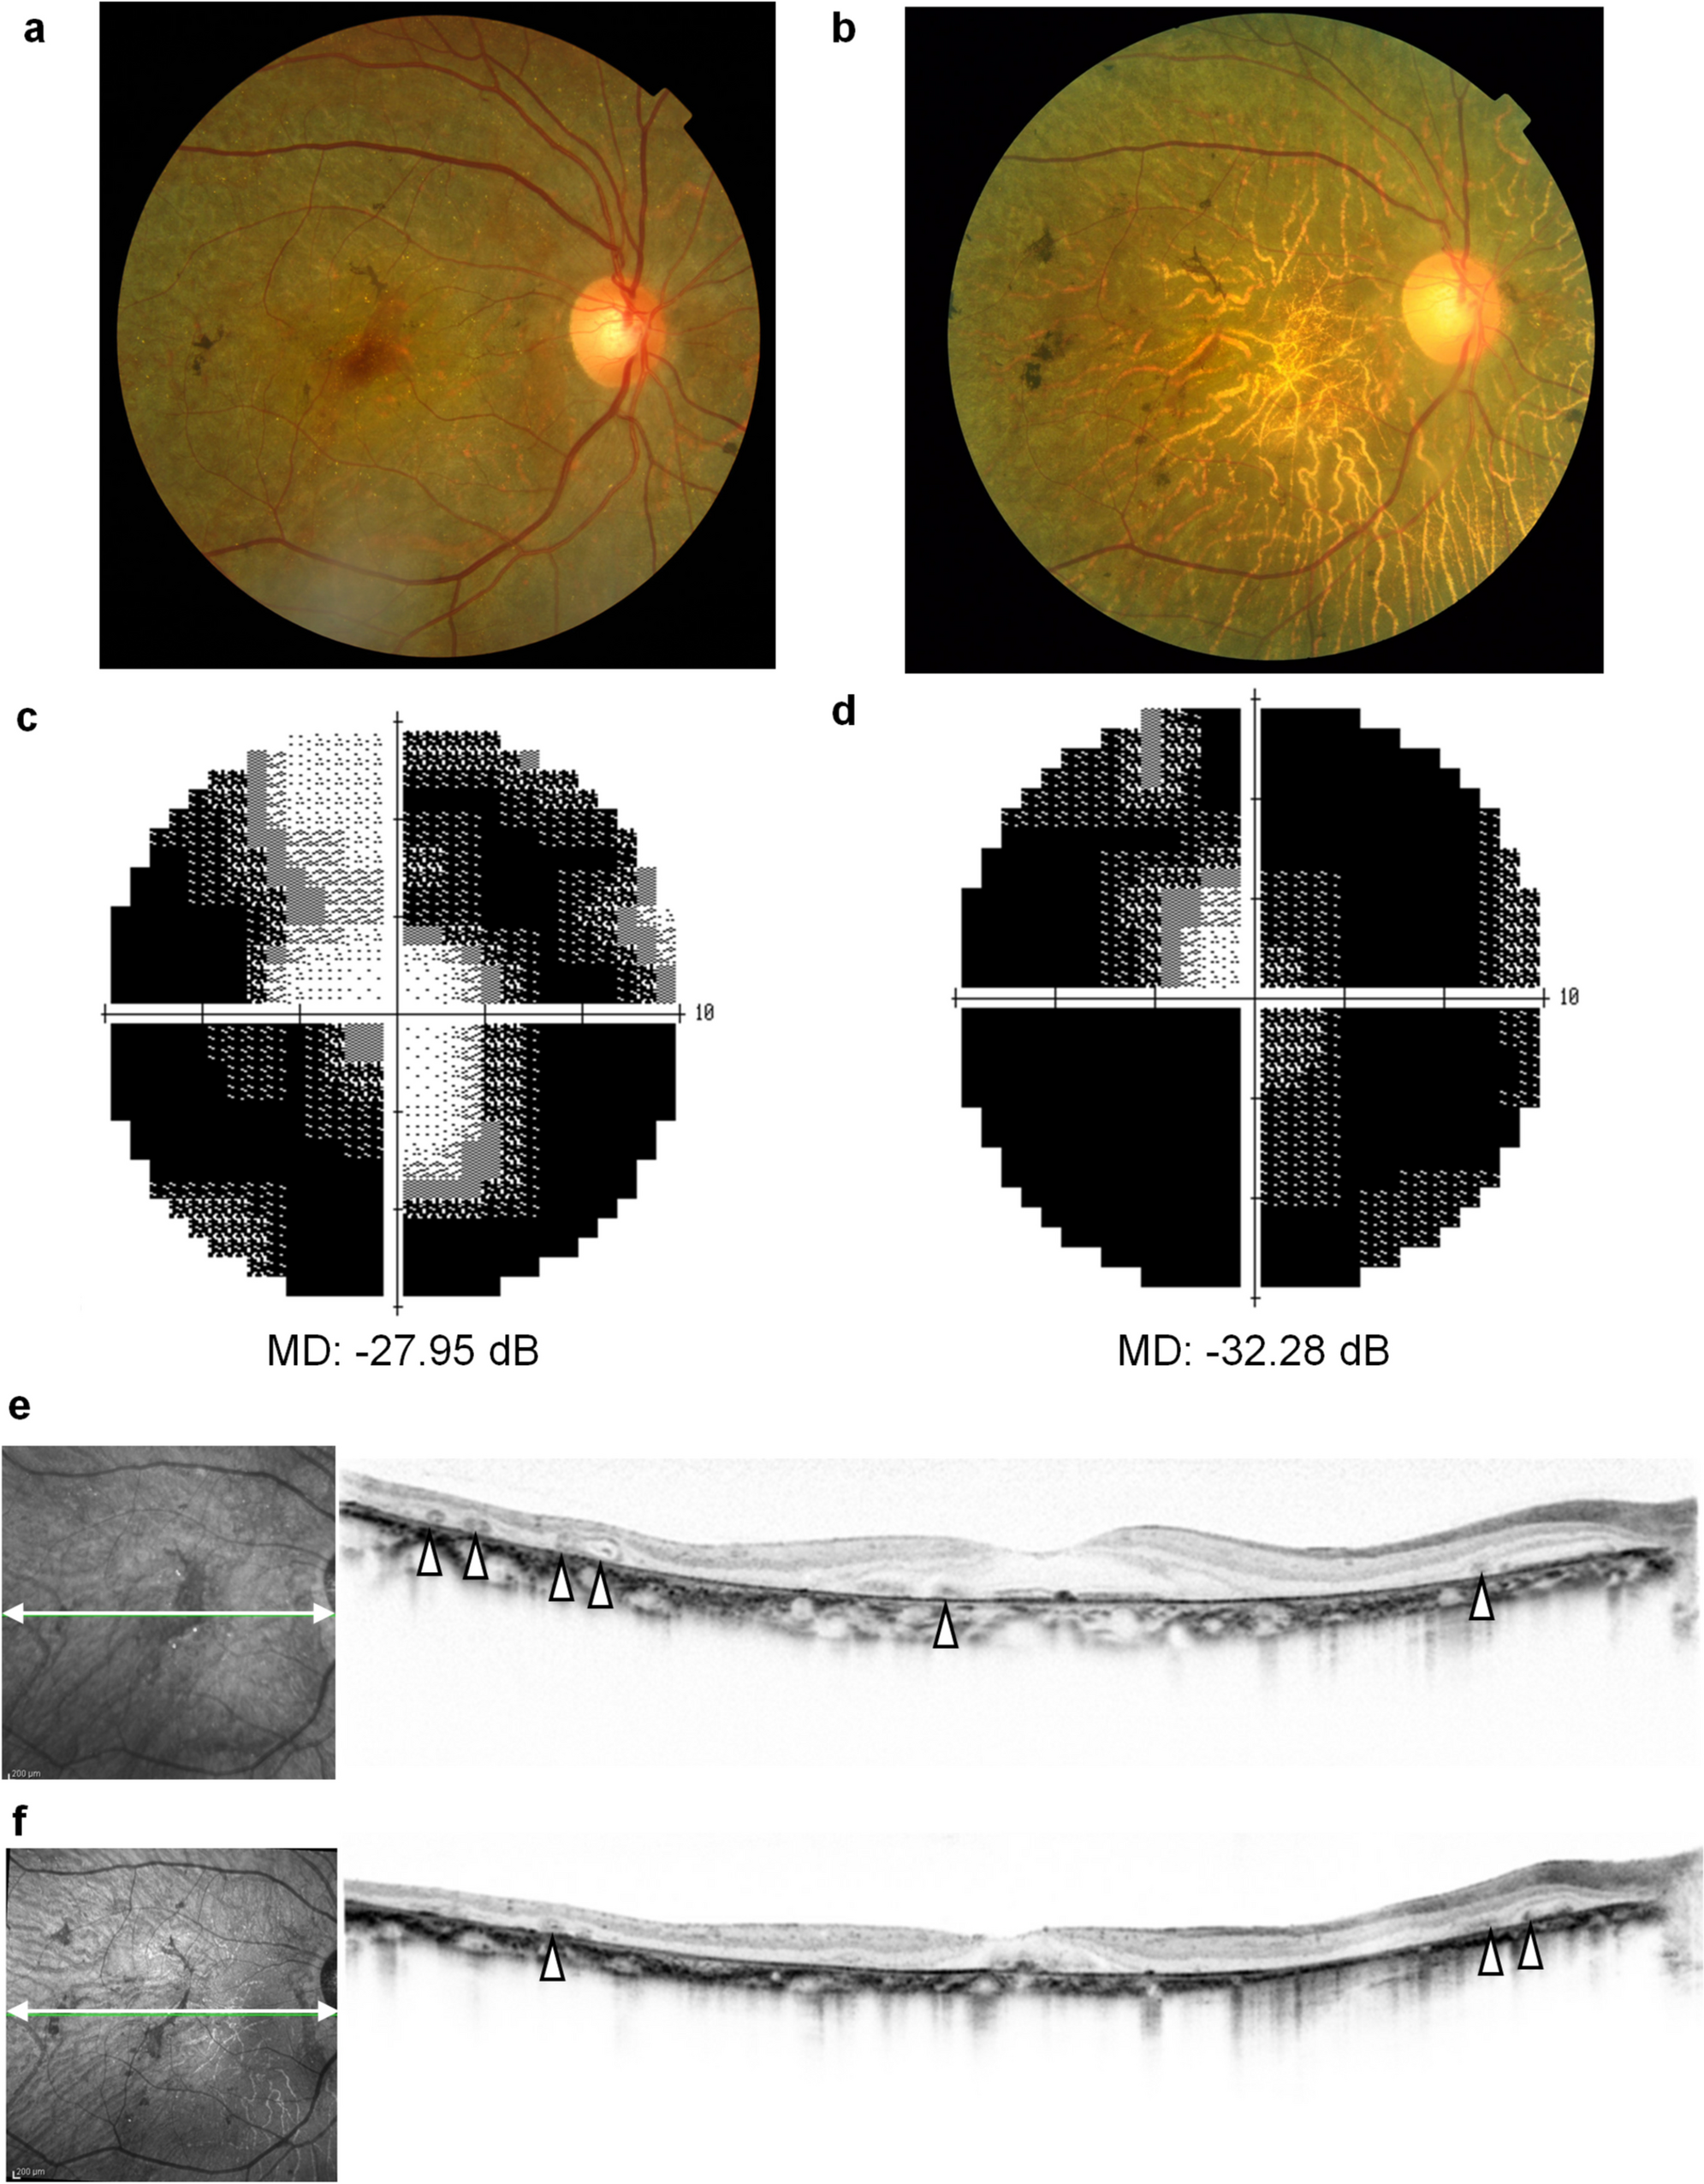
Table 1 Characteristics of the patients and eyes at time of data acquisitionTable 2 MD slope during the follow-up periodFigure 1 presents the fundus photographs, results of the HFA10-2 visual field test, and OCT images of a typical patient with BCD acquired at the first visit and 14 years later. Retinal degeneration continued to progress, and the degenerative area expanded during the 14-year observation period. The number of yellow-white crystals at the fundus observed at baseline had decreased after 14 years (Fig. 1a and 1b). The findings of the HFA10-2 visual field test revealed the progression of visual field loss from −27.95 to −32.28 dB in the MD value over a period of 14 years (Fig. 1c and 1d). The calculated MD slope was −0.43 dB/year. The OCT images revealed degeneration of the RPE. Round-shaped structures, namely tubulations, were observed in the ONL at baseline (arrowheads in Fig. 1e). Thinning of the outer retinal layers, particularly in regions further from the fovea, had progressed, and the number of tubulations had decreased after 14 years (Fig. 1f). Figure 2 presents a typical example of the natural course of the number of tubulations, MD value, and retinal volume. The MD value deteriorated gradually, and the test was discontinued midway as the sensitivity was near 0 dB at almost all test points in the HFA 10–2 test. The number of tubulations increased over time, remained high for a period, then decreased gradually. The retinal volume started decreasing from the outer region and decreased in the central region during the latter half of the observation period. The number of tubulations was higher during the period when the outer and inner retinal volumes were decreasing. Therefore, we investigated the relationship between the number of tubulations and MD values as well as the retinal volume.
Fig. 1
Progression of Bietti crystalline dystrophy. (a) and (b) Fundus photographs of a patient with Bietti crystalline dystrophy (BCD). (c) and (d) Humphrey visual field test results with the 10–2 program and the mean deviation (MD) values. dB: decibel. (e) and (f) Horizontal images of optical coherence tomography acquired at the first visit (a, c, e, when the patient was in her 50 s) and 14 years later (b, d, f, when the patient was in her 60 s). The arrowheads in (e) indicate tubulations in the outer nuclear layer
Fig. 2
Natural course of Bietti crystalline dystrophy. The X-axis shows the year since the first visit (when the patient was in his 60 s). The Y-axis shows the mean deviation (MD) values for the Humphrey visual field test with the 10–2 program, tubulation number, retinal outer volume, retinal inner volume, and retinal center volume (see Supplemental Fig. S1). dB: decibel
Correlations between the number of tubulations and other parametersFirst, we examined the distribution of tubulations across different regions. The analysis revealed that the number and proportion of tubulations were higher in the center and outer regions of the ETDRS grid (Fig. 3a, c). However, given the differences in the area of each region, area-adjusted results showed that the number and proportion of tubulations were highest in the center region of the ETDRS grid, with no significant difference between the inner and outer regions (Fig. 3b, d). Additionally, there were no notable differences in the distribution of tubulations among the temporal, inferior, nasal, and superior quadrants.
Fig. 3
Analysis of tubulation distribution. The number of tubulations (a), number of tubulations normalized by area (tubulations per unit area) (b), proportion of regions containing tubulations (c), and proportion of regions containing tubulations normalized by area (area-adjusted tubulation proportion) (d) are shown. Each region within and outside the Early Treatment Diabetic Retinopathy Study (ETDRS) grid is shown in Supplementary Fig. S1
The number of tubulations showed a negative correlation with the MD values (Fig. 4a, P = 0.055, r = −0.33). In contrast, the number of tubulations did not show any clear correlations with the MD slope or logMAR (Fig. 4b, P = 0.48, r = 0.15, Fig. 4c, P = 0.68, r = −0.07). The number of tubulations tended to increase as the retinal outer volume decreased; however, no significant correlation was observed (Fig. 4d, P = 0.46, r = −0.13). Similarly, the number of tubulations did not show any clear correlations with the retinal inner volume or the retinal center volume (Fig. 4e, P = 0.76, r = 0.05, Fig. 4f, P = 0.47, r = 0.12).
Fig. 4
Correlations between the number of tubulations and visual field data and retinal volume. (a) Scatterplots and linear regression of the number of tubulations with the mean deviation (MD) value of Humphrey field analyzer 10–2 (a, N = 34, P = 0.055, r = −0.33), MD slope (b, N = 25, P = 0.48, r = 0.15), logarithmic minimum angle of resolution (logMAR) (c, N = 37, P = 0.68, r = −0.07), retinal outer volume (d, N = 37, P = 0.46, r = −0.13), retinal inner volume (e, N = 37, P = 0.76, r = 0.05), and retinal center volume (f, N = 37, P = 0.47, r = 0.12)
Next, the disease stage was evaluated and the number of tubulations was compared among the stages (Table 3); there were no differences among the stages (P = 0.29).
Table 3 Staging by fundus autofluorescence and number of tubulationsCorrelations between the prevalence of tubulation and other parametersWe calculated the median values of the MD value, MD slope, logMAR, retinal outer volume, retinal inner volume, and retinal center volume (Tables 1 and 2) and categorized the corresponding data into two groups: those with values smaller than the median and those with values equal to or greater than the median. The mean number of tubulations in the eyes with an MD value of less than −28.56 dB (median value of the included eyes) was 2.6 ± 2.7, which was higher than that in the eyes with an MD value of −28.56 dB or greater (2.0 ± 2.2; P = 0.48); however, the difference was not statistically significant. Similarly, comparison of the proportion of eyes with and without tubulations between the two groups revealed that the proportion of eyes with tubulations in the group with poorer MD values was higher than that in the group with better MD values; however, the difference was not statistically significant (Fig. 5a, 0.82 vs. 0.71, P = 0.42). The mean number of tubulations in the eyes with an MD slope poorer than −0.60 dB/year was 2.8 ± 3.2, which was higher than that in the eyes with an MD slope of −0.60 dB/year or better (2.0 ± 2.2; P = 0.58). Comparison of the proportion of eyes with and without tubulations between the two groups revealed that the proportion of eyes with tubulations in the group with the poorer MD slope was not significantly different from that in the group with a better MD slope (Fig. 5b, 0.75 vs. 0.69, P = 0.75). The mean number of tubulations in the eyes with a logMAR value of < 0.10 was 2.1 ± 2.6, which was smaller than that in the group with a higher logMAR value (2.5 ± 2.3; P = 0.32). The proportion of eyes with tabulations in the group with a higher logMAR value was also higher than that in the group with a lower logMAR value (Fig. 5c, 0.60 vs. 0.87, P = 0.068).
Fig. 5
Relationship between the presence or absence of tubulations and visual field data and retinal volume. Mean deviation (MD), MD slope, logarithmic minimum angle of resolution (logMAR), retinal outer volume, retinal inner volume, and retinal center volume data are categorized into two groups: those with values smaller than the median and those with values equal to or greater than the median. Chi-squared tests were performed to evaluate the proportion of tubulation present in each group of MD value of Humphrey visual field analyzer 10–2 (a, N = 34 eyes, P = 0.42), MD slope (b, N = 25 eyes, P = 0.75), logMAR (c, N = 37, P = 0.068), retinal outer volume (d, N = 37 eyes, P = 0.85), retinal inner volume (e, N = 37 eyes, P = 0.44), retinal center volume (f, N = 37 eyes, P = 0.054). (g) Comparison of the proportion of tubulation presence between Stages 2 and 3 [6]. Dotted boxes: eyes without tubulation, gray boxes: eyes with tubulation
The mean number of tubulations in the eyes with a retinal outer volume of < 1.46 mm3 and ≥ 1.46 mm3 was 2.4 ± 2.8 and 2.3 ± 2.1, respectively (P = 0.78). The proportion of eyes with tubulations in the group with a smaller retinal outer volume was almost identical to that in the group with a larger retinal outer volume (Fig. 5d, 0.76 vs. 0.74, P = 0.85). The mean number of tubulations in the eyes with a retinal inner volume of < 0.49 mm3 and > 0.49 mm3 did not differ significantly (2.2 ± 2.1 vs. 2.4 ± 2.6, respectively, P = 0.96). Comparison of the proportion of eyes with and without tubulations between the two groups revealed that the proportion of eyes with tubulations in the group with a smaller retinal inner volume did not differ significantly from that in the group with a larger retinal inner volume (Fig. 5e, 0.69 vs. 0.80, P = 0.44). In contrast, the mean number of tubulations in the eyes with a retinal center volume of < 0.24 mm3 and ≥ 0.24 mm3 was 1.8 ± 2.0 and 2.8 ± 2.6, respectively; however, the difference was not statistically significant (P = 0.15). Similarly, comparison of the proportion of eyes with and without tubulations between the two groups revealed that the proportion of eyes with tubulations in the group with a smaller retinal center volume was lower than that in the group with a larger retinal center volume (Fig. 5f, 0.61 vs. 0.89, P = 0.054).
The mean number of tubulations in the eyes at stage 3A and 3B (severe stages) was 2.6 ± 2.2, which was higher than that in the eyes at stage 2A and 2B (1.7 ± 2.4; P = 0.30). Comparison of the proportion of eyes with and without tubulations between the two stages revealed that the proportion of eyes with tubulations in stage 3 was higher than that in stage 2, though there was no statistical difference (Fig. 5g, 0.81 vs. 0.60, P = 0.18).
Table 4 presents the mean values of each parameter in the eyes with and without tubulations. The mean of the MD values in the eyes with and without tubulations was −27.9 ± 4.9 dB and −15.8 ± 13.3 dB, respectively (P = 0.059).
Table 4 Mean values of the parameters of the eyes with and without tubulationMultivariate analysis of tubulation numbersMultivariate analysis performed using MD values, logMAR values, and the retinal center volume as potential factors that may be associated with the number of tubulations revealed that MD values had a significant impact on the number of tubulations (Table 5).
Table 5 Factors affecting the number of tubulation
留言 (0)