
記住我


Baseline patient characteristics, medical history and cardiovascular risk factors are summarized in Table 1.
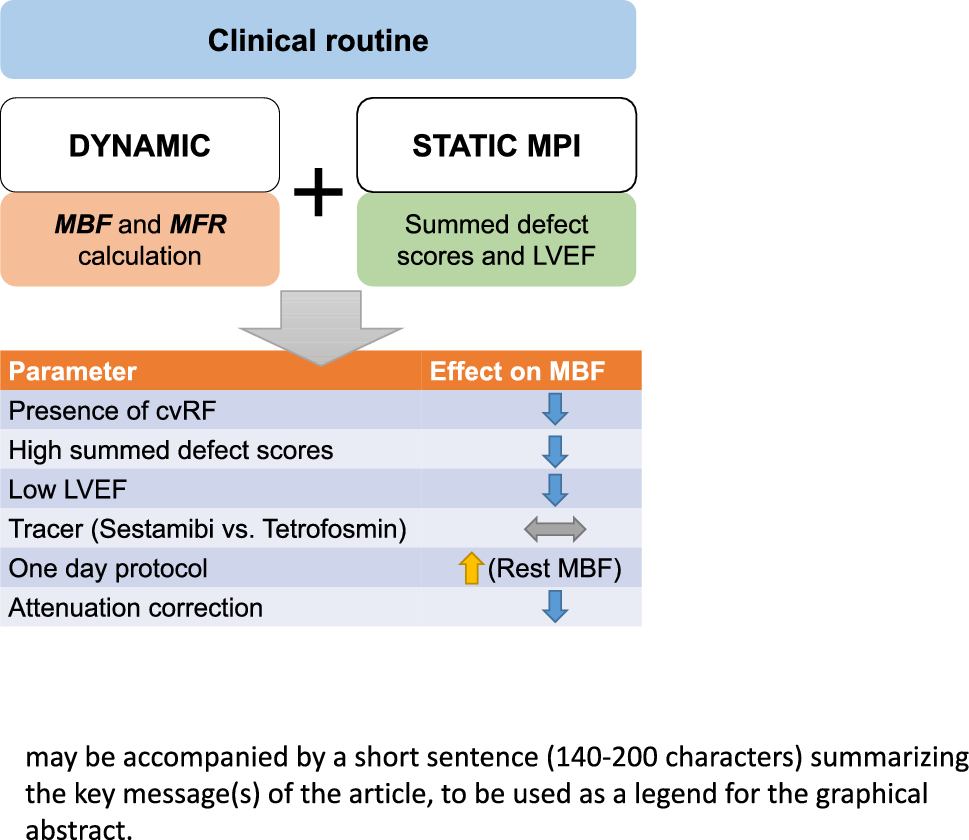
Table 1 Baseline characteristics and static SPECT resultsGlobal stress MBF was significantly higher than rest MBF (stress MBF 2.3 ± 1.1 ml/min/g vs. rest MBF 1.1 ± 0.5 ml/min/g; p < 0.001, all patients). A high interindividual variance was detected. Global stress MBF ranged from 0.4 to 7.4 ml/min/g and rest MBF ranged from 0.3 to 3.7 ml/min/g. Mean calculated global MFR was 2.1 ± 1.1 (range 0.5–7.8). Correcting global rest MBF for rate pressure product (RPP) did not have significant impact on calculated MBF (1.1 ± 0.5 vs. 1.2 ± 0.6 ml/min/g, p = 0.221) and MFR (2.1 ± 1.1 vs. 1.9 ± 0.9 p = 0.302) in this cohort.
Regional MBF was determined for coronary territories and results are summarized in Table 2. Highest mean MBF and highest variance was detected in the right coronary territory. Men presented with lower stress MBF and a tendency towards lower MFR in comparison to females (2.0 ± 0.8 ml/min/g vs. 2.9 ± 1.2 ml/min/g, p < 0.001 and 1.9 ± 1.0 vs. 2.4 ± 1.4, p = 0.054) while rest MBF was similar (1.1 ± 0.5 ml/min/g vs. 1.2 ± 0.5 ml/min/g, p = 0.200).
Table 2 Global and regional MBFMBF and MFR are comparable for Tc-99 m-sestamibi and Tc-99 m-tetrofosminA total of 85 patients underwent a one-day protocol and 79 patients performed a two-day protocol. 41/85 one-day protocols and 32/79 two-day protocols were performed using Tc-99 m-tetrofosmin. 58 patients underwent rest-only studies of which 23 were performed with Tc-99 m-tetrofosmin. 19/58 stress-only studies were performed with Tc-99 m-tetrofosmin.
Global stress MBF was significantly higher when Tc-99 m-sestamibi was used (2.4 ± 1.1 ml/min/g vs. 2.1 ± 0.9 ml/min/g; p = 0.049). This was also true in a regional MBF analysis for the LAD (2.6 ± 1.2 ml/min/g vs. 2.2 ± 1.0 ml/min/g; p = 0.031) and RCA (3.0 ± 1.3 ml/min/g vs. 2.7 ± 1.1 ml/min/g; p = 0.049) territory (Table 3). No significant differences were detected for calculated global rest MBF (1.1 ± 0.4 ml/min/g vs. 1.1 ± 0.6 ml/min/g, p = 0.259) or MFR (2.2 ± 1.3 ml/min/g vs. 1.9 ± 1.0 ml/min/g; p = 0.109).
Table 3 Global and regional MBF Sestamibi vs. TetrofosminAdditionally, 30 stress-only patients (15 Tc-99 m-sestamibi and 15 Tc-99 m-tetrofosmin) without known cardiovascular comorbidities and without perfusion defects on static scans were compared in a subanalysis. Here, no relevant differences in global (3.1 ± 1.2 ml/min/g vs. 2.8 ± 0.9 ml/min/g; p = 0.429) or regional stress MBF were detected.
One-day stress first protocol yields higher global rest MBFPatients who underwent either a one-day or a two-day stress-first protocol showed no differences in stress MBF. Significantly higher rest MBF values were calculated when a one day protocol was used (1.2 ± 0.5 ml/min/g vs. 1.0 ± 0.46 ml/min/g; p = 0.009, Fig. 3). Consequently MFR was lower in patients that underwent one day protocols (MFR NC 1.9 ± 1.0 ml/min/g vs. 2.2 ± 1.3 ml/min/g; p = 0.035; Fig. 3). This effect was not observed, when AC was used. A separate analysis for Tc-99 m-sestamibi and Tc-99 m-tetrofosmin showed that the global observation was driven by Tc-99 m-tetrofosmin scans (one day protocoll 1.4 ± 0.7 ml/min/g vs. two day protocol 1.0 ± 0.5 ml/min/g; p = 0.014) while in Tc-99 m-sestamibi scans no differences based on protocol use were detected (1.1 ± 0.4 ml/min/g vs. 1.0 ± 0.47 ml/min/g; p = 0.338).
Fig. 3
In Tc-99 m-tetrofosmin scans rest global myocardial blood flow (MBF) was significantly lower when a two day protocol was used. Consecutively, myocardial flow reserve (MFR) was higher when a two day protocol was used. Significant differences were not detectable when Tc-99 m-sestamibi was used or after attenuation correction (AC)
Use of attenuation correction lowers calculated MBFMean global stress and rest MBF were significantly lower when AC was used (NC 2.3 ± 1.1 ml/min/g vs. AC 1.8 ± 0.8 ml/min/g; p < 0.001; NC 1.1 ± 0.5 ml/min/g vs. AC 0.9 ± 0.4 ml/min/g; p < 0.001, Fig. 4). Similar results were found for the regional analysis. However, there were no significant differences in the calculated MFR (NC 2.1 ± 1.1 ml/min/g vs. AC 2.1 ± 1.1 ml/min/g; p = 0.626). This finding aligns with the expectation that AC affects both stress and rest values proportionately, thereby preserving the calculated MFR. A patient example for calculation of global and regional stress MBF and effect of AC s given in Fig. 5.
Fig. 4
Use of attenuation correction (AC) systematically and significantly lowered the measured global myocardial blood flow (MBF) at stress and rest. No effect on myocardial flow reserve (MFR) was detected
Fig. 5
Patient example of a dynamic stress study analyzed in Corridor 4DM reserve software. Given are from left to right: Time-activity curves without and with attenuation correction (AC), perfusion polar maps, flow polar maps and calculated regional absolute quantitative flow measures (ml/min/g)
Presence of perfusion defects in standard static scans is associated with lower global and regional MBFRelevant perfusion defects were defined as three or more segments with reduced perfusion in one coronary territory based on the 17-segments-AHA model, results of standard static scans are presented in Table 1. Presence of perfusion defects in static scans were associated with lower global stress and rest MBF (no defect: 2.6 ± 1.1 ml/min/g vs. defect 1.7 ± 0.7 ml/min/g; p < 0.001 and no defect 1.2 ± 0.5 ml/min/g vs. defect: 1.0 ± 0.4 ml/min/g; p < 0.001; Fig. 6). However, there were no significant differences for MFR between patients with and without defects in static scans (no defect p = 0.143; defect p = 0.234). Analogue results were found for AC MBF and MFR measures and for regional analysis.
Fig. 6
Presence of perfusion defects in standard static scans systematically lead to significantly lower global myocardial blood flow (MBF) at stress and rest in both non-attenuation (NC) and attenuation corrected (AC) flow measures
Summed defect scores derived from standard static scans correlate with global MBFSignificant correlations between summed stress scores (SSS) and global stress MBF as well as summed rest scores (SRS) and global rest MBF were found (Fig. 7). However, no significant correlation was detected between summed difference scores (SDS = SSS-SRS) and MFR NC (r = 0.05, p = 0.556). Analogue correlations were calculated when AC was used.
Fig. 7
Significant inverse correlations were detected between (A) global stress myocardial blood flow (MBF) and summed stress scores (SSS) and (B) global rest MBF and summed stress scores (SRS). (C) No significant correlation was detected between global myocardial flow reserve (MFR) and summed difference scores (SDS)
Lower LVEF is associated with lower MBFMean stress left ventricular ejection fraction (LVEF) was 58.8% and rest LVEF was 54.2%. Higher stress (r = 0.52, p < 0.001) and rest LVEF (r = 0.28, p < 0.001) correlated significantly with higher MBF measures (Fig. 8).
Fig. 8
Significant correlations between (A) stress myocardial blood flow (MBF) and stress left ventricular ejection fraction (LVEF) and (B) rest MBF and rest LVEF were detected. Myocardial flow reserve (MFR) tended to correlate stress LVEF (C) and significantly correlated with rest LVEF (D)
No significant correlation was detected between stress or rest LVEF and MFR.
Influence of cardiovascular comorbidities on MBFPatients with known coronary artery disease (CAD) had a significantly lower global stress (1.9 ± 0.9 ml/min/g vs. 2.6 ± 1.1 ml/min/g, p < 0.001) and rest MBF (1.0 ± 0.4 ml/min/g vs. 1.3 ± 0.6 ml/min/g, p = 0.002) than patients without known CAD (Fig. 9). No significant reduction of MFR was seen in patients with history of CAD (p = 0.283). Stress MBF gradually declined the more vessels were known to be affected from CAD (Fig. 10), while rest MBF and MFR were not impacted.
Fig. 9
Patients with known coronary artery disease (CAD) had significantly lower global myocardial blood flow (MBF) at stress and rest in both non-attenuation (NC) and attenuation corrected (AC) flow measures. No significant reduction of myocardial flow reserve (MFR) was found
Fig. 10
ANOVA comparisons of (A) stress myocardial blood flow (MBF), (B) rest MBF and (C) myocardial flow reserve (MFR) in patients without coronary artery disease (CAD), one-vessel disease (1 VD), two-vessel disease (2 VD) and three-vessel disease (3 VD). Significant differences between groups were only found under stress conditions, no relevant reduction of rest MBF or MFR was observed
Presence of cardiovascular risk factors (i.e. CAD, MI, hypertension, diabetes, obesity or smoking) lead to a significant reduction of calculated MBF. Patients with two or more known cardiovascular risk factors had significantly lower MBF than patients with less or without cardiovascular risk factors (global stress MBF: 2.1 ± 1.0 ml/min/g vs. 2.7 ± 1.0 ml/min/g, p < 0.001; global rest MBF: 1.0 ± 0.4 ml/min/g vs. 1.4 ± 0.6 ml/min/g, p = 0.004). For MFR, no significant difference was found (2.1 ± 1.2 ml/min/g vs. 1.8 ± 0.7 ml/min/g, p = 0.124).
留言 (0)