
記住我
We searched published literature from the PubMed database using a combination of the search terms, “Glomerular Filtration Rate”[Mesh], “glomerular filtration rate,” “estimation equation*,” “creatinine-based equation*,” and “cystatin-based equation*” along with the Boolean operators from 15th January 1996 to 25th January 2024. We excluded commentaries and conference abstracts. Alongside, we performed forward and backward citation searches on published original articles and reviews.
Assessment of GFRMeasuring true GFR directly in humans is not practical [7]. Instead, it is estimated using clearance measurements or serum levels of filtration markers, which consist of exogenous or endogenous solutes mostly cleared by glomerular filtration [8].
Urinary clearance quantifies marker excretion relative to its plasma concentration, while plasma clearance assesses how effectively a marker is cleared from the blood stream over a period, taking into account its plasma concentration. In certain situations, urinary or plasma clearance of the exogenous marker has been used as the gold standard method to measure kidney function.
Inulin, radioactive or non-radioactive iothalamate, iohexol, diethylenetriamine pentaacetate (DTPA), and ethylenediaminetetraacetic acid (EDTA) have been used to measure GFR [9].
However, due to the constraints presented by the complex, time-consuming, and burdensome nature of directly measured GFR, it has become a routine practice in numerous clinical settings to estimate GFR using blood levels of endogenous markers [8]. Serum creatinine (SCr) and serum cystatin C are the most commonly used endogenous filtration markers.
CreatinineCreatinine (Cr) has been the predominant biomarker for GFR estimation due to its global availability, standardized assays, and cost-effectiveness [10].
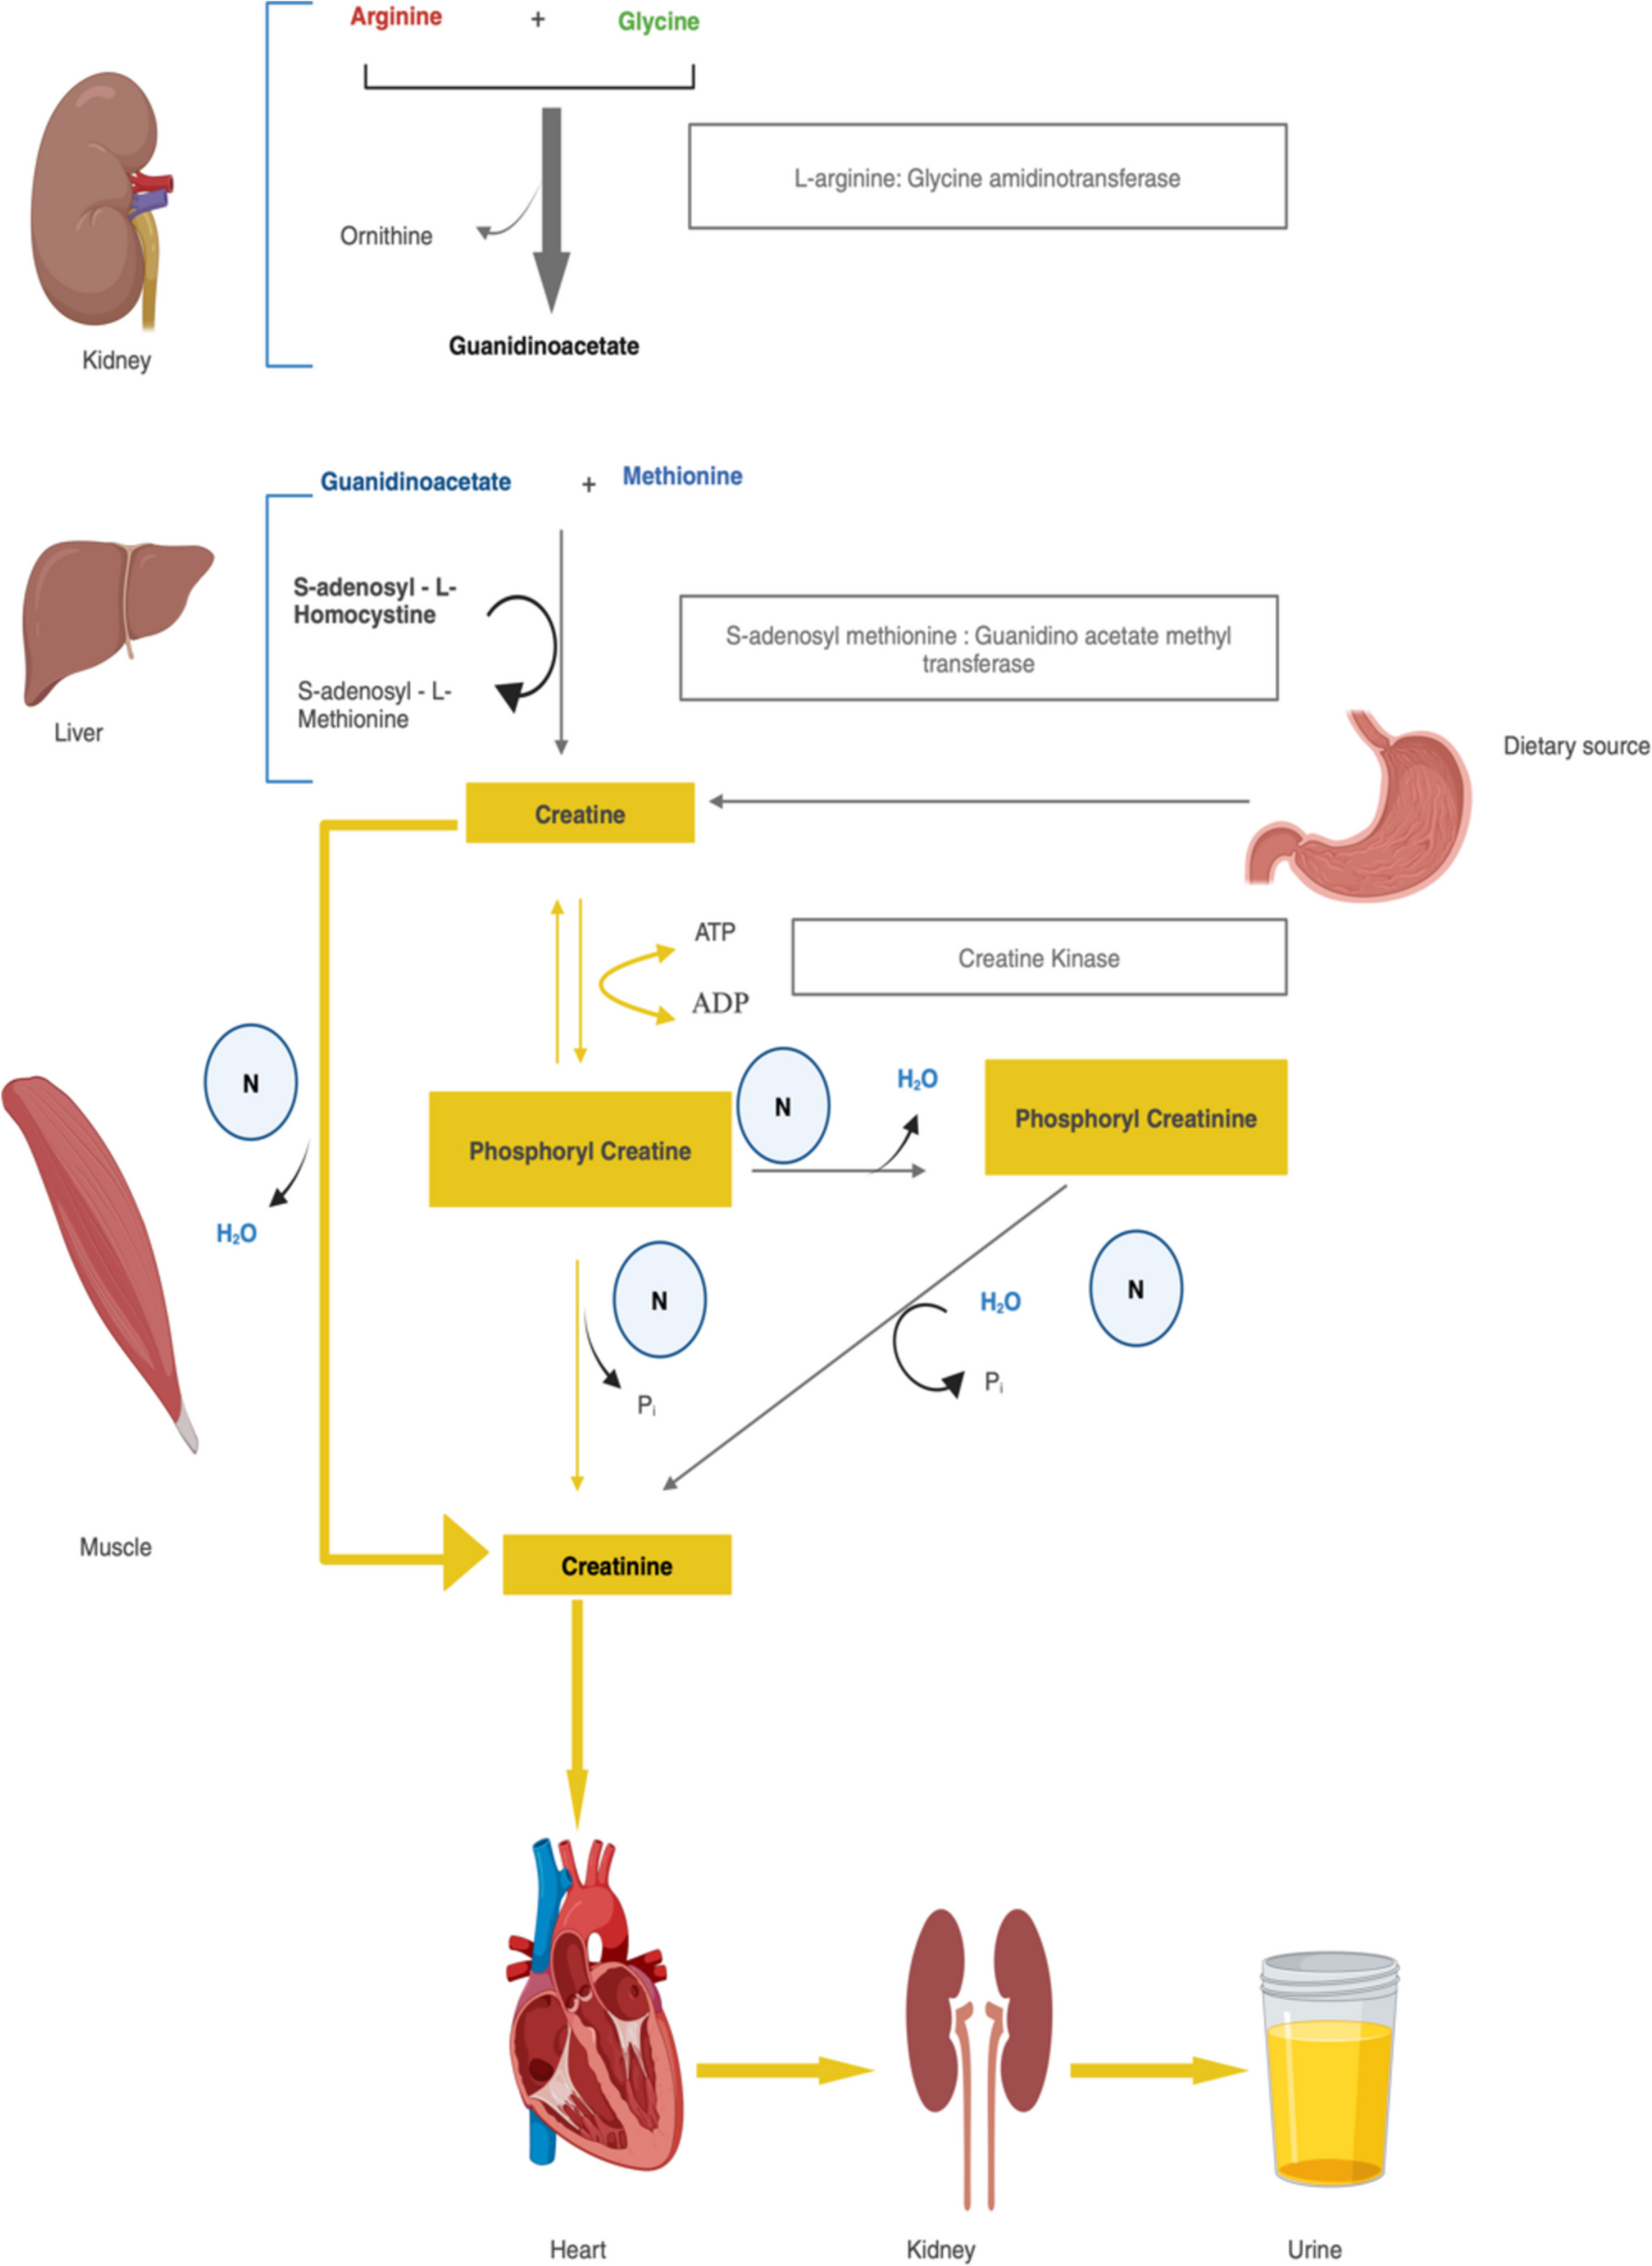
It is a non-protein nitrogenous waste product generated from the metabolism of creatine and creatine phosphate in muscle tissue [11]. Creatine can be obtained directly from the diet, particularly from meat and fish, where it is absorbed in the small intestine and transported to various tissues via the blood stream [12]. Endogenously, creatine is synthesized in the body from the amino acids arginine, glycine, and methionine [12]. In the kidneys, arginine and glycine react to form guanidinoacetate. Guanidinoacetate is then transported to the liver, where it is methylated to form creatine. Creatine synthesized in the liver or obtained from the diet is transported through the blood stream to muscle cells, where about 95% of the body’s creatine is stored. In muscle cells, creatine is phosphorylated to form creatine phosphate (phosphocreatine), which serves as a quick reserve of high-energy phosphates to regenerate ATP during periods of high energy demand. Creatine and creatine phosphate are continually converted to creatinine at a constant rate through a non-enzymatic, spontaneous process, where the phosphate is removed as inorganic phosphate [12].
The bulk of creatinine production takes place in muscle tissue, consequently, an individual’s muscle mass significantly impacts the concentration of SCr [12].
It is consistently released into the blood stream at a steady pace and is cleared by the kidney mainly by glomerular filtration and to some extent by tubular secretion. Increasing tubular secretion with falling GFR keeps SCr levels within range till approximately 50% fall making this not an ideal marker in early CKD [12]. This metabolic pathway is illustrated in Fig. 1.
Fig. 1
Metabolism of creatinine (created with BioRender.com). H2O, water; N, non enzymatic; Pi, inorganic phosphate
Mean SCr levels vary between males and females, attributed to variances in muscle mass as well as other non-GFR determinants of SCr [13,14,15]. The accuracy of eGFR derived from any creatinine-based equations may be less in individuals with significant non-GFR determinants impacting Scr levels. These determinants include variations in muscle mass due to conditions like sarcopenia, cachexia, obesity, malnutrition, and muscular dystrophy, creatine/creatinine intake, specific patient demographics such as children or those with cirrhosis, chronic heart failure, amputations, or neuromuscular diseases, as well as dietary patterns like high-protein or vegetarian diets [16]. In addition, methods for measuring Scr vary and may result in values not being comparable between laboratories. The enzymatic and Jaffe methods represent two colorimetric techniques employed for SCr measurement. Isotope dilution mass spectrometry (IDMS) and high-performance liquid chromatography (HPLC) are utilized as reference standards for SCr measurement. Clinical laboratories commonly employ automated chemical or enzymatic methods for creatinine measurement [16]. The prevalent Jaffe-based creatinine-picrate method, while widely used, is susceptible to interference from factors such as picric acid concentration, pH, wavelength, temperature, and other substances like bilirubin, glucose, protein, aceto-acetate, and cephalosporin. Consequently, this method tends to overestimate creatinine levels by 15–25%. Despite attempts to correct for interference through compensation methods, variability in patient samples limits its effectiveness. Enzymatic methods offer enhanced specificity by preventing interference from non-creatinine compounds but are hindered by higher costs. There is a trend towards normalization of methods to the standard accepted isotope dilution mass spectrometry (IDMS). The National Kidney Disease Education Program (NKDEP) released recommendations for IDMS traceability and standardization of creatinine methods to various stakeholders, including clinical laboratories. IDMS traceability refers to the calibration of the creatinine method utilized (such as enzymatic or the Jaffe method) being traceable to a reference measurement procedure based on IDMS [17,18,19]. This calibration method ensures accuracy and standardization in creatinine measurements, which is particularly crucial in pediatric populations where creatinine concentrations can vary significantly [20]. Studies have indicated differences in measurements between commercial assays for creatinine, whether Jaffe or enzymatic, underscoring the importance of IDMS traceability to maintain consistency [21]. Implementing IDMS traceable assays can help minimize biases in creatinine measurements, particularly when estimating GFR for clinical purposes, such as in staging chronic kidney disease (CKD).
Cystatin CCystatin C, a member of the cystatin superfamily of cysteine protease inhibitors, is a low-molecular-weight protein that undergoes glomerular filtration without reabsorption but is metabolized in the tubules, precluding direct clearance measurement [22]. Like creatinine, serum cystatin C levels are influenced by various non-GFR factors, such as male sex, greater height and weight, higher lean body mass, increased fat mass, diabetes, elevated inflammatory markers like C-reactive protein, thyroid disorders, and glucocorticoid usage. Increasing age and race also impact cystatin C levels, albeit to a lesser extent than creatinine [23,24,25,26,27,28,29,30,31]. Hence, GFR estimates incorporating cystatin C should consider these non-GFR determinants.
Estimation equations for assessing kidney functionTo date, there are over 50 different equations in the literature with the most widely used ones being reviewed here.
Estimation equations use mathematical formulas used to evaluate kidney function [32]. In clinical practice, GFR is often estimated using these equations, which include biological biomarkers and demographic variables like sex, age, and sometimes weight, height, and/or ethnicity [33].
The equations convert serum concentration of a filtration marker into an approximation of GFR, often incorporating additional demographic factors. This is particularly relevant as the markers are influenced by these variables.
Evolution of estimation equationsEstimation equations of kidney function have undergone significant evolution over the years marked by significant milestones as depicted in Fig. 2. The initial approaches primarily relied on cumbersome and invasive methods, such as the clearance of exogenous filtration markers [34]. In 1957, Effersoe proposed the first equation for estimating creatinine clearance (CrCl), laying the groundwork for subsequent advancements [6, 35]. In 1976, the introduction of the Cockcroft-Gault equation, based on SCr and patient demographics, marked a significant advancement [36]. Subsequently, the Modification of Diet in Renal Disease (MDRD) equation emerged in 1999, using six variables which was later modified to four variables incorporating SCr, age, ethnicity, and gender. In 2009, the Chronic Kidney Disease Epidemiology Collaboration (CKD-EPI) equation showed improved performance at higher GFR levels, offering enhanced accuracy compared to its predecessor [2]. The Lund-Malmö Study equation, also known as the Lund-Malmö revised (LMR) equation, was developed in 2011 with the explicit goal of improving the accuracy of eGFR. In 2012, the CKD-EPI equation evolved further, integrating cystatin C as an additional filtration marker. The year 2021 saw the advent of a race-free eGFR equation, addressing potential inaccuracies associated with race. The evolution of these equations has shaped the way we estimate GFR, providing more convenient and reliable tools for kidney function assessment.
Fig. 2
Evolution of estimation equations (created with BioRender.com)
Equations for creatinine clearance (CrCl)Jelliffe’s Eq. (1971)Jelliffe’s equation was developed in 1971 by Dr. Roger W. Jelliffe to estimate CrCl in 15 transplant patients [37,38,39]. This equation (Table 1) incorporates age, weight, and SCr levels to estimate CrCl. It is a relatively simple formula and has been widely used in clinical practice for decades. Despite its widespread use, this equation has limitations. It was validated to assess CrCl in a non-steady state as in critically ill patients [37]. It may not be as accurate as other equations, particularly in certain patient populations. Additionally, the equation may need to be adjusted for specific clinical conditions or patient characteristics. Adjustment may be necessary for patients with muscle mass significantly above or below normal, such as very muscular patients, cirrhotic patients, those with AIDS, or very obese patients, to prevent overestimation or underestimation of creatinine clearance.
Table 1 Equations for estimating CrCL and GFRKampmann’s Eq. (1974)Kampmann and colleagues conducted a study involving 368 hospitalized patients who did not have any known renal disease but had various other medical conditions [40]. These patients were categorized into different age groups based of 10-year spans [40]. The researchers measured 24-h endogenous CrCl, SCr, urinary creatinine excretion, body weight, and height. The researchers measured urinary creatinine in three consecutive 24-h samples and used the mean value as presented in Table 1 [40]. Limitations of this study were that it included only hospitalized patients who did not have a known renal disease, thus restricting the generalizability. The paper does not provide detailed information regarding the specific methods utilized to measure CrCl, SCr, and urinary creatinine excretion. Consequently, the accuracy and reliability of the results may be affected. Additionally, the study does not explore the impact of other factors, such as comorbidities or medication use, on CrCl and SCr levels. Furthermore, the authors emphasize the risk of overestimating GFR when relying solely on SCr as a parameter for assessing renal function.
Rowe’s Eq. (1976)The study aimed to establish age-adjusted standards for CrCl, an important indicator of kidney function. Rowe et al. conducted standard 24-h CrCl measurements on 884 adult male subjects aged 17 to 96 [41]. They were community-dwelling and highly educated without evidence of renal or other diseases. The study found a significant decline in CrCl with advancing age. Using linear regression analysis, a nomogram was developed to determine an individual’s age-adjusted percentile rank in CrCl [41]. The Rowes equation for CrCl in males uses only age as the factor and is depicted in Table 1, whereas for females, 0.93 must be multiplied to the equation for males (Table 1). This equation was solely based on age, which may not accurately reflect the kidney function. Consequently, it is unsuitable for application to all populations, as it was tested solely on healthy adult males.
Cockcroft-Gault equation (C-G equation) (1973)The Cockcroft-Gault (CG) equation was initially developed using data from a homogeneous cohort of 249 adult male patients admitted to a single veterans hospital in Canada, in 1973 [42, 43]. These patients exhibited renal function ranging from normal to mildly or moderately impaired (CrCl: 30–130 mL/m2) [42]. Due to the limited diversity within the derivation cohort, the applicability and accuracy of the equation to broader patient populations remain uncertain. As a result, various correction factors have been explored to enhance its utility beyond the original study context. One such correction factor involves a 15% reduction in estimated CrCL for female patients to accommodate differences in muscle mass and fat composition compared to male patients. Additionally, the SCr assay utilized in the derivation of the CG equation differs from contemporary standardized assays, such as isotope dilution mass spectrometry (IDMS)-traceable assays [44, 45]. Unfortunately, the equation cannot be adjusted to account for this change in assay methodology, resulting in an approximate 10% overestimation of CrCl [46]. It estimates CrCl based on age, weight, and SCr levels as described in Table 1. Furthermore, the CG equation incorporates age as a linear function, despite subsequent research indicating non-uniform changes in GFR over time [47].
Despite its historical significance and initial accuracy in diverse patient populations with conditions like hypertension, congestive heart failure, and chronic renal failure, the CG equation has fallen out of favor due to several limitations [48]. These include its reliance on outdated creatinine assays, lack of adjustment for body surface area, and questions surrounding its mathematical validity [43, 49]. Nevertheless, it may still find utility in specific scenarios, such as in elderly patients, for drug studies, and for estimating renal function at the bedside [49]. Its accuracy is compromised in certain populations, such as those with cirrhosis, and it cannot be readily adapted for use with IDMS-traceable SCr values [50, 51].
Keller’s Eq. (1987)The authors described a simple formula designed to estimate CrCl in 25–100 subjects with normal creatinine values [52]. This equation relies solely on one variable, age, and its details are outlined in Table 1. The authors concluded that the equation holds considerable significance in predicting the decline in GFR due to the ageing process among healthy older individuals [52].
Salazar-Corcoran Eq. (1988)In a study, the researchers developed gender-specific equations to estimate CrCl in obese individuals by incorporating fat-free body mass (FFBM) as a key variable [53]. These equations (Table 1) were validated using data from both animal models and human subjects, demonstrating strong correlations between FFBM and CrCl. In contrast to existing methods, these equations accurately predicted CrCl in obese individuals, surpassing the performance of traditional methods [53]. The researchers concluded that these equations provide a reliable tool for optimizing drug dosing in obese patients when direct measurement of CrCl is not feasible [53].
Estimation equations for GFRSchwartz (1976–2009)Equations used to estimate GFR in adults are deemed unsuitable for children aged ≤ 9 years. Instead, various equations have been formulated to estimate GFR in them, with the Schwartz formula being the most widely utilized since its inception in 1976 [54]. This equation, represented as eGFR = (k × L)/SCr, where k varies based on the child’s age and L denotes length or height, has been found to consistently overestimate GFR. This overestimation is attributed to factors related to the creatinine assay technique and measurement peculiarities specific to children. Notably, the Jaffe method, commonly used for creatinine measurement, may be affected by plasma proteins, leading to an inaccurately high correction factor, particularly in children with lower plasma protein levels. Additionally, due to children’s lower muscle mass, any measurement error has a relatively larger impact compared to adults. To address these concerns, a simplified version of the Schwartz equation, developed in 2009 using standardized creatinine methods, provides a good approximation of the original formula [55, 56]. This simplified equation as given in Table 1 offers a practical alternative and is based on more straightforward inputs. This equation offers a reliable estimate comparable to the more intricate Schwartz eGFR formula, which incorporates variables like creatinine, urea, cystatin C, and height [54]. Cystatin C has been proposed as a potentially superior indicator of renal function in children compared to creatinine [55]. However, it is important to acknowledge a limitation: the equation was developed based on data from a cohort of 600 children with CKD experiencing abnormal growth. Consequently, its accuracy may be compromised when applied to children with milder renal impairment and typical skeletal development.
Walser’s Eq. (1993)Walser et al. observed 85 patients aged 23 to 79 years with advanced CKD (SCr > 2 mg/dL) [57]. They measured SCr and urinary clearance of Technetium-99 m diethylenetriaminepentaacetic acid (mTcDTPA) in these patients. The authors derived the GFR prediction equation from creatinine, age, and weight as given in Table 1 [57]. GFR was expressed per 3m2 of height2 instead of 1.73 m2 of surface area as weight changes, whereas height remains relatively constant [57]. This equation accurately predicted the GFR in the patients, with a small margin of error. However, they are only applicable to patients with SCr levels greater than 2 mg/dL [57].
Nankivell’s Eq. (1995)As existing formulas designed for assessing CKD patients’ kidney function showed inadequate performance when applied to kidney transplant recipients, the authors aimed to investigate the inaccuracies and their underlying causes [58]. Subsequently, they sought to develop specific predictive equations for estimating GFR tailored to renal transplantation. In a cohort comprising kidney transplant recipients (n = 146), the study evaluated factors influencing GFR beyond SCr levels [58]. These factors included sex, height, weight, serum urea, duration of dialysis, occurrences of rejection and infections, and prednisolone dosage [58]. The GFR was evaluated in these patients using 9mTe DTPA as a reference method. The analysis revealed a highly variable relationship between SCr and GFR, influenced by factors such as changes in muscle mass and catabolic rate, with additional variations observed in cases of acute tubular necrosis (ATN) and chronic rejection. From this analysis, three alternative GFR formulas were developed and compared against six existing methods of GFR estimation. The newly derived formulas demonstrated the highest correlation, minimal overall bias, the least scatter of the sum of squares, and minimal error, particularly at low GFR levels [58]. Additionally, the study presented two simplified versions of these formulas, requiring fewer clinical parameters for rapid calculation [58]. The association between SCr and GFR exhibits significant variability, influenced by factors such as muscle mass and catabolic rate alterations, potentially impacting the formulas’ accuracy. Additionally, beyond SCr levels, factors like sex, height, body weight, serum urea, dialysis duration, rejection and infection instances, and prednisolone dosage can affect GFR, posing challenges for the derived formulas to fully account for these variables. Clinical conditions like acute tubular necrosis (ATN) and chronic renal rejection may further complicate matters by reducing the tubular secretion of creatinine, not adequately captured by the formulas. Moreover, most formulas tend to systematically overestimate GFR and poorly correlate with the reference method, suggesting limitations in predictive accuracy. Furthermore, formulas developed specifically for kidney transplant recipients may lack generalizability to other patient populations or settings. In extreme cases, such as pediatric patients or adults at the extremes of body weight or height, predictive formulas often lose accuracy, potentially limiting their applicability.
留言 (0)