Diabetic nephropathy (DN) refers to kidney damage caused by diabetes and is one of the most common microvascular complications of the disease. Measuring urinary albumin levels and glomerular filtration rates (GFRs) is an important diagnostic measure (1) Type 2 diabetes is a rapidly growing global health issue, particularly with the aging population. The incidence of diabetes has been increasing annually, reaching 10.5% in 2021 (2), and it is projected that 579 million people will develop diabetes by 2045 (3). DN typically develops approximately 10 years after the onset of diabetes, with approximately 30%–40% of newly diagnosed diabetics developing the condition each year. Of these, approximately 30% progress to end-stage kidney disease (4). Diabetes with kidney complications significantly increases the risk of mortality compared to diabetes without kidney involvement (5, 6). As diabetes progresses, the prevalence of DN has steadily increased (7). Considerable progress has been made in understanding the pathogenesis of DN, particularly in its prevention and treatment (8, 9). Therefore, it is crucial to further elucidate the molecular mechanisms underlying DN and explore the processes of renal fibrosis.
Recent studies have identified a link between intestinal microbiota disorders and kidney disease. Clinical evidence suggests that imbalances in the gut microbiota may play a key pathological role in DN (10). The human intestinal microbiota is predominantly composed of Firmicutes and Bacteroidetes (11), which serve as potential diagnostic markers for microbial dysbiosis. In DN, the abundance of Firmicutes decreases, while that of Bacteroidetes increases, which is associated with impaired glucose tolerance and insulin resistance (12). Proteinuria is a critical marker in the early diagnosis of DN, and studies have shown increased levels of Lactobacillus, Enterobacteriaceae, and Streptococcus in these patients (13). Previous research suggests that gut microbiota may influence DN through its effects on blood metabolites (14). Short-chain fatty acids (SCFAs) produced by gut bacteria play a crucial role in regulating inflammatory and immune responses. An increased abundance of SCFA-producing bacteria can shift the intestinal environment toward an inflammatory state, contributing to tubular injury (15). In DN-induced tubular interstitial damage, bacteria such as Actinobacterium, Ruminococcus, and Rikenella are decreased, while the abundance of Lactobacillus and Phascolarctobacterium acetate significantly increases (16). Fecal transplantation and modulation of the intestinal microbiota in DN have been shown to reduce tubular interstitial damage by improving cholesterol homeostasis (17). Thus, gut microbiota and blood metabolites play a critical role in the progression of DN (18). This study aims to clarify the causal relationship between intestinal microbiota, blood metabolites, and DN using Mendelian randomization (MR).
MR has emerged as a widely used epidemiological analysis method in recent years (19). By leveraging the principle of randomized allele distribution during meiosis, it mitigates confounding factors and reduces the impact of reverse causation commonly seen in observational epidemiology (20). Genetic variants serve as instrumental variables (IVs) to assess causal relationships between exposure factors and outcomes (21). Two-sample bi-directional MR uses two separate genome-wide association study (GWAS) datasets to evaluate causal relationships between exposure and outcome, thereby enhancing the statistical power of the analysis (22).
To date, no MR analysis has been published on the bidirectional causal relationship between intestinal microbiota and DN. However, there is increasing evidence supporting the value of human genetic data in clinical studies of gut microbial features, enabling the use of MR to infer causal relationships between gut microbiota and DN (23). This study investigates the potential causal links between intestinal microbiota, blood metabolites, and DN by performing a bidirectional MR analysis using the latest genome-wide association data.
2 Materials and methods2.1 Study designThis study employed a two-sample bidirectional MR approach to investigate the potential causal relationships between gut microbiota and DN. The goal was to comprehensively assess both the direct and reverse causal effects of gut microbiota on DN and vice versa, as well as the mediating role of blood metabolites in this pathway. The workflow of this study is outlined in Figure 1. The study was divided into three major components:
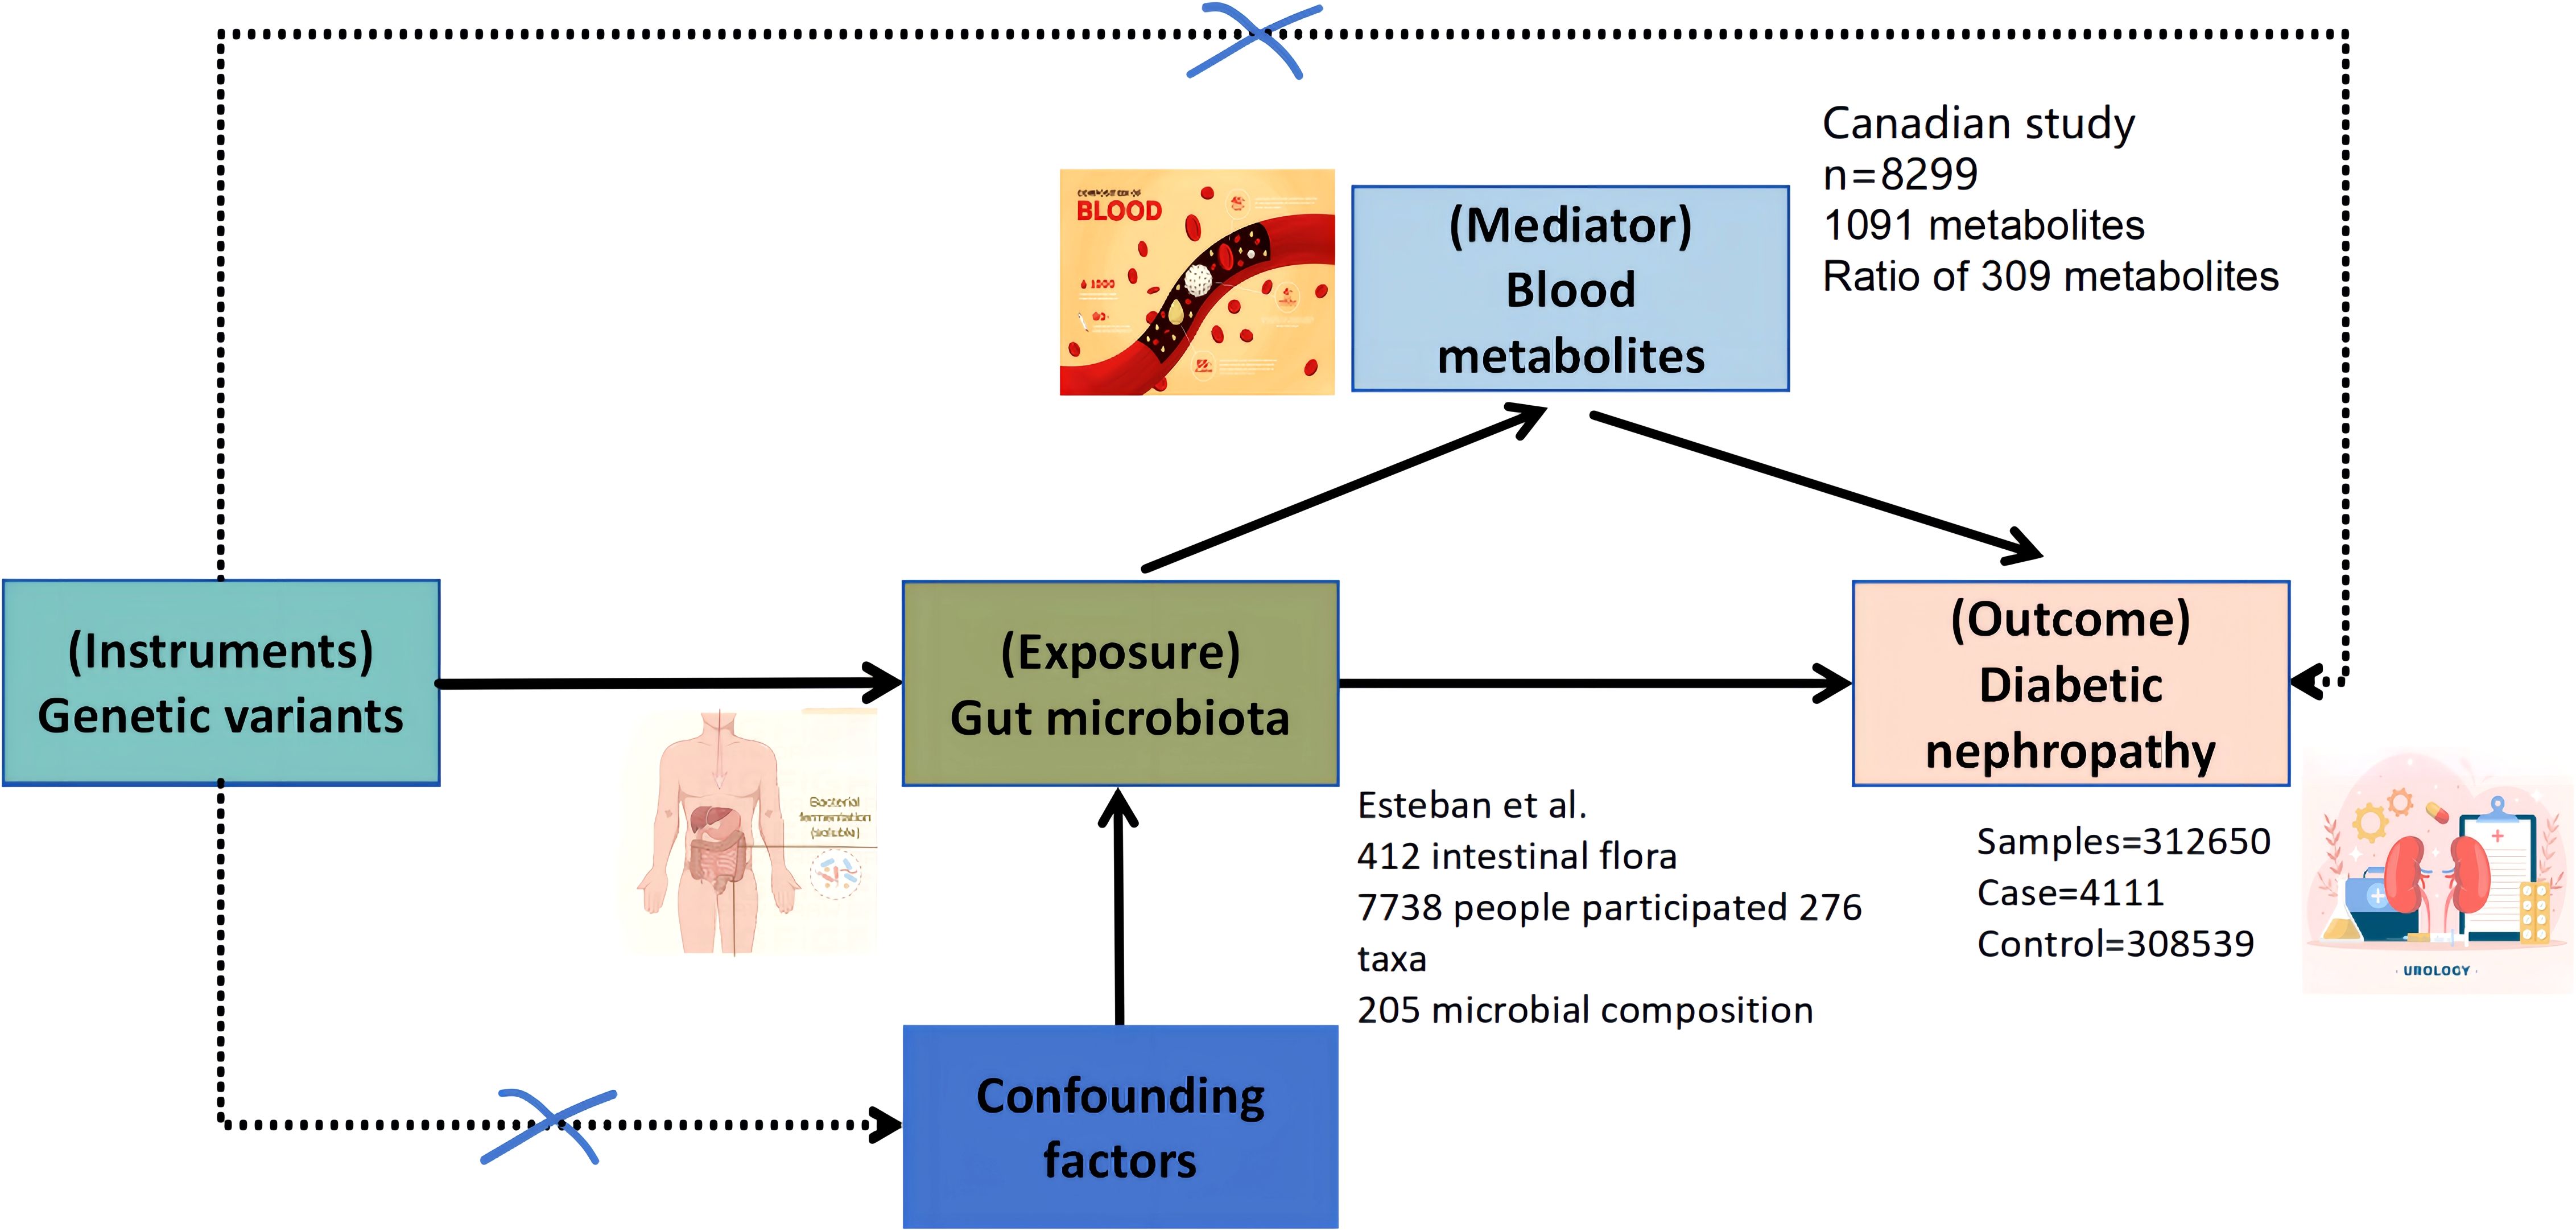
Figure 1. Bi-directional and intermediate Mendelian randomization analysis and hypothesis. Firstly, the causal relationship between gut microbiota and diabetic nephropathy was analyzed by two-sample bi-directional MR. Secondly, 1,400 blood metabolites were selected for subsequent randomized Mendelian analysis. Finally, a two-step MR analysis was performed to identify potentially mediated blood metabolites (the first step in screening blood metabolites associated with diabetic nephropathy). The second step is to further screen the gut microbiota associated with diabetic nephropathy and finally establish an intermediary analysis of blood metabolites from the gut microbiome to diabetic nephropathy.
Bidirectional causal analysis: We analyzed the bidirectional causal relationship between 412 gut microbiota taxa and DN.
Causal effect of blood metabolites: We evaluated the causal relationship between 1,400 blood metabolites and DN.
Mediation analysis: We explored whether blood metabolites mediate the relationship between gut microbiota and DN.
The validity of the MR analysis is based on three key assumptions: The IVs are strongly associated with the exposure (gut microbiota or blood metabolites). The IVs are independent of confounding factors that affect both the exposure and the outcome. The IVs influence the outcome only through the exposure, with no pleiotropic effects.
The data on DN outcomes are derived from the Finnish database, which satisfies these assumptions. Ethical approval for the GWAS data used in this study has been obtained from the relevant ethics committees. A schematic of the study workflow is shown in Figure 1.
2.2 Sources of Exposure and Outcome Data2.2.1 Gut microbiota and blood metabolitesGut microbiota data were obtained from a GWAS conducted by Esteban et al. (24), which included 7,738 participants and identified 412 microbial taxa. The study provided data on 207 taxa and 205 pathways reflecting microbial composition and activity. Blood metabolite data were sourced from a study by Kettunen et al. (25), which included 8,299 participants and identified 1,400 metabolites.
2.2.2 Diabetic nephropathy GWAS dataSummary statistics for DN were obtained from the FinnGen study (26), which includes 260,405 participants. The fifth data release includes 4,984 cases of DN and 255,421 controls. Cases were identified using a comprehensive set of diagnostic codes, in line with World Health Organization (WHO) recommendations (27).
2.2.3 Quality control of instrumental variablesTo identify appropriate IVs for gut microbiota and blood metabolites, we first selected significant single-nucleotide polymorphisms (SNPs) with a p-value threshold of <1e-05. For each exposure, we applied a linkage disequilibrium (LD) clumping threshold of clump_kb=10,000 and clump_r2 = 0.001 to ensure independence of SNPs. We excluded weak IVs with an F-statistic < 10 to avoid weak instrument bias (28, 29). The SNP data were extracted for chromosomal locations, effect alleles, effect allele frequencies (EAF), effect sizes (β), standard errors (SE), and p-values.
To exclude potential confounding factors, we used the PhenoScannerV2 database to validate and exclude SNPs associated with confounders. This rigorous quality control ensures the robustness and reliability of our results.
2.3 Data analysis2.3.1 Preliminary analysisInverse variance weighting (IVW) was used as the primary method for identifying causal relationships between gut microbiota and DN. IVW is preferred due to its ability to minimize pleiotropy and bias, making it a reliable method for causal inference (30). Additionally, we employed complementary methods, including weighted median, MR-Egger, simple modal, and weighted modal approaches, to evaluate the consistency and robustness of the causal estimates.
The results from MR analyses are reported as odds ratios (ORs) with 95% confidence intervals (CIs). Statistical significance was determined by an IVW p-value < 0.05, with directionality consistent across methods. We applied Bonferroni correction for multiple testing, considering the large number of exposures and outcomes. To examine reverse causality, a reverse MR analysis was also performed.
2.3.2 Mediation analysisWe conducted a mediation analysis to investigate whether blood metabolites mediate the relationship between gut microbiota and DN. The steps in the mediation analysis are outlined as follows:
Step 1: First, we determined whether gut microbiota (412 taxa) had a causal effect on blood metabolites (1,400 metabolites).
Step 2: We then assessed whether these metabolites served as intermediaries in the pathway between gut microbiota and DN.
Two MR methods were used for mediation analysis:
Two-stage Mendelian randomization (TSMR) (31): This approach assumes no interactions between exposures and mediators. We estimated the causal effect of gut microbiota on DN (β1) from univariate MR, the causal effect of blood metabolites on DN (β2), and the causal effect of microbiota on metabolites (α).
Multivariate Mendelian randomization (MVMR) (32): This method allows for the simultaneous estimation of both the direct and indirect causal effects. In MVMR, the controlled direct effect of gut microbiota on DN was estimated (β1), while the indirect effect through metabolites was represented as α × β2.
All IVW results were adjusted for multiple comparisons using the false discovery rate (FDR) method, with FDR q-values reported.
2.3.3 Sensitivity analysisWe conducted a sensitivity analysis to assess the robustness of the causal estimates and ensure that the results were not influenced by pleiotropy or heterogeneity. The following tests were employed:
MR-Egger intercept: To detect the presence of directional pleiotropy.
Cochran’s Q test: To assess the heterogeneity of the IVs (p < 0.05).
MR-PRESSO (33): To identify and correct for outliers (SNPs) contributing to pleiotropy and heterogeneity. SNPs with a significance level of p < 0.05 were flagged as outliers (see Table 1).
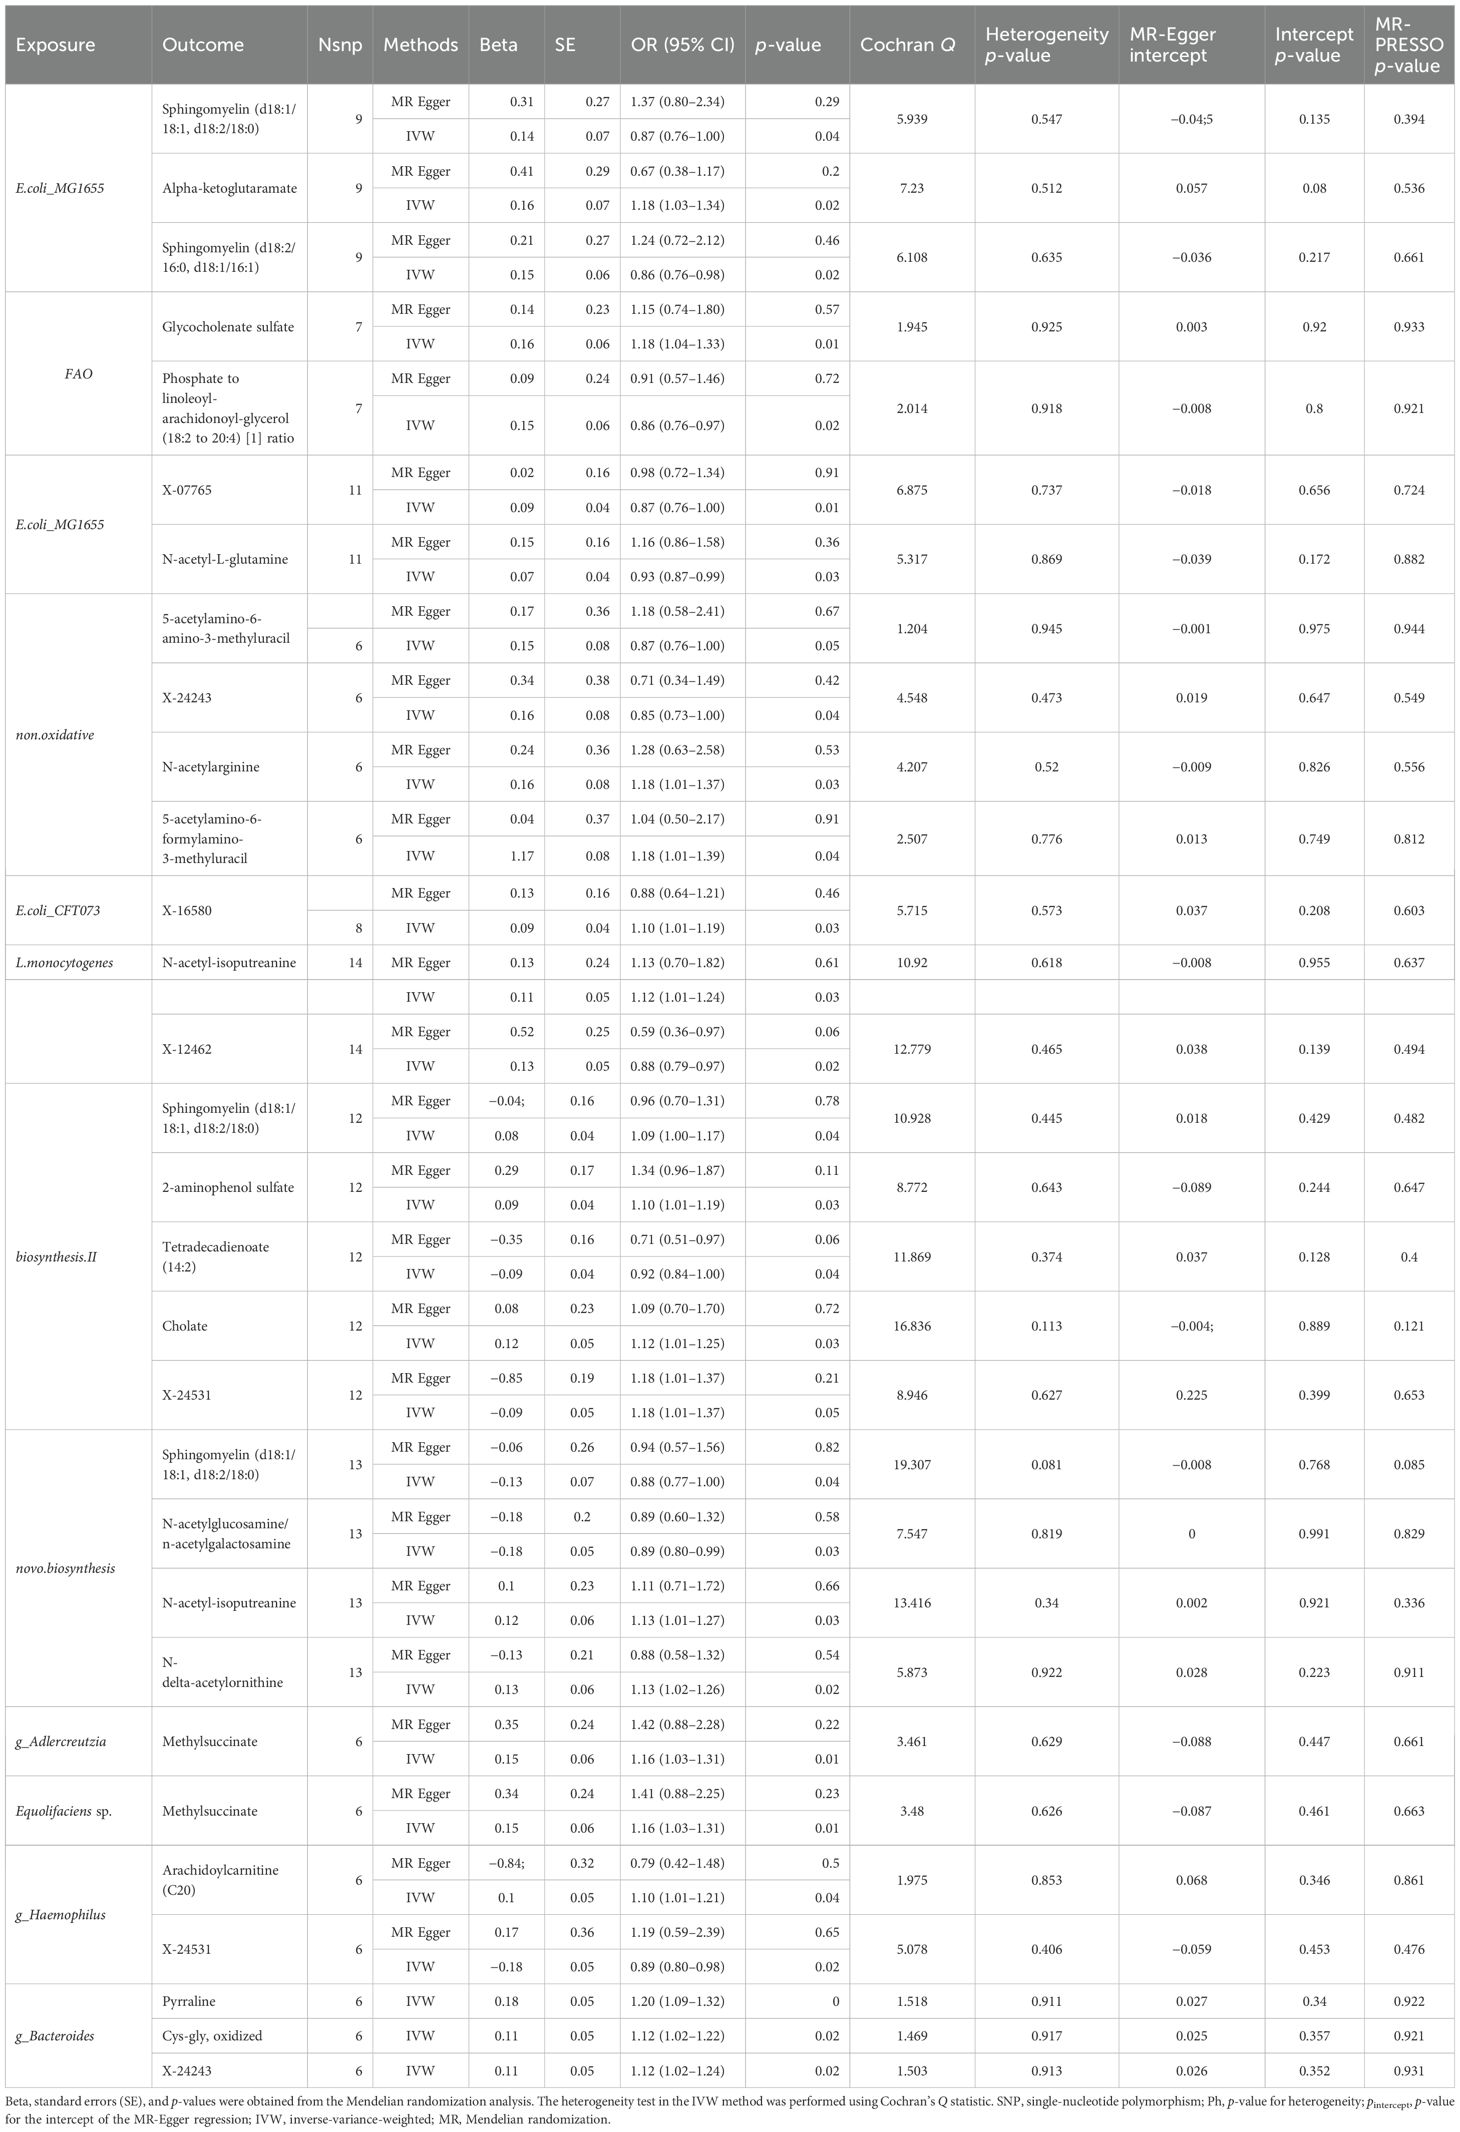
Table 1. Mendelian randomization analyses of the causal effects between gut microbiota and blood metabolites.
We also performed a leave-one-out analysis (34) to determine whether any single SNP disproportionately influenced the MR results (35).
Finally, we used a two-step randomization approach to explore the role of blood metabolites as mediators in the relationship between gut microbiota and DN. All analyses were conducted in the R Studio environment (version 4.3.1).
3 Results3.1 Screening of instrumental variablesIn this study, IVs were rigorously controlled in MR analysis to assess the causal relationship between 412 gut microbiota taxa and DN. Genetic variations with an F-statistic greater than 10 were considered strong IVs. Sensitivity analysis was conducted using the MR-Egger intercept and MR-PRESSO method to test for pleiotropy, and Cochran’s Q test (p < 0.05) was used to assess the heterogeneity of the IVs.
3.2 Two-sample and bidirectional Mendelian randomization analysis of gut microbiota and diabetic nephropathyIn the MR analysis of gut microbiota, SNPs associated with gut microbiota were used as IVs. The IVW method identified 12 specific gut microbiota taxa with significant causal effects on DN (see Figure 2).
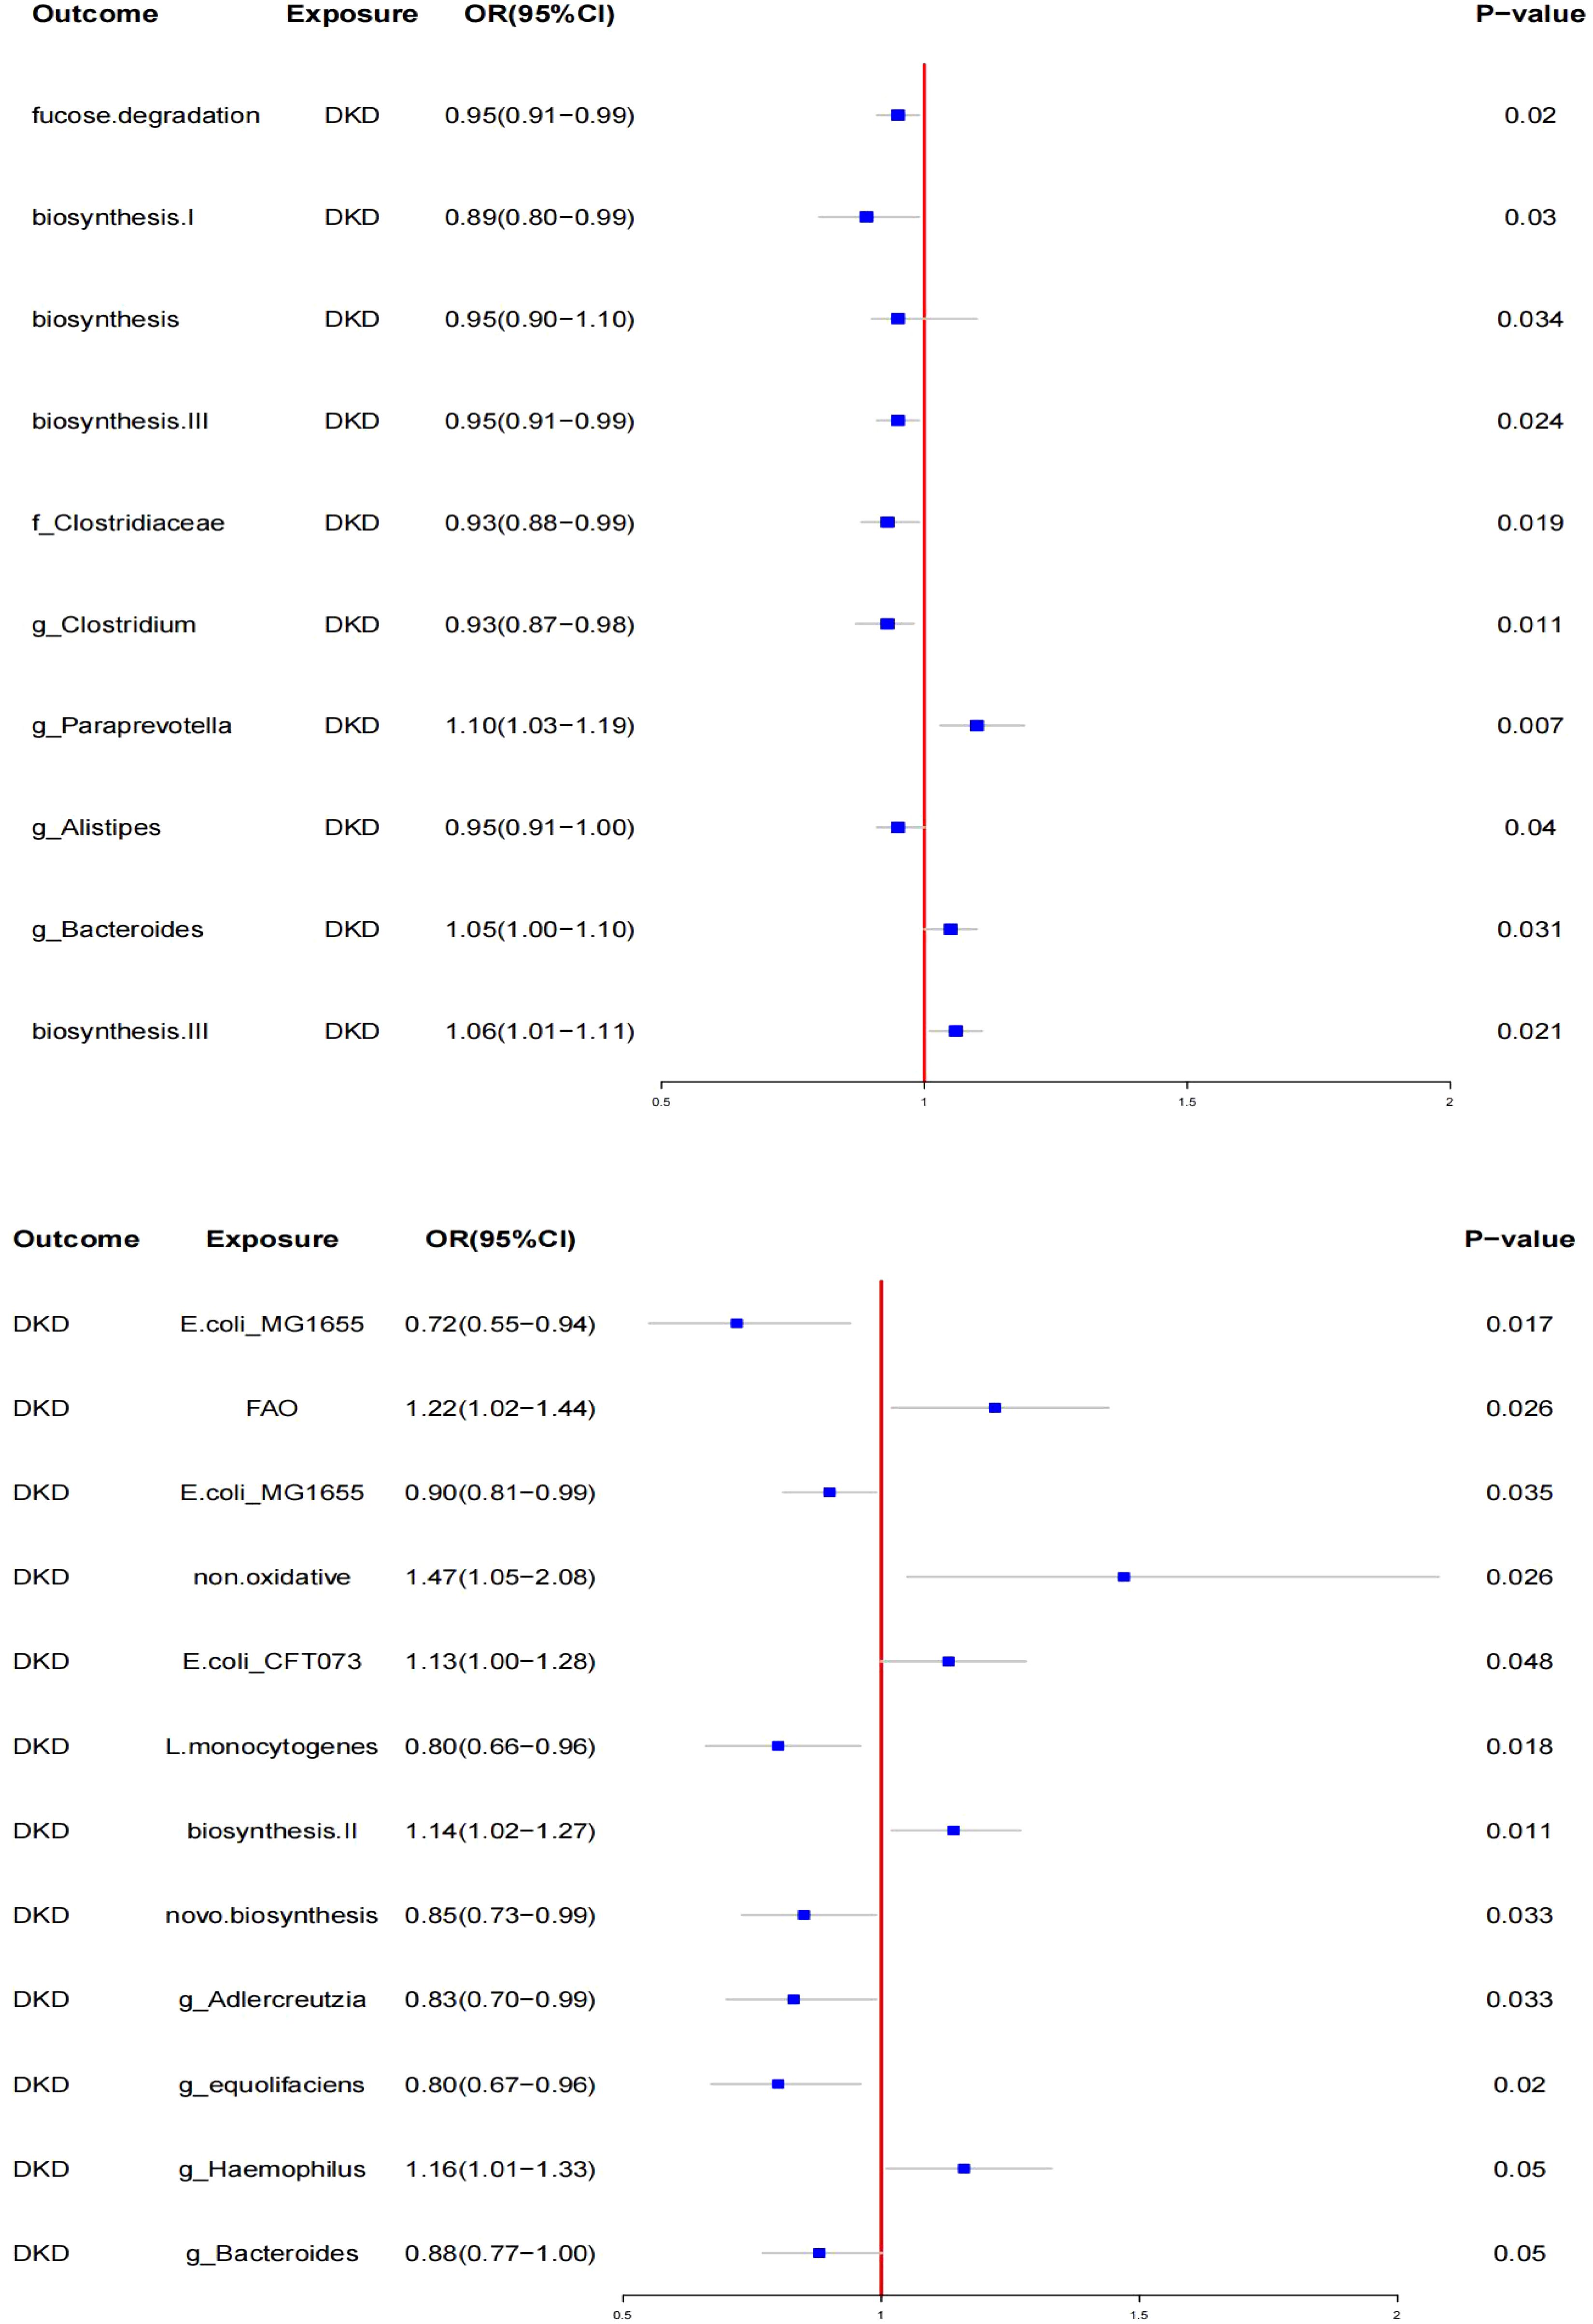
Figure 2. Mendelian randomization results of causal effects between gut microbiotas and DKD.
3.2.1 **Protective taxa**- *Escherichia coli* str. K-12 substr. MG1655 series (OR: 0.72, 95% CI: 0.55–0.94, p < 0.05)
- *Listeria monocytogenes* 10403S (OR: 0.80, 95% CI: 0.66–0.96, p < 0.05)
- *E. coli* str. K-12 substr. MG1655 series (OR: 0.90, 95% CI: 0.81–0.99, p < 0.05)
- *Bacteria from guanosine nucleotides* (OR: 0.85, 95% CI: 0.73–0.99, p < 0.05)
- *Adlercreutzia* (OR: 0.83, 95% CI: 0.70–0.99, p < 0.05)
- *Adlercreutzia sp. Adlercreutzia equolifaciens* (OR: 0.80, 95% CI: 0.67–0.96, p < 0.05)
- *Haemophilus* (Paraemophilus) (OR: 0.88, 95% CI: 0.77–1.00, p < 0.050)
- *Bacteroides* (OR: 0.88, 95% CI: 0.77–1.00, p < 0.05)
3.2.2 **Risk taxa**- Fatty acids β (OR: 1.22, 95% CI: 1.01–1.44, p < 0.05)
- New findings (OR: 1.47, 95% CI: 1.05–2.00, p < 0.05), suggesting a significant association, but further investigation is needed due to potential issues with classification.
- Escherichia coli CFT073 (OR: 1.13, 95% CI: 1.10–1.28, p < 0.05)
3.2.3 Biosynthesis pathwaysBiosynthesis II. Plants (OR: 1.14, 95% CI: 1.03–1.27, p < 0.05)
No significant pleiotropy or heterogeneity was found using the MR-Egger test and Cochran’s Q test. Reverse MR analysis revealed changes in the relative abundance of gut microbiota taxa after the onset of diabetic kidney disease (DKD). Specifically, the relative abundance of three taxa increased, while seven taxa showed a decrease (see Figure 2). The most significantly affected gut bacterial population in DKD was Paraprevotella xylaniphila (OR: 1.14, 95% CI: 1.02–1.27, p < 0.05). Sensitivity analysis confirmed the robustness of these findings.
3.3 Mediation analysis of potential blood metabolites and DKDUsing IVW, a causal relationship was found between 20 blood metabolites and DKD (see Figure 3, Table 2).
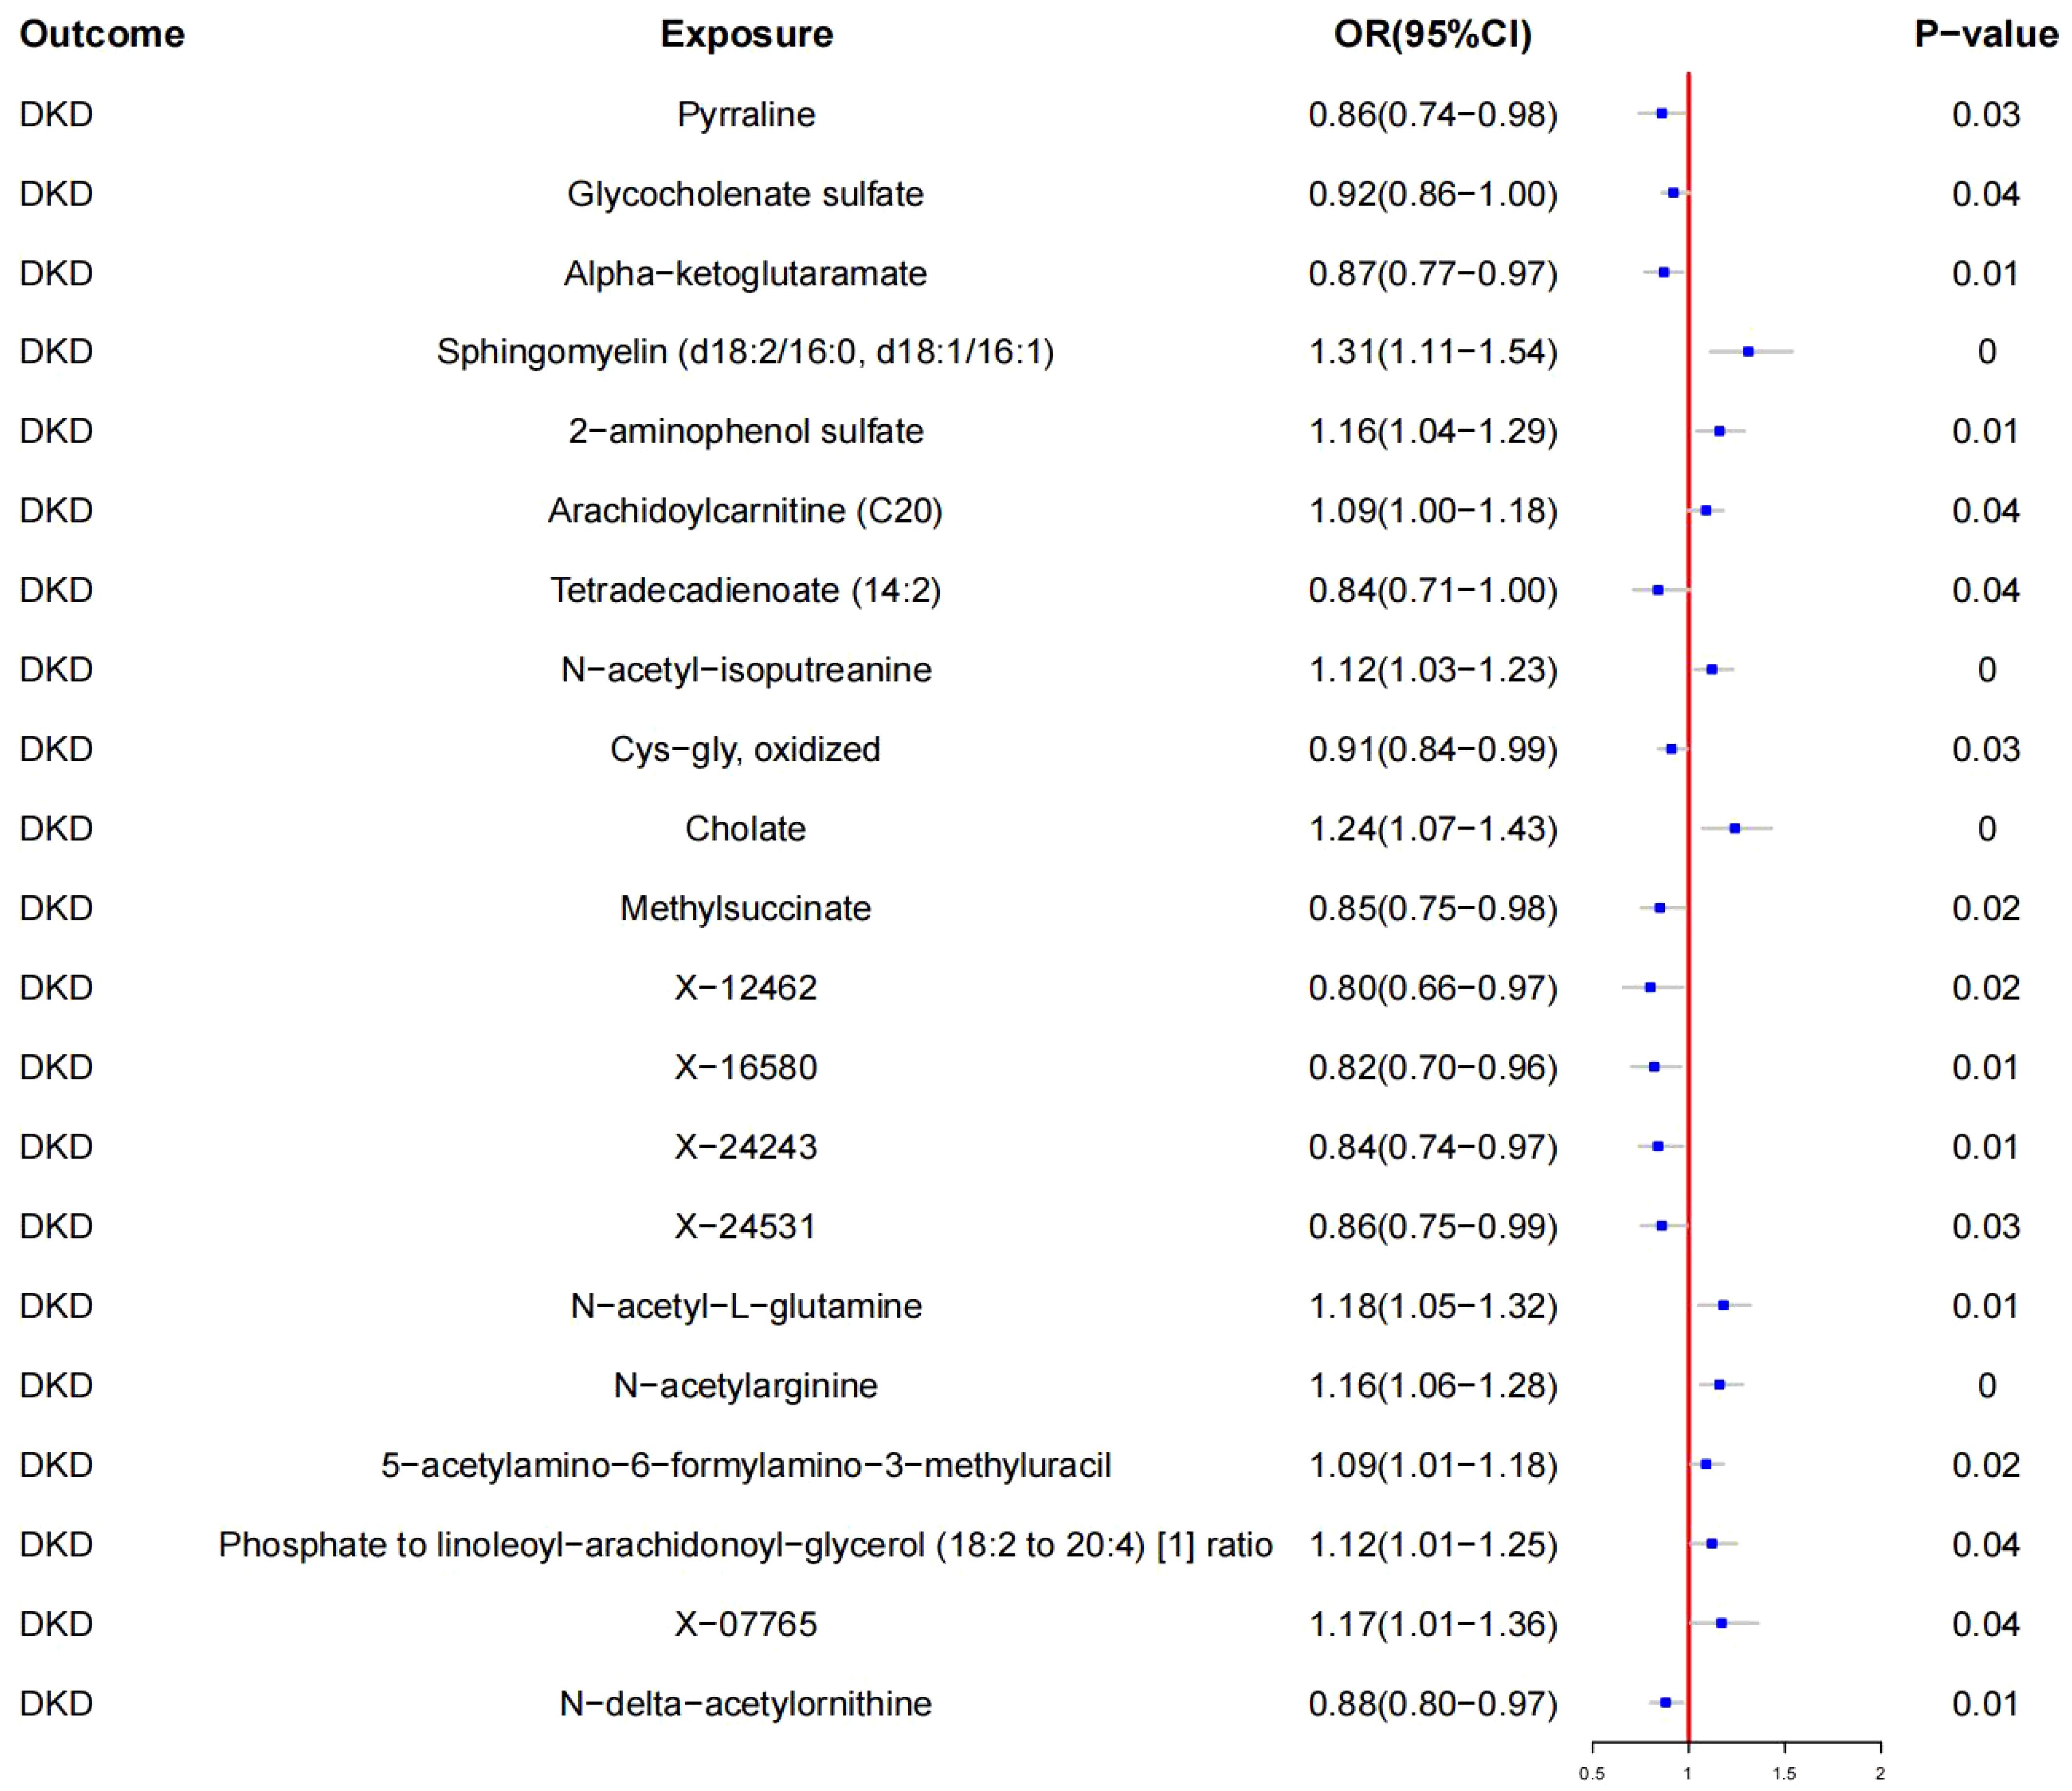
Figure 3. Mendelian randomization results of causal effects between Blood metabolites and DKD.
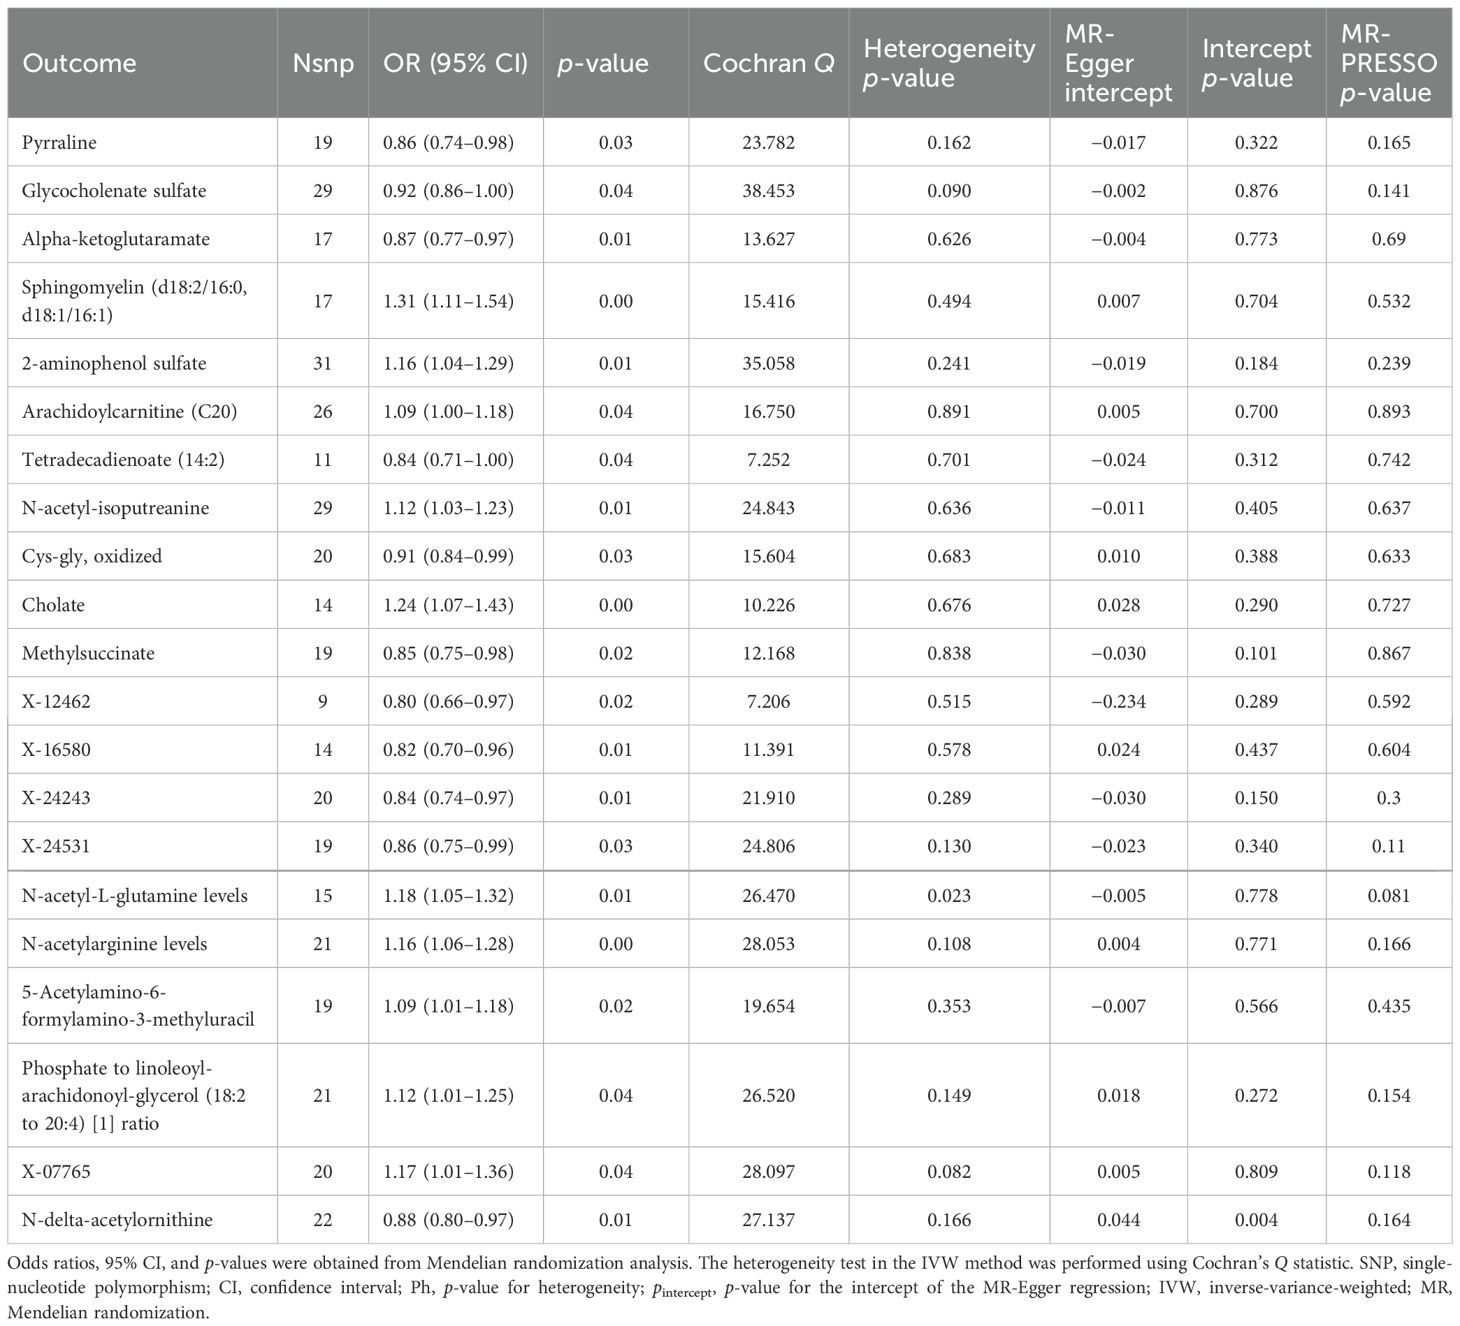
Table 2. Mendelian randomization analyses of the causal effects between blood metabolites and dkd.
3.3.1 Protective metabolites- Pyrraline (OR: 0.86, 95% CI: 0.74–0.98; p < 0.05)
- Glycocholenate sulfate (OR: 0.92, 95% CI: 0.86–1.00; p < 0.05)
- Alpha-ketoglutarate (OR: 0.87, 95% CI: 0.77–0.97; p < 0.05)
- Tetradecadienoate (14:2) (OR: 0.84, 95% CI: 0.71–1.00; p < 0.05)
- Cys-gly oxidized (OR: 0.91, 95% CI: 0.84–0.99; p < 0.05)
- Methylsuccinate (OR: 0.85, 95% CI: 0.75–0.98; p < 0.05)
- X-12462 (OR: 0.80, 95% CI: 0.66–0.97; p < 0.05)
- X-16580 (OR: 0.82, 95% CI: 0.70–0.96; p < 0.05)
- X-24243 (OR: 0.84, 95% CI: 0.74–0.97; p < 0.05)
- X-24531 (OR: 0.86, 95% CI: 0.75–0.99; p < 0.05)
- N-delta-acetylornithine (OR: 0.88, 95% CI: 0.80–0.97; p < 0.05)
3.3.2 Risk metabolites- Sphingomyelin (d18:2/16:0, d18:1/16:1) (OR: 1.31, 95% CI: 1.11–1.54; p < 0.05)
- 2-aminophenol sulfate (OR: 1.16, 95% CI: 1.04–1.29; p < 0.05)
- Arachidoylcarnitine (C20) (OR: 1.09, 95% CI: 1.00–1.18; p < 0.05)
- N-acetyl-isoputreanine (OR: 1.12, 95% CI: 1.03–1.23; p < 0.05)
- Cholate (OR: 1.24, 95% CI: 1.07–1.43; p < 0.05)
- N-acetyl-L-glutamine (OR: 1.18, 95% CI: 1.05–1.32; p < 0.05)
- N-acetylarginine (OR: 1.16, 95% CI: 1.06–1.28; p < 0.05)
- 5-acetylamino-6-formylamino-3-methyluracil (OR: 1.09, 95% CI: 1.01–1.18; p < 0.05)
- Phosphate to linoleoyl-arachidonoyl-glycerol (18:2 to 20:4) [1] ratio (OR: 1.12, 95% CI: 1.01–1.25; p < 0.05)
- X-07765 (OR: 1.17, 95% CI: 1.01–1.36; p < 0.05)
3.3.3 Key findings- *Escherichia coli* str. K-12 substr. MG1655 series (OR: 0.87, 95% CI: 0.78–0.97; p < 0.05)
- *Adlercreutzia* (OR: 0.83, 95% CI: 0.70–0.99; p < 0.05)
- Biosynthesis II. Plants (OR: 1.14, 95% CI: 1.03–1.27; p < 0.05)
By analyzing specific blood metabolites as intermediates, we identified that 11 protective gut microbiota-related metabolites reduced the risk of DN, while 10 risk metabolites significantly increased the risk.
3.4 Mendelian randomization analyses of the causal effects between gut microbiota and blood metabolitesWe found that Escherichia coli strain K-12 substrain MG1655 (OR: 0.87, 95% CI: 0.55–0.94, p < 0.05) serves as a protective factor against DKD. This strain increases alpha-ketoglutarate levels while lowering sphingomyelin (d18:1/18:1, d18:2/18:0) and sphingomyelin (d18:2/16:0, d18:1/16:1) levels. Gut microbiota associated with fatty acid oxidation (OR: 1.22, 95% CI: 1.02–1.44, p < 0.05) is linked to the progression of DKD, increasing glycocholenate sulfate levels and decreasing the phosphate to linoleoyl-arachidonoyl-glycerol (18:2 to 20:4) ratio, which is detrimental to DKD.
Listeria monocytogenes 10403S (OR: 0.90, 95% CI: 0.81–0.99, p < 0.05) exerts a protective effect on DKD by downregulating X-07765 and N-acetyl-l-glutamine levels. Additionally, Listeria monocytogenes 10403S (OR: 0.80, 95% CI: 0.66–0.96, p < 0.05) increases N-acetyl-isoputreanine levels and decreases X-12462 levels, which helps protect against DKD by lowering X-12462 content.
Anaerobic yeast-related gut microbiota (OR: 1.47, 95% CI: 1.05–2.08, p < 0.05) contributes to the development of DKD by increasing N-acetylarginine and 5-acetylamino-6-formylamino-3-methyluracil levels, while decreasing X-24243 levels. Escherichia. coli CFT073 (OR: 1.13, 95% CI: 1.00–1.28, p < 0.05) is a harmful taxon for DKD, raising X-16580 levels. Similarly, the Bacillus phylum (OR: 1.14, 95% CI: 1.03–1.27, p < 0.05) is detrimental to DKD, as it increases sphingomyelin (d18:1/18:1, d18:2/18:0), 2-aminophenol sulfate, cholesterol, and X-24531 levels, while decreasing tetradecadienoate (14:2) levels.
Guanosine ribonucleotide biosynthesis-related gut microbiota (OR: 0.85, 95% CI: 0.73–0.99, p < 0.05) is beneficial and protective against DKD by increasing N-delta-acetylornithine and N-acetyl-isoputreanine levels, while decreasing sphingomyelin (d18:1/18:1, d18:2/18:0) and N-acetylglucosamine/N-acetylgalactosamine levels (see Table 1). g_Adlercreutzia (OR: 0.83, 95% CI: 0.70–0.99, p < 0.05) and g_Adlercreutzia.s_Adlercreutzia_equolifaciens (OR: 0.80, 95% CI: 0.67–0.96, p < 0.05) protect against DKD by increasing methylsuccinate levels. g_Haemophilus (OR: 0.88, 95% CI: 0.77–1.00, p < 0.05) and g_Bacteroides (OR: 0.88, 95% CI: 0.77–1.00, p < 0.05) also have protective effects, with g_Haemophilus increasing arachidoylcarnitine (C20) levels and decreasing X-24531 levels, demonstrating heterogeneous and multi-efficacious results.
We validated the mediating effects of blood metabolites identified by MVMR in TSMR. Focusing on the indirect effects and ratios mediated by two major classes of lipid metabolites, we found that sphingomyelin (d18:1/18:1, d18:2/18:0) and methylsuccinate remained significant after GM adjustment (Table 3). Overall, we observed indirect effects of sphingomyelin (d18:1/18:1,d18:2/18:0) and methylsuccinate between biosynthesis II, g_Adlercreutzia, and DN, with mediated proportions of 8.5% (p < 0.05) and 10.9% (p < 0.05), respectively (see Table 3).

Table 3. Multivariable Mendelian randomization analyses of the causal effects between gut microbiota, blood metabolites, and DKD.
4 DiscussionOur research is innovative in utilizing MR to investigate the causal relationship between gut microbiota and DN (DKD), while also exploring the mediating role of blood metabolites in this connection. This study is unique in employing TSMR and MVMR to examine potential mediation by blood metabolites between gut microbiota and DKD. We identified 12 gut microbiota taxa causally linked to DKD, which, in turn, influence the relative abundance of 10 taxa. Through TSMR and MVMR as intermediary analyses, we discovered 13 blood metabolites associated with these 12 gut microbiota taxa and DKD.
In particular, E. coli str. K-12 substr. MG1655 was found to reduce sphingomyelin levels by increasing α-ketoglutarate levels. Sphingomyelin levels (d18:2/16:0 and d18:1/16:1) were identified as protective against DKD. Moreover, our study highlighted the protective role of bacteria, such as Lactobacillus and Adler-Kreuzia, against DKD. Previous studies have shown that Bacillus spp. are involved in bile acid metabolism in DN, degrading lipopolysaccharides (LPS), inhibiting inflammation, and improving endotoxemia (36). However, other studies have indicated that Gram-negative bacteria, including Bacteroidetes, Proteobacteria, Fusobacteria, and Verrucomicrobia, are prevalent in DKD patients (37), leading to elevated LPS concentrations and the accumulation of inflammatory markers such as CRP, TNF-α, and IL-6. Clinical studies have also shown a decrease in the corresponding proportions of thick-walled mycobacteria and gut microbiota in DKD patients (38).
Our findings suggest that E. coli CFT073 and Haemophilus parainfluenzae are associated with the progression of DKD, potentially through other mechanisms, rather than fatty acid oxidation or anaerobic enzyme activity (12). Studies have shown that fatty acid β-oxidation can activate endoplasmic reticulum stress and excessive production of reactive oxygen species (ROS), leading to cellular dysfunction and contributing to the onset of DKD (39).
MR analysis confirmed the impact of several blood metabolites on the causal relationship between gut microbiota and DKD. Unlike commonly accepted biomarkers such as trimethylamine N-oxide (TMAO) and SCFAs, our study emphasizes the causal link between lipid metabolism and DKD. Our MR analysis demonstrated that sphingomyelin (d18:2/16:0, d18:1/16:1) and cholesterol levels are positively correlated with the risk of DKD progression. Sphingomyelins are crucial for glomerular and endothelial function. Lipidomic analysis has shown that sphingomyelins and phosphatidylcholine are associated with renal dysfunction and all-cause mortality in type 1 diabetes (40). Another MR analysis indicated that various lipoproteins protect against DKD (41).
Our mediation analysis provides a genetic basis for the causal relationship between gut microbiota and DKD. We found that E. coli, Bacillus, and Adlercreutzia are directly related to lipid metabolism, involving plasma sheath phospholipids and other metabolites. Furthermore, amino acids like α-ketoglutarate, isoleucine, and cysteine-glycine serve as intermediaries in the causal relationship between gut microbiota and DKD. Zhu (2022) suggested that amino acid metabolism plays a crucial role in the progression of diabetes mellitus (DM) and DN, with high levels of L-leucine and isoleucine significantly associated with a rapid decline in GFR.
Previous studies have not directly linked E. coli, Bacillus, and Adlercreutzia to lipid and amino acid metabolism. However, Han et al. studied the treatment of DKD with Yi kidney granules, identifying lactobacilli as positively related to sphingosine in sphingolipid metabolism and L-tyrosine in phenylalanine, tyrosine, and tryptophan biosynthesis (42). Our MR study confirmed a positive correlation between isoleucine and DKD, as well as between 2-aminophenol sulfate, cholate levels, and DKD progression. Uremic toxins, such as indoxyl sulfate and p-cresol sulfate, are closely related to CKD development, with imbalances in gut microbiota accelerating toxin production (43). Excessive levels of gut microbiota metabolites, such as 2-aminophenol sulfate and cholates, exacerbate kidney damage in DKD (44). The metabolism of choline, carnitine, and phosphatidylcholine by gut microbiota forms TMAO, which is then oxidized in the liver, highlighting the causal relationship between gut microbiota and lipid metabolism regulation (45).
The primary strength of this study lies in its comprehensive analysis of 412 gut microbiota taxa and 1,400 blood metabolites in relation to DKD. The study included a large sample size, utilizing data from 7,738 individuals for gut microbiota and 8,299 individuals for blood metabolites. This extensive dataset enabled us to explore the causal relationships using robust MR techniques.
However, this study has several limitations. Firstly, the findings predominantly apply to individuals of European descent, which may limit their generalizability to other ethnic groups. Differences in lifestyle, host metabolism, and gut microbiota composition across populations necessitate caution when interpreting these results for non-European groups. Future research should include more diverse populations to improve the generalizability of the findings. Additionally, despite rigorous efforts to identify and account for IV anomalies, potential pleiotropic effects may still exist. MR analysis is hypothesis-driven, and establishing a causal relationship between gut microbiota and DKD requires further experimental and clinical research.
5 ConclusionThis study provides robust evidence of a causal relationship between gut microbiota and DN, mediated by specific blood metabolites. These findings highlight the potential of gut microbiota and blood metabolites as novel biomarkers and therapeutic targets for DN. Probiotic therapy could significantly improve the quality of life and survival rates for patients with diabetic nephropathy.
Data availability statementThe original contributions presented in the study are included in the article/Supplementary Material. Further inquiries can be directed to the corresponding authors.
Ethics statementEthics approves and agrees to participate in this study based on publicly available data. Individual studies in each GWAS are approved by the relevant agency’s review board with the informed consent of participants, caregivers, legal guardians, or other agents.
Author contributionsB-NC: Writing – original draft. C-YZ: Conceptualization, Funding acquisition, Investigation, Resources, Software, Visualization, Writing – original draft. ZW: Writing – original draft, Writing – review & editing. Y-XW: Conceptualization, Data curation, Formal analysis, Funding acquisition, Investigation, Methodology, Project administration, Resources, Software, Supervision, Validation, Visualization, Writing – original draft, Writing – review & editing.
FundingThe author(s) declare financial support was received for the research, authorship, and/or publication of this article. This work was supported by NATCM’s·Project of High-level Construction of·Key TCM·Disciplines-Beijing University of Chinese Medicine-Nephrology of Traditional Chinese Medicine (zyyzdxk-2023260) and the Chinese Medicine Inheritance and Innovation Talent·Project-Leading Talent Support Program of National Traditional Chinese Medicine (Grant No. 2018, No. 12).
AcknowledgmentsThe authors thank their co-authors for their expertise and the journal editors for refining the study.
Conflict of interestThe authors declare that the research was conducted in the absence of any commercial or financial relationships that could be construed as a potential conflict of interest.
Publisher’s noteAll claims expressed in this article are solely those of the authors and do not necessarily represent those of their affiliated organizations, or those of the publisher, the editors and the reviewers. Any product that may be evaluated in this article, or claim that may be made by its manufacturer, is not guaranteed or endorsed by the publisher.
Supplementary materialThe Supplementary Material for this article can be found online at: https://www.frontiersin.org/articles/10.3389/fendo.2024.1450428/full#supplementary-material
References1. de Boer I-H, Rue T-C, Hall Y-N, Heagerty PJ, Weiss NS, Himmelfarb J, et al. Temporal trends in the prevalence of diabetic kidney disease in the United States. JAMA. (2011) 305:2532–9. doi: 10.1001/jama.2011.861
PubMed Abstract | Crossref Full Text | Google Scholar
2. Sun H, Saeedi P, Karuranga S, Pinkepank M, Ogurtsova K, Duncan BB, et al. IDF Diabetes Atlas: Global, regional and country-level diabetes prevalence estimates for 2021 and projections for 2045. Diabetes Res Clin Pract. (2022) 183:183109119. doi: 10.1016/j.diabres.2021.109119
PubMed Abstract | Crossref Full Text | Google Scholar
3. Saeedi P, Petersohn I, Salpea P, Malanda B, Karuranga S, Unwin N, et al. Global and regional diabetes prevalence estimates for 2019 and projections for 2030 and 2045: Results from the International Diabetes Federation Diabetes Atlas, 9(th) edition. Diabetes Res Clin Pract. (2019) 157:107843. doi: 10.1016/j.diabres.2019.107843
PubMed Abstract | Crossref Full Text | Google Scholar
6. Ritz E, Rychlík I, Locatelli F, Halimi S. End-stage renal failure in type 2 diabetes: A medical catastrophe of worldwide dimensions. Am J Kidney Dis. (1999) 34:795–808. doi: 10.1016/S0272-6386(99)70035-1
PubMed Abstract | Crossref Full Text | Google Scholar
7. Wu A-Y, Kong N-C, de Leon F-A, Pan CY, Tai TY, Yeung VT, et al. An alarmingly high prevalence of diabetic nephropathy in Asian type 2 diabetic patients: the MicroAlbuminuria Prevalence (MAP) Study. Diabetologia. (2005) 48:17–26. doi: 10.1007/s00125-004-1599-9
PubMed Abstract | Crossref Full Text | Google Scholar
8. Madonna R, Balistreri C-R, Geng Y-J, De Caterina R. Diabetic microangiopathy: Pathogenetic insights and novel therapeutic approaches. Vascul Pharmacol. (2017), 901–7. doi: 10.1016/j.vph.2017.01.004
PubMed Abstract | Crossref Full Text | Google Scholar
9. Anders H-J, Huber T-B, Isermann B, Schiffer M. CKD in diabetes: diabetic kidney disease versus nondiabetic kidney disease. Nat Rev Nephrol. (2018) 14:361–77. doi: 10.1038/s41581-018-0001-y
PubMed Abstract | Crossref Full Text | Google Scholar
10. Milani C, Duranti S, Bottacini F, Casey E, Turroni F, Mahony J, et al. The First Microbial Colonizers of the Human Gut: Composition, Activities, and Health Implications of the Infant gut microbiota. Microbiol Mol Biol Rev. (2017) 81:e00036-17. doi: 10.1128/MMBR.00036-17
PubMed Abstract | Crossref Full Text | Google Scholar
12. Larsen N, Vogensen F-K, van den Berg F-W, Nielsen DS, Andreasen AS, Pedersen BK, et al. gut microbiota in human adults with type 2 diabetes differs from non-diabetic adults. PloS One. (2010) 5:e9085. doi: 10.1371/journal.pone.0009085
PubMed Abstract | Crossref Full Text | Google Scholar
14. Mao ZH, Gao ZX, Liu DW, Liu ZS, Wu P. gut microbiota and its metabolites - molecular mechanisms and management strategies in diabetic kidney disease. Front Immunol. (2023) 14:1124704. doi: 10.3389/fimmu.2023.1124704
PubMed Abstract | Crossref Full Text | Google Scholar
16. Hu Z-B, Lu J, Chen P-P, Lu CC, Zhang JX, Li XQ, et al. Dysbiosis of intestinal microbiota mediates tubulointerstitial injury in diabetic nephropathy via the disruption of cholesterol homeostasis. Theranostics. (2020) 10:2803–16. doi: 10.7150/thno.40571
PubMed Abstract | Crossref Full Text | Google Scholar
17. Li Y-J, Chen X, Kwan T-K, Loh YW, Singer J, Liu Y, et al. Dietary Fiber Protects against Diabetic Nephropathy through Short-Chain Fatty Acid-Mediated Activation of G Protein-Coupled Receptors GPR43 and GPR109A. J Am Soc Nephrol. (2020) 31:1267–81. doi: 10.1681/ASN.2019101029
PubMed Abstract | Crossref Full Text | Google Scholar
19. Lawlor D-A, Harbord R-M, Sterne J-A, Timpson N, Davey Smith G. Mendelian randomization: using genes as instruments for making causal inferences in epidemiology. Stat Med. (2008) 27:1133–63. doi: 10.1002/sim.v27:8
Crossref Full Text | Google Scholar
23. Sanna S, van Zuydam N-R, Mahajan A, Kurilshikov A, Vich Vila A, Võsa U, et al. Causal relationships among the gut microbiome, short-chain fatty acids and metabolic diseases. Nat Genet. (2019) 51:600–5. doi: 10.1038/s41588-019-0350-x
PubMed Abstract | Crossref Full Text | Google Scholar
24. Lopera-Maya E-A, Kurilshikov A, van der Graaf A, Hu S, Andreu-Sánchez S, Chen L, et al. Effect of host genetics on the gut microbiome in 7,738 participants of the Dutch Microbiome Project. Nat Genet. (2022) 54:143–51. doi: 10.1038/s41588-021-00992-y
PubMed Abstract | Crossref Full Text | Google Scholar
25. Chen Y, Lu T, Pettersson-Kymmer U, Stewart ID, Butler-Laporte G, Nakanishi T, et al. Genomic atlas of the plasma metabolome prioritizes metabolites implicated in human diseases. Nat Genet. (2023) 55:44–53. doi: 10.1038/s41588-022-01270-1
PubMed Abstract | Crossref Full Text | Google Scholar
26. Liu X, Tong X, Zou Y, Lin X, Zhao H, Tian L, et al. Mendelian randomization analyses support causal relationships between blood metabolites and the gut microbiome. Nat Genet. (2022) 54:52–61. doi: 10.1038/s41588-021-00968-y
PubMed Abstract | Crossref Full Text | Google Scholar
27. Myers T-A, Chanock S-J, Machiela M-J. LDlinkR: an R package for rapidly calculating linkage disequilibrium statistics in diverse populations. Front Genet. (2020) 11157. doi: 10.3389/fgene.2020.00157
PubMed Abstract | Crossref Full Text | Google Scholar
28. Burgess S, Small D-S, Thompson S-G. A review of instrumental variable estimators for Mendelian randomization. Stat Methods Med Res. (2017) 26:2333–55. doi: 10.1177/0962280215597579
PubMed Abstract | Crossref Full Text | Google Scholar
30. Hartwig F-P, Davies N-M, Hemani G. Two-sample Mendelian randomization: avoiding the downsides of a powerful, widely applicable but potentially fallible technique. Int J Epidemiol. (2016) 45:1717–26. doi: 10.1093/ije/dyx028
PubMed Abstract | Crossref Full Text | Google Scholar
31. Burgess S, Daniel R-M, Butterworth A-S, Thompson SG. Network Mendelian randomization: using genetic variants as instrumental variables to investigate mediation in causal pathways. Int J Epidemiol. (2015) 44:484–95. doi: 10.1093/ije/dyu176
PubMed Abstract | Crossref Full Text | Google Scholar
32. Oikonen M, Wendelin-Saarenhovi M, Lyytikäinen L-P, Siitonen N, Loo BM, Jula A, et al. Associations between serum uric acid and markers of subclinical atherosclerosis in young adults. The cardiovascular risk in Young Finns study. Atherosclerosis. (2012) 223:497–503. doi: 10.1016/j.atherosclerosis.2012.05.036
PubMed Abstract | Crossref Full Text | Google Scholar
33. Ong J-S, MacGregor S. Implementing MR-PRESSO and GCTA-GSMR for pleiotropy assessment in Mendelian randomization studies from a practitioner's perspective. Genet Epidemiol. (2019) 43:609–16. doi: 10.1002/gepi.2018.43.issue-6
PubMed Abstract | Crossref Full Text | Google Scholar
34. Bowden J, Greco-M-F D, Minelli C, Davey Smith G, Sheehan NA, Thompson JR, et al. Assessing the suitability of summary data for two-sample Mendelian randomization analyses using MR-Egger regression: the role of the I2 statistic. Int J Epidemiol. (2016) 45:1961–74. doi: 10.1093/ije/dyw220
PubMed Abstract | Crossref Full Text | Google Scholar
35. Cohen J-F, Chalumeau M, Cohen R, Korevaar DA, Khoshnood B, Bossuyt PM, et al. Cochran's Q test was useful to assess heterogeneity in likelihood ratios in studies of diagnostic accuracy. J Clin Epidemiol. (2015) 68:299–306. doi: 10.1016/j.jclinepi.2014.09.005
留言 (0)