
記住我


We first set out to investigate whether ?CGRP and ?CGRP localize differently in neurons of mouse TGs using IHC on three different genotypes (WT, Het and KO). CGRP was found in cell bodies across WT (calca+/calca+), Het (calca+/calca-) and KO (calca-/calca-) mice (n = 5, Fig. 3), however, the overall intensity of the IHC was clearly different between the genotypes (see quantification later) (Fig. 3). While all genotypes are expected to express ?CGRP, interestingly, we only detected clear CGRP presence in axons of ?CGRP-expressing genotypes (WT and Het), indicating that ?CGRP but not ?CGRP localizes in the axons of TG neurons. Although we observed single CGRP-positive fibers in some KO TGs (S3), only in TGs from WT and Het mice, was CGRP consistently visible as beads on a thread continuously along nerve fibers. It is worth noting that in the Het TG axons the patterns were similar, but the intensity lower. All IHC data from this experiment can be found in S4 and S5. The finding that CGRP (assumed to be βCGRP) does not localize to the axons of KO mouse TGs indicates that ?CGRP might not function as a typical neurotransmitter.
Fig. 3
CGRP localization in mouse TG neurons. Immunostaining of TGs from WT, Het and KO mice targeting CGRP. Pictures were taken at 40 ms in areas with large concentration of cell bodies and at 200 ms in areas with a large concentration of axons. The pictures have hence been adjusted equally to intensify signals (higher exposure pictures (outlined by dashed line) are adjusted differently from the other pictures). CGRP is visualized in red by immunostaining with a primary antibody targeting CGRP (D5R8F) and a secondary antibody conjugated to Alexa568. Scalebars are 100 μm
CGRP localize differently in neuronal cell bodies of KO and WT miceAs stated above, the overall expression of CGRP was evidently lower in the Het and KO TGs compared to WT TGs (S6). Pictures of WT TGs had an average intensity (Arbitrary Units, A.U.) of 12.8 ± 0.6, Het had an average intensity of 8.1 ± 0.4 and KO TGs had an average intensity of 5.2 ± 0.2, with intensities significantly different between all three genotypes (p-valueWT: Het = 0.0007, p-valueWT: KO < 0.0001, p-valueHet: KO = 0.0068) (Fig. 4A). Enhancing the exposure to study the detailed localization patterns of CGRP in the different genotypes, we chose to focus on a neuronal-body rich part of the TG. The number of neuronal nuclei was near identical in pictures acquired of WT (146.8 ± 19.9), Het (145.0 ± 12.8) and KO (143.8 ± 16.0) TGs.
Fig. 4
CGRP IHC intensity measurements and quantification of CGRP localization patterns. A) Average intensities of TG CGRP signals (D5R8F, red, alexa568) from the full frame of WT TG (n = 3), Het (n = 3) and KO (n = 3). Intensity is measured in grayscale arbitrary units, and a representative picture of each genotype is shown. B-F) Graphs showing average number of different localization patterns (S7) observed in pictures of WT, Het and KO TGs (each n = 5). An example of the localization pattern can be found next to the graph. * p-value \(\:\le\:\) 0.05, ** p-value \(\:\le\:\) 0.01, *** p-value \(\:\le\:\) 0.001 and **** p-value \(\:\le\:\) 0.0001. Scalebars are 100 μm in A, or 10 μm as indicated
The number of cells containing small equally distributed CGRP formations within these pictures was similar between WT (34.1 ± 9.0) and Het (36.9 ± 6.6) but significantly different between WT and KO (56.1 ± 11.0, p = 0.025) (Fig. 4B). The number of all red cells was significantly different between WTs (15.8 ± 3.1) and KOs (6.7 ± 1.4) (p = 0.040) but not different between Het (10.0 ± 1.9) and the other genotypes (pWT: Het=0.214, pHet: KO=0.578) (Fig. 4C). The number of cells showing large formations of CGRP was not significantly different (p = 0.386) between WT (37.2 ± 4.4) and KO (25.4 ± 5.4), but showed larger variation. No significant difference was obtained when comparing number of cells showing the other localization patterns in different genotypes (small dots: pWT: Het=0.925, pHet: KO=0.059, circular formation: pWT: Het=0.127, pWT: KO=0.896, pHet: KO=0.255, large dots: pWT: Het=0.897, pHet: KO=0.555, polarized localization: pWT: Het=0.749, pWT: KO=0.600, pHet: KO=0.966) (Fig. 4D-F).
Furthermore, the relative distribution of each localization pattern within each genotype was analyzed (Fig. 5A). KO TGs contained the highest percentage of cells with small CGRP localizations (56%), Het the second most (37%) and WT the least (34%). The highest percentage of the large localization pattern was observed in WT TGs (37%) and the fewest in KO TGs (25%). Therefore, \(\:\beta\:\)CGRP, (the only isoform in KO TGs), mainly locate in smaller patterns while \(\:\alpha\:\)CGRP (predominant isoform in WT TGs) tends to localize in larger formations or cause the cell bodies to appear all red.
TG neurons isolated from Het mice, expressing both αCGRP and mnCre-EGFP (neurons with green nuclei where αCGRP is currently expressed) were counted to investigate cells known to specifically express αCGRP (Fig. 5B). In these cells CGRP was mainly observed to locate in large formations (44%). There was a significant difference between the number of cells containing CGRP in large formations (10.2 ± 2.4) compared to circular formations (2.2 ± 0.7, p = 0.005), compared to all red cells (3.2 ± 1.2, p = 0.014) and compared to polarized CGRP localization (2.2 ± 0.7, p = 0.005), but not compared to small formations (5.6 ± 2.5, p = 0.169). Combined, these data support that αCGRP both localizes in large formations within neuronal cell bodies, and contributes to the all red cells.
Fig. 5
CGRP localization pattern distributions in TGs of WT, Het and KO mice. (A) Pie charts showing the average percentage of different CGRP localization patterns in immunostainings of WT, Het KO TGs (each n = 5). (B) Pie chart showing the average percentage of different CGRP localization patterns in cells with EGFP in nucleus from immunostainings of five TGs from Het mice
KO mice subcutaneously injected with CGRP antibody still contain CGRP-positive TG neuronsKO mice were injected with 30 mg/kg CGRP monoclonal antibodies (fremanezumab), which would bind plasma ?CGRP, thus eliminating potential enteric βCGRP uptake in the TG. For these mice the IHC appeared similar between the antibody and saline treated animals (S8). No striking difference in either intensity or localization patterns were observed. For the percentage of CGRP-positive cells per neuronal cell bodies, no significant difference (p = 0.48) was found between the treated group (44.8 ± 6.6%) and the control group (39.0 ± 4.1%, Fig. 6A), indicating that ?CGRP, is synthesized within the TG neurons. Figure 6B shows a representative picture of a TG from a control and a fremanezumab treated mouse.
Fig. 6
CGRP-positive cells in mice injected with Fremanezumab or saline. (A) Graph showing percentage of CGRP-positive cells (D5R8F, red, alexa568) pr neuronal cell bodies in control mice (injected with saline (Veh)) compared to treated mice (injected with CGRP antibody (Frem)). No significant difference (ns) was observed between the two groups. (B) Examples of two immunostainings with CGRP antibody (D5R8F) and DAPI used for quantification. CGRP is shown in red and cell nuclei in blue. Scalebars are 100 μm
Both the CGRP observed in WT and KO TG neuronal cell bodies contain the CGRP sorting peptideThe above experiment showed that βCGRP observed in TG neurons is mainly or solely produced by the neurons themselves. To confirm this synthesis, IHC experiments with antibodies recognizing mature CGRP and the sorting peptide of pro-CGRP were conducted. Figure 7 shows examples of the resulting co-staining in a WT and KO mouse. All IHC results can be found in S9. Formations of a clear sorting peptide pattern can be observed within cell bodies which match the formations of CGRP. These patterns are observed in both WT and KO mice suggesting, that the two epitopes are present on the same peptide or peptides near each other in both genotypes. These results thus indicate that the sorting peptide is found together with the neuropeptide sequence within the neuronal cell bodies of KO mice and conclude that all or most βCGRP observed within TG neurons is produced by the neurons themselves.
Fig. 7
CGRP and CGRP sorting peptide localization within WT and KO mouse TG neurons. Examples of IHC of either WT or KO mouse TGs with an antibody recognizing the neuropeptide sequence of CGRP (D5R8F green, alexa488) and the sorting peptide sequence (42 cc, red, alexa568). White arrows point to signals that are seen in both colors. Overlapping signals appear yellow in the merged figures. The rightmost panel shows a sample cell (from the white squares). Scalebars are 50 μm–10 μm in the inserts
Mouse pre-pro-α- and pre-pro-βCGRP fold into similar secondary and tertiary structuresThe factors influencing protein localization are often embedded within the primary, secondary, or tertiary structure of the peptide. Since neither αCGRP nor βCGRP forms quaternary structures, the tertiary and secondary structures of both peptides were analyzed to determine whether their folding could provide insights into the observed differences.
The site Neurosnap predicted that both pre-pro--CGRP and pre-pro-?CGRP contain three alpha helices connected by unstructured elements (Fig. 8A). The first alpha helix, which is located at the N-terminal contains the signal peptide and is placed in an almost 90-degree angle compared to the rest of the peptide in both isoforms. When entering the sequences of pro-?CGRP and pro-?CGRP into Neurosnap, two similar structures were generated (Fig. 8B). Both structures contain two alpha helices, connected and flanked by disordered stretches. All hypothesized cleavage sites were predicted to localize within unstructured parts of the peptide (Fig. 8B). Tertiary structural differences between the two peptides do not seem to explain the differentiating localization patterns.
Fig. 8
Predicted tertiary structures of pre-pro-αCGRP and pre-pro-βCGRP. A) Tertiary structures of mouse pre-pro-\(\:\alpha\:\)CGRP and pre-pro-\(\:\beta\:\)CGRP produced by AlphaFold2 from the web page NeuroSnap. Colors indicate model confidence. B) Tertiary structures of mouse pro-\(\:\alpha\:\)CGRP and pro-\(\:\beta\:\)CGRP produced by AlphaFold2 from the web page NeuroSnap. Colors indicate model confidence. In green is highlighted PC2, CPE and PC1 cleavage sites
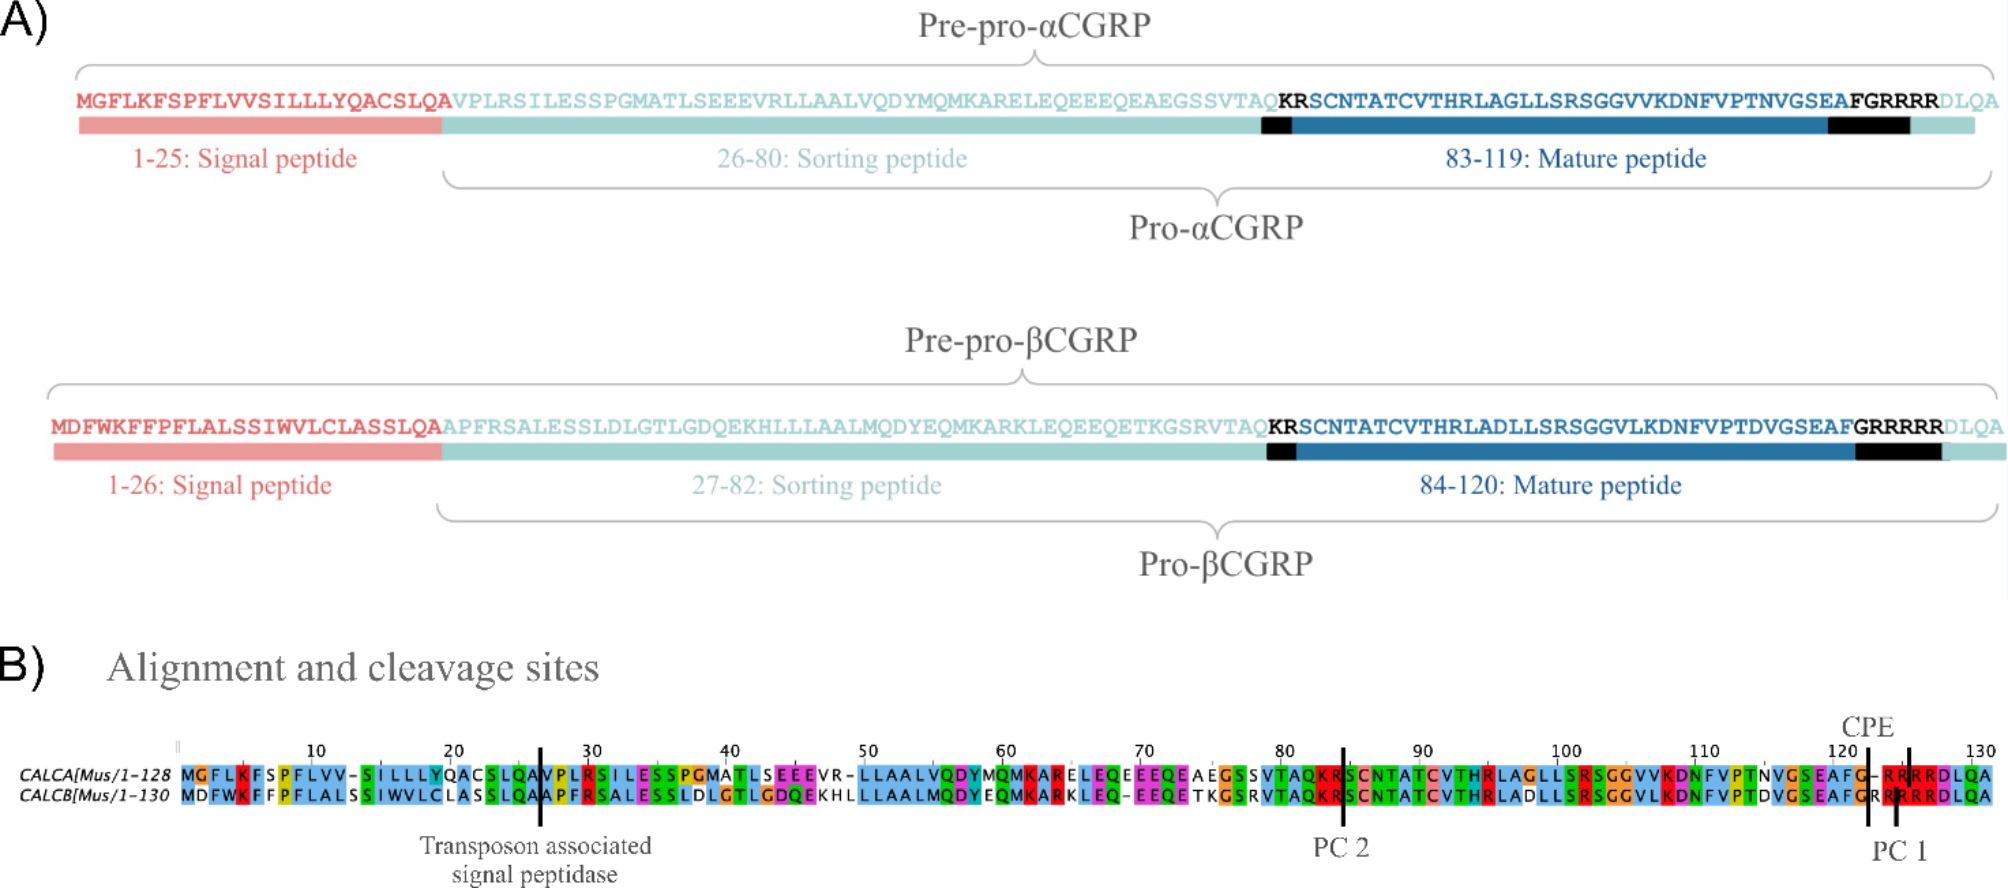
Mouse pro-α- and pro-βCGRP contain different sorting peptidesAs the analysis of αCGRP and βCGRP secondary and tertiary structure did not indicate significant differences, we examined the primary structures, to investigate potential differences. The hydrophobicity of pre-pro-?CGRP and pre-pro-?CGRP is highly similar from amino acid 83/84–128/130 (corresponding to the mature neuropeptide and C-terminal pro-peptide sequence) but differs more in the other parts of the sequence, as shown in the alignment of the amino acid sequences (Fig. 9A). Pre--ro contains more charged amino acid residues (npositively charged residues=18 and nnegatively charged residues=16) compared to pre-pro-?CGRP (npositively charged residues=14 and nnegatively charged residues=15).
Fig. 9
Alignments of pre-pro-αCGRP and pre-pro-βCGRP in multiple species. A) Alignments of mouse pre-pro-\(\:\alpha\:\)CGRP (CALCA) and pre-pro-\(\:\beta\:\)CGRP (CALCB) made with Jalview and colored to show similarity, hydrophobicity, charged residues and Clustal X default coloring. Dark blue indicates 100% similarity in the similarity coloring. Blue indicates hydrophobicity and red indicated hydrophilicity in the hydrophobicity coloring. Positively charged residues are colored blue and negatively charged residues are colored red in the charged residues coloring. A table describing Clustal X default coloring can be found in S10. B)-C) Alignments of (B) \(\:\alpha\:\)CGRP and (C)\(\:\beta\:\)CGRP precursors in different species. Alignments were produced in Jalview with MUSCLE with default and colored with Clustal. Alignments for \(\:\alpha\:\)CGRP was performed between mouse [Mus_musculus], human [Homo_sapiens], rat [Rattus_norvegicus], rhesus monkey [Macaca_mulatta] and zebrafish [Danio_rerio] \(\:\alpha\:\)CGRP precursors. Alignments for \(\:\beta\:\)CGRP was performed between mouse [Mus_musculus], human [Homo_sapiens], rat [Rattus_norvegicus], horse [Equus_caballus] and pig [Sus_scrofa] \(\:\beta\:\)CGRP precursors. The sorting peptide sequences are indicated
The pre-pro-peptides are highly similar from amino acid residue 83/84 to the C-terminal as shown by Clustal X Color Scheme (only three dis-similarities). The rest of the sequences have lower identity especially from amino acid 10–50, but some similarity in amino acid profiles. Interestingly, the sequences corresponding to the sorting peptides (26/27–80/82) are notably different. To investigate whether the mismatches in the sorting peptides are due to evolutionary insignificance of the sequences and therefore high mutation rate, or evolutionary significance for the biological function, alignments were made between pre-pro-αCGRP and -βCGRP sequences in 5 different species (Fig. 9B and C). The sorting peptides of αCGRP show high similarity while the sorting peptide of βCGRP varies more between species. In the alignment of pre-pro-αCGRP homologs, 21 instances of non-conserved amino acids and gap openings were identified (38%) where 29 (52%) were counted for pre-pro-βCGRP homologs. If only counting non-conservative amino acids (and gap openings), when the conservation is lacking in more than one species, only 9 instances are observed in pre-pro-αCGRP homologs (16%) where 20 are found in pre-pro-βCGRP homologs (36%). Furthermore, the long insertion in rat pre-pro-βCGRP is striking. These data show that the sorting peptide is more conserved in αCGRP (indicating biological importance) than in βCGRP (indicating less or no biological importance).
Differences in the sorting peptide give different isoelectric pointsSince the key difference between αCGRP homologs and βCGRP homologs is the primary structure of the pro-peptide, we hypothesized that there could be a key difference in their isoelectric points, which has been shown to be a key in peptide sorting and aggregation [32]. The isoelectric points of the pro-peptides before and after cleavage and modification by PC1, PC2, CPE and PAM were predicted by the Peptide Calculator (Bachem). Pro-αCGRP is predicted to have a lower isoelectric point than pro-βCGRP after losing the signal peptide (isoelectric pointpro-αCGRP=5.42, isoelectric pointpro-βCGRP=8.95) meaning that αCGRP would be positively charged in the acidic environment of the trans Golgi network while βCGRP would be negatively charged. This difference in overall charge is predicted to continue until the sorting peptide is cleaved off by PC2 where the isoelectric point of pro-αCGRP increases by 4.32 while the isoelectric point of pro-βCGRP increases by 0.84.
After this cleavage, both isoforms will be negatively charged in the trans Golgi network. This shows that the differing sorting peptides greatly affect the charge of pro-αCGRP and pro-βCGRP and constitute a key difference between the two isoforms. For the mature peptide, αCGRP has a higher isoelectric point than βCGRP (isoelectric point-αCGRP=9.15, isoelectric point-βCGRP=7.00). Under the assumption that the order of enzymatic reactions is PC1, CPE, PAM and CP2, as seen with amylin [33], αCGRP will thus initially be negatively charged in the acidic environment of the secretory pathway, whereas βCGRP will continue to be positively charged (Table 1).
Table 1 Isoelectric points of αCGRP and βCGRP at different maturation points. Isoelectric points of pro-α- and -βCGRP at different maturation steps. Red indicates a positive charge and blue a negative charge at pH∼6 equivalent to that of the trans golgi network
留言 (0)