Compared with people of the same age without functional dependence, people with functional dependence for basic activities of daily living (ADLs) are associated with a lower life expectancy (1, 2). Its prevalence is higher in women (48.2%) than in men (26.6%), increasing as the population ages, and it also shows a socioeconomic gradient (3, 4). Functional ADL dependence is also one of the main causes of institutionalization (5).
The Barthel Index is the most widely used test for assessing functional dependence for ADLs (6). This index is an assessment tool composed of 10 essential daily living activities, such as feeding, mobility, and personal hygiene, measuring an individual’s functional dependence level. Over time, modifications of the Barthel Index have been proposed. In his proposal, Granger (7) increased the number of activities evaluated to 15, creating two differentiated indexes: a self-care index and a mobility index. Shah (8) kept the 10 assessed activities in his proposal but increased the number of response options for each activity.
Functional dependence has many facets, so the list of activities, or response options for each activity, could be substantially increased. However, in line with Granger’s proposal, two facets account for all of them.
On the one hand, the capacity for self-care may have more to do with quality of life than survival expectations. However, self-care is an indispensable facet of one’s role as a person, being able to take care of oneself versus being cared for, independence versus dependence.
On the other hand, mobility affects a person’s social capital and quality of life: the independence to continue to be who one truly is in the society in which one exists is important. When the loss of mobility affects a person’s ability to leave the house or causes them to be dependent on a wheelchair, it also affects their survival.
The Barthel Index has amply demonstrated its usefulness in the evaluation of patients beyond its initial indication, which was to assess functional capacity. The Barthel Index score is a good risk indicator of the probabilities of hospital admission (9), complications during surgery (10), complications at hospital discharge (11), mortality at hospital admission (12), and mortality at hospital discharge (13, 14). The Barthel Index score is also a good indicator of risk outside the hospital setting, both in predicting the risk of complications in numerous medical processes that do not require hospitalization (15, 16) or in the predictive evaluation of the development of long-term frailty (17), as well as in decision-making in relation to institutionalization (5, 18). It is a good predictor of mortality in all these situations (19, 20).
It is also a good indicator of risk outside the hospital setting, both in the evaluation of the appearance of complications in numerous medical processes that do not require hospitalization (15, 16) or in the predictive evaluation of the development of long-term frailty, as well as in decision-making in relation to institutionalization (5, 18).
On the other hand, other factors influence functional deterioration, such as residing in a socioeconomically disadvantaged environment (21). In these environments, moreover, small differences in personal economic level imply not only a higher level of functional dependence but also a lower probability of survival (22, 23). In addition, a higher level of functional dependence, a factor reflecting lower intrinsic capacity, has also been associated with higher mortality (23, 24).
Finally, mobility, evaluated as the difference between maintaining the ability to leave home or living homebound, also affects survival, and higher mortality has been observed among people living homebound (25). Living homebound is often the result of multiple factors, among which being a woman and having a severe functional dependency play a relevant role (26, 27).
Nevertheless, much remains to be evaluated. The aging of the population means that the number of people with functional dependence is likely to increase, a situation that will lead to a greater need and demand for care. Both factors will have a negative impact on the costs of care, both health and social (28). The social trend towards healthy aging makes it necessary to study which factors adopt patterns and design networks that lead to dependency (29). Pre-frailty and frailty associated with dependence to perform basic and/or instrumental activities of daily living are risk factors for mortality. Therefore, heuristics are needed to address these networks in the initial phases with the aim of preventing functional dependence (30). When dependence is established, try to slow its evolution (17, 31). The Barthel Index is a highly useful tool in this process.
However, the Barthel Index was not designed for these functions. Therefore, studies are needed to analyze the validity of the Barthel Index in these new areas and determine whether improvements in this index are needed, especially in the assessment of mortality risk. In this context, whether self-care activities should have the same weight as activities involving mobility in the assessment of mortality risk should be established. Moreover, there are patterns that create networks within functional dependence. These patterns could include various stages in functional deterioration, from being an independent person who can perform basic and instrumental activities to being bedridden and dependent, and where certain activities, such as chair-to-bed transfer, would represent a stage prior to being bedridden and differentiated from the rest of the activities of the Barthel index. These aspects are important not only in health planning but also in social services.
This study aims to evaluate the predictive capacity of individual components of the Barthel index as markers of mortality risk compared with the composite index, focusing on the “chair-bed transfer” component. In addition, we will analyze whether changes in the Barthel index are necessary in relation to this mortality risk. Finally, the association of these variables with the level of functional dependence, economic income, mobility, and mode of living in the community will be analyzed.
Materials and methods Design and study populationThis prospective longitudinal study was conducted between June 2020 and August 2023 at the Orcasitas Health Care Center, Madrid (Spain). Orcasitas is a peripheral neighborhood located in south Madrid. At the social planning level, Orcasitas is considered a socioeconomically disadvantaged neighborhood. This neighborhood comes mostly from the relocation of people who lived in substandard housing or shantytowns or from people who suffered immigration into Spain due to economic problems in the decades after the Civil War. These characteristics, together with a low cultural level, potentially increase the fragility of these people and predispose them to functional dependence, as described above.
Orcasitas has a single health center that serves its whole population, which, in June 2020, was 22,452 people. Care is provided in person, at the user’s request, at home, or by telephone. The health center has a services portfolio common to the entire National Health System. This portfolio of services includes protocolized activities, including a functional dependency screening for the entire population over 70 years of age. This screening is also carried out for individuals of other ages when there is clinical suspicion of functional deterioration and for all individuals between 65 and 70 years of age who have been assigned a high level of intervention owing to comorbidities.
The criteria for inclusion in the study were being 65 years of age or older and having a Barthel Index score ≤ 60 points, a score established as the cut-off point in the Protocol for the Care of the Dependent Person. The study included the entire non-institutionalized functionally dependent population of the Orcasitas neighborhood that was registered in the “Primary Care Scorecard: Subjective, Objective, Evaluation and Plan” (e-SOAP) application of the Health System in May 2020. There were 150 patients in the Orcasitas cohort. Exclusion criteria were not being at home during the study period (n = 9), a situation defined as being in another home as a consequence of the COVID-19 pandemic (n = 3), or being admitted to a hospital or nursing home (n = 6) during the study period, so was the absence of Barthel in the last year (n = 5). Five patients refused to participate in the study, and four died before the start of the study. Overall, 127 patients participated in this study. The process followed from the initial approach to carry out this study to the development of the fieldwork is represented in the flowchart shown in Figure 1.

Figure 1. Flowchart of the process followed from the initial approach to carry out the study to the development of the fieldwork. Patient losses in the process and the cause of these losses are recorded.
Data collectionNurses who collected the data after the completion of the national confinement by COVID-19 in June 2020 received prior training to unify both the information conveyed to the participants and the possible answers to their questions. These nurses were unaware of the pre-confinement value of the patient’s Barthel index.
The data were obtained through a survey conducted by a trained nurse. The survey consisted of 48 questions. Participants were aware of the contents of the survey and could refuse to answer any question since confidential information was requested.
Functional dependence on the performance of ADLs was assessed via the Barthel Index. The data obtained were recorded in a database, and the score was classified according to the two most used methods. First, the score was classified according to the classic Barthel Index method, a method used by the Spanish National Health System’s Primary Care dependency protocol. This classification includes four levels of dependency: mild (Barthel Index score of 60 points), moderate (Barthel Index score of 40–55 points), severe (Barthel Index score of 20–35 points), and total dependency (Barthel Index score of <20 points).
Second, a second cut-off point was established at a Barthel Index score of 40 points, with two groups: severely dependent (Barthel Index score less than 40 points) and moderately dependent (Barthel Index score equal to or greater than 40 points). This criterion, which is also widely accepted among the scientific community, is recommended by the “Plan for attention to frailty and promotion of healthy longevity in the older adult in the community of Madrid” (32).
This procedure is justified by the coexistence of the two assessment systems in our practice, thus allowing better comparability and reproducibility of the results obtained in other studies.
The Individual Health Card (IHC) application was used to determine the income level of the population included in the study. This application establishes two categories: 1: an income level above 11,200 euros/year and 2: an income level below 11,200 euros/year. This cut-off point is established by the health system to differentiate the population according to economic income and to establish actions within health planning. An income level of less than 11,200 euros/year implies the receipt of free pharmacy services. This criterion is used as an indicator of the economic income level.
Orcasitas is a socioeconomically disadvantaged neighborhood, so the educational level was evaluated according to two categories: having received an education and not having received an education (illiterate; knowing how to read and write but not having received an education; and not having completed primary school).
The information systems of the Madrid Health Service were used to obtain the date of death of the participants who died during the three-year follow-up period. The professional who carried out this follow-up did not have access to the participants’ medical records or the data obtained from the surveys. At the same time, the health professionals participating in this study did not have access to the computer systems that recorded the date of death from the central services.
Finally, on the cohort, the effect of comorbidities, or of the social support associated with living independently or with others, has already been addressed in previous studies (22, 23). Therefore, this study will analyze this effect exclusively on the Barthel index activity or activities analyzed as a test to determine the risk of mortality. Following the criteria of the previously mentioned studies, five chronic diseases were taken as a cut-off point to evaluate the disease burden. Nutritional status was analyzed using the Body Mass Index (BMI). Finally, mobility was analyzed by means of instrumental activity, the ability to leave home, establishing a dichotomous assessment, leaving home versus living homebound.
Data analysis Descriptive analysesThe SPSS® 18.0 statistical package was used to analyze the data obtained. The normality of the data distribution was checked via the Shapiro–Wilk test. Given the small sample size in the male group, less than 30, to reconfirm this equality of variances, and where necessary, ANOVA was performed with Levene’s homogeneity test, applying Welch’s correction as a robust test of equality of means. In this study, a value of p < 0.05 was considered significant.
The Barthel index consists of 10 activities. The following criteria were used to facilitate subsequent comparisons with other studies. To analyze the impact of each activity on survival and mobility, the traditional classification established by Barthel was used. In parallel, the influence of these activities was described in the text and tables, using both the traditional criteria and the subdivision of these activities according to the model proposed by Granger (7), which consisted of activities associated with mobility (chair-bed transfer, going up and down stairs, dressing-undressing, and walking) and activities associated with self-care (the rest).
Regarding missing cases, failure to answer four or more survey questions (10%) was considered equivalent to being excluded from the study. When the number of unanswered questions within the same questionnaire, or missing data within the same participant, was less than four, the method used was discarded by pairwise deletion.
Bivariate comparisonsDifferences between continuous variables were analyzed via Student’s t-test or the Mann–Whitney U test, and differences between categorical variables were analyzed using the chi-square test. The probability of the occurrence of an event was analyzed via odds ratios (ORs).
In addition, a bivariate analysis was performed with all the variables included in this study to identify those associated with long-term survival. Variables that showed significant association (p < 0.05) were included in the survival analysis via Cox regression and a proportional hazards model. The resulting model was summarized via the estimated coefficients, p-values, and hazard ratios (HRs) with 95% confidence intervals.
Predictive modelsThe association between each of the activities included in the Barthel index and survival at three-year follow-up was analyzed using SPSS 18.0®. Following this analysis, the areas under the ROC curves for each of these activities were obtained. The selection criterion was an area under the curve (AUC) with statistical significance and a value greater than 0.700, with a lower confidence interval threshold greater than 0.500. Among those that satisfied this requirement, the activity that showed the highest AUC was selected, with the aim of determining the validity of its practical use as a test to detect the risk of mortality.
The selected activity was analyzed following two criteria: 1: using its extreme values, being independent versus being dependent for that activity. And 2: dichotomizing the activity, defining two groups: 1: “independent or requires minimal help” and 2: “dependent or requires great help.” A comparison was made as a diagnostic test against the Barthel index, and the same criteria were applied to this index in each case.
The Barthel index was used as the gold standard for comparing the risk of 3-year mortality associated with functional ADL dependence, a criterion justified by its recognized association with mortality, as reflected in numerous studies. The areas under the ROC curves of the two classifications of the Barthel index, classic four-level and summarized two-level, were obtained in relation to survival. At the same time, this procedure will make it possible to check whether the two methods of classifying functional capacity using the Barthel index are equivalent.
Other analyses were also performed. To analyze possible differences according to the level of dependence, the areas under the ROC curves of each activity included in the Barthel Index were also obtained for the groups of people with severe dependence and moderate dependence. The influence of the economic level on the results was also analyzed.
Model validationTo measure functioning as a test to determine mortality risk, the activities of the Barthel Index that met the criteria described were subjected to a functional assessment. The measures used to assess functioning were as follows:
1. Measures that evaluate the accuracy of a prediction (the sensitivity, specificity, positive and negative predictive values, positive and negative likelihood ratios, and the posttest probability for both a positive and negative result) were determined via the statistical calculator of the Regional Health Service of Murcia (available at https://www.murciasalud.es/pagina.php?id=35022&idsec=2).
2. Measures that evaluate the discrimination capacity (the areas under the ROC curves and ORs) were obtained in relation to survival. The areas under the ROC curve were compared via the DeLong method with the Epidat 3.1 statistical package.
3. Measures that evaluate the calibration of the test (the model’s goodness of fit) were evaluated via binary logistic regression with the Hosmer–Lemeshow method. Using multinomial regression, Cox and Snell’s R2 and Nagelkerke’s R2 statistics were calculated to estimate the proportion of the variance in survival explained by the predictor variables. The concordance C index was also calculated to establish the degree of certainty that the test assigned a greater risk of a negative event (mortality) according to the ROC curve among participants with “dependence” in the Barthel Index activities who met the inclusion requirements. The C-index usually ranges between 0.6 and 0.85 in a prognostic risk model; the higher the value is, the closer it is to being a diagnostic criterion. Similarly, the Akaike information criterion (AIC) was used to identify the significant predictors in the model.
Post-hoc analysisPost-hoc analyses were performed to establish the percentages of variance in relation to survival explained by each variable, and predictive models were developed based on these results.
Ethics statementAll participants were previously informed of the objectives of the study and the publication of the results. After agreeing to participate in the study, they signed the informed consent form, leaving a copy with the patient. The database was anonymized before data analysis.
This study was approved by the Local Research Commission of the Assistance Directorate Center, dependent on the Primary Care Management of the Department of Health of the Community of Madrid (Spain; resolution 16/20-C-Bis of June 29, 2020). The Ethics Committee of the Hospital Universitario Doce de Octubre endorsed this as sufficient approval (resolution 23/501 of September 26, 2023).
ResultsDuring the three-year follow-up period, 40.9% (n = 52) of the ADL-dependent individuals in this cohort died. Regarding the two levels of dependency for basic ADLs according to the abbreviated Barthel Index classification, 65.8% (n = 25) of the participants with severe dependence (n = 38) and 30.3% (n = 27) of those with moderate dependence (n = 89) died in 2020–2023 (HR 2,227; CI 1,514-3,276). However, among the participants who died, 48.1% (n = 25) had severe dependence for ADLs (Barthel Index score less than 40 points), and 51.9% (n = 27) had moderate dependence for ADLs (Barthel Index score of 40–60 points). According to the traditional classification of the Barthel Index, from 2020 to 2023, 78.9% (n = 15) of the participants with total dependence (n = 19), 52.6% (n = 10) of those with severe dependence (n = 19), 32.6% (n = 15) of those with moderate dependence (n = 46) and 27.9% (n = 12) of those with mild dependence (n = 43) died.
Functional dependence was assessed via the Barthel Index. This index consists of 10 items that assess various ADLs. When the association of each of these activities was analyzed with respect to survival at the three-year follow-up, “chair-to-bed transfer” was the activity that showed the highest association (Table 1). This activity also had the greatest area under the ROC curve (area 0.731; CI 0.642–0.820). Therefore, this Barthel Index activity was selected for specific analysis as a mortality risk factor.
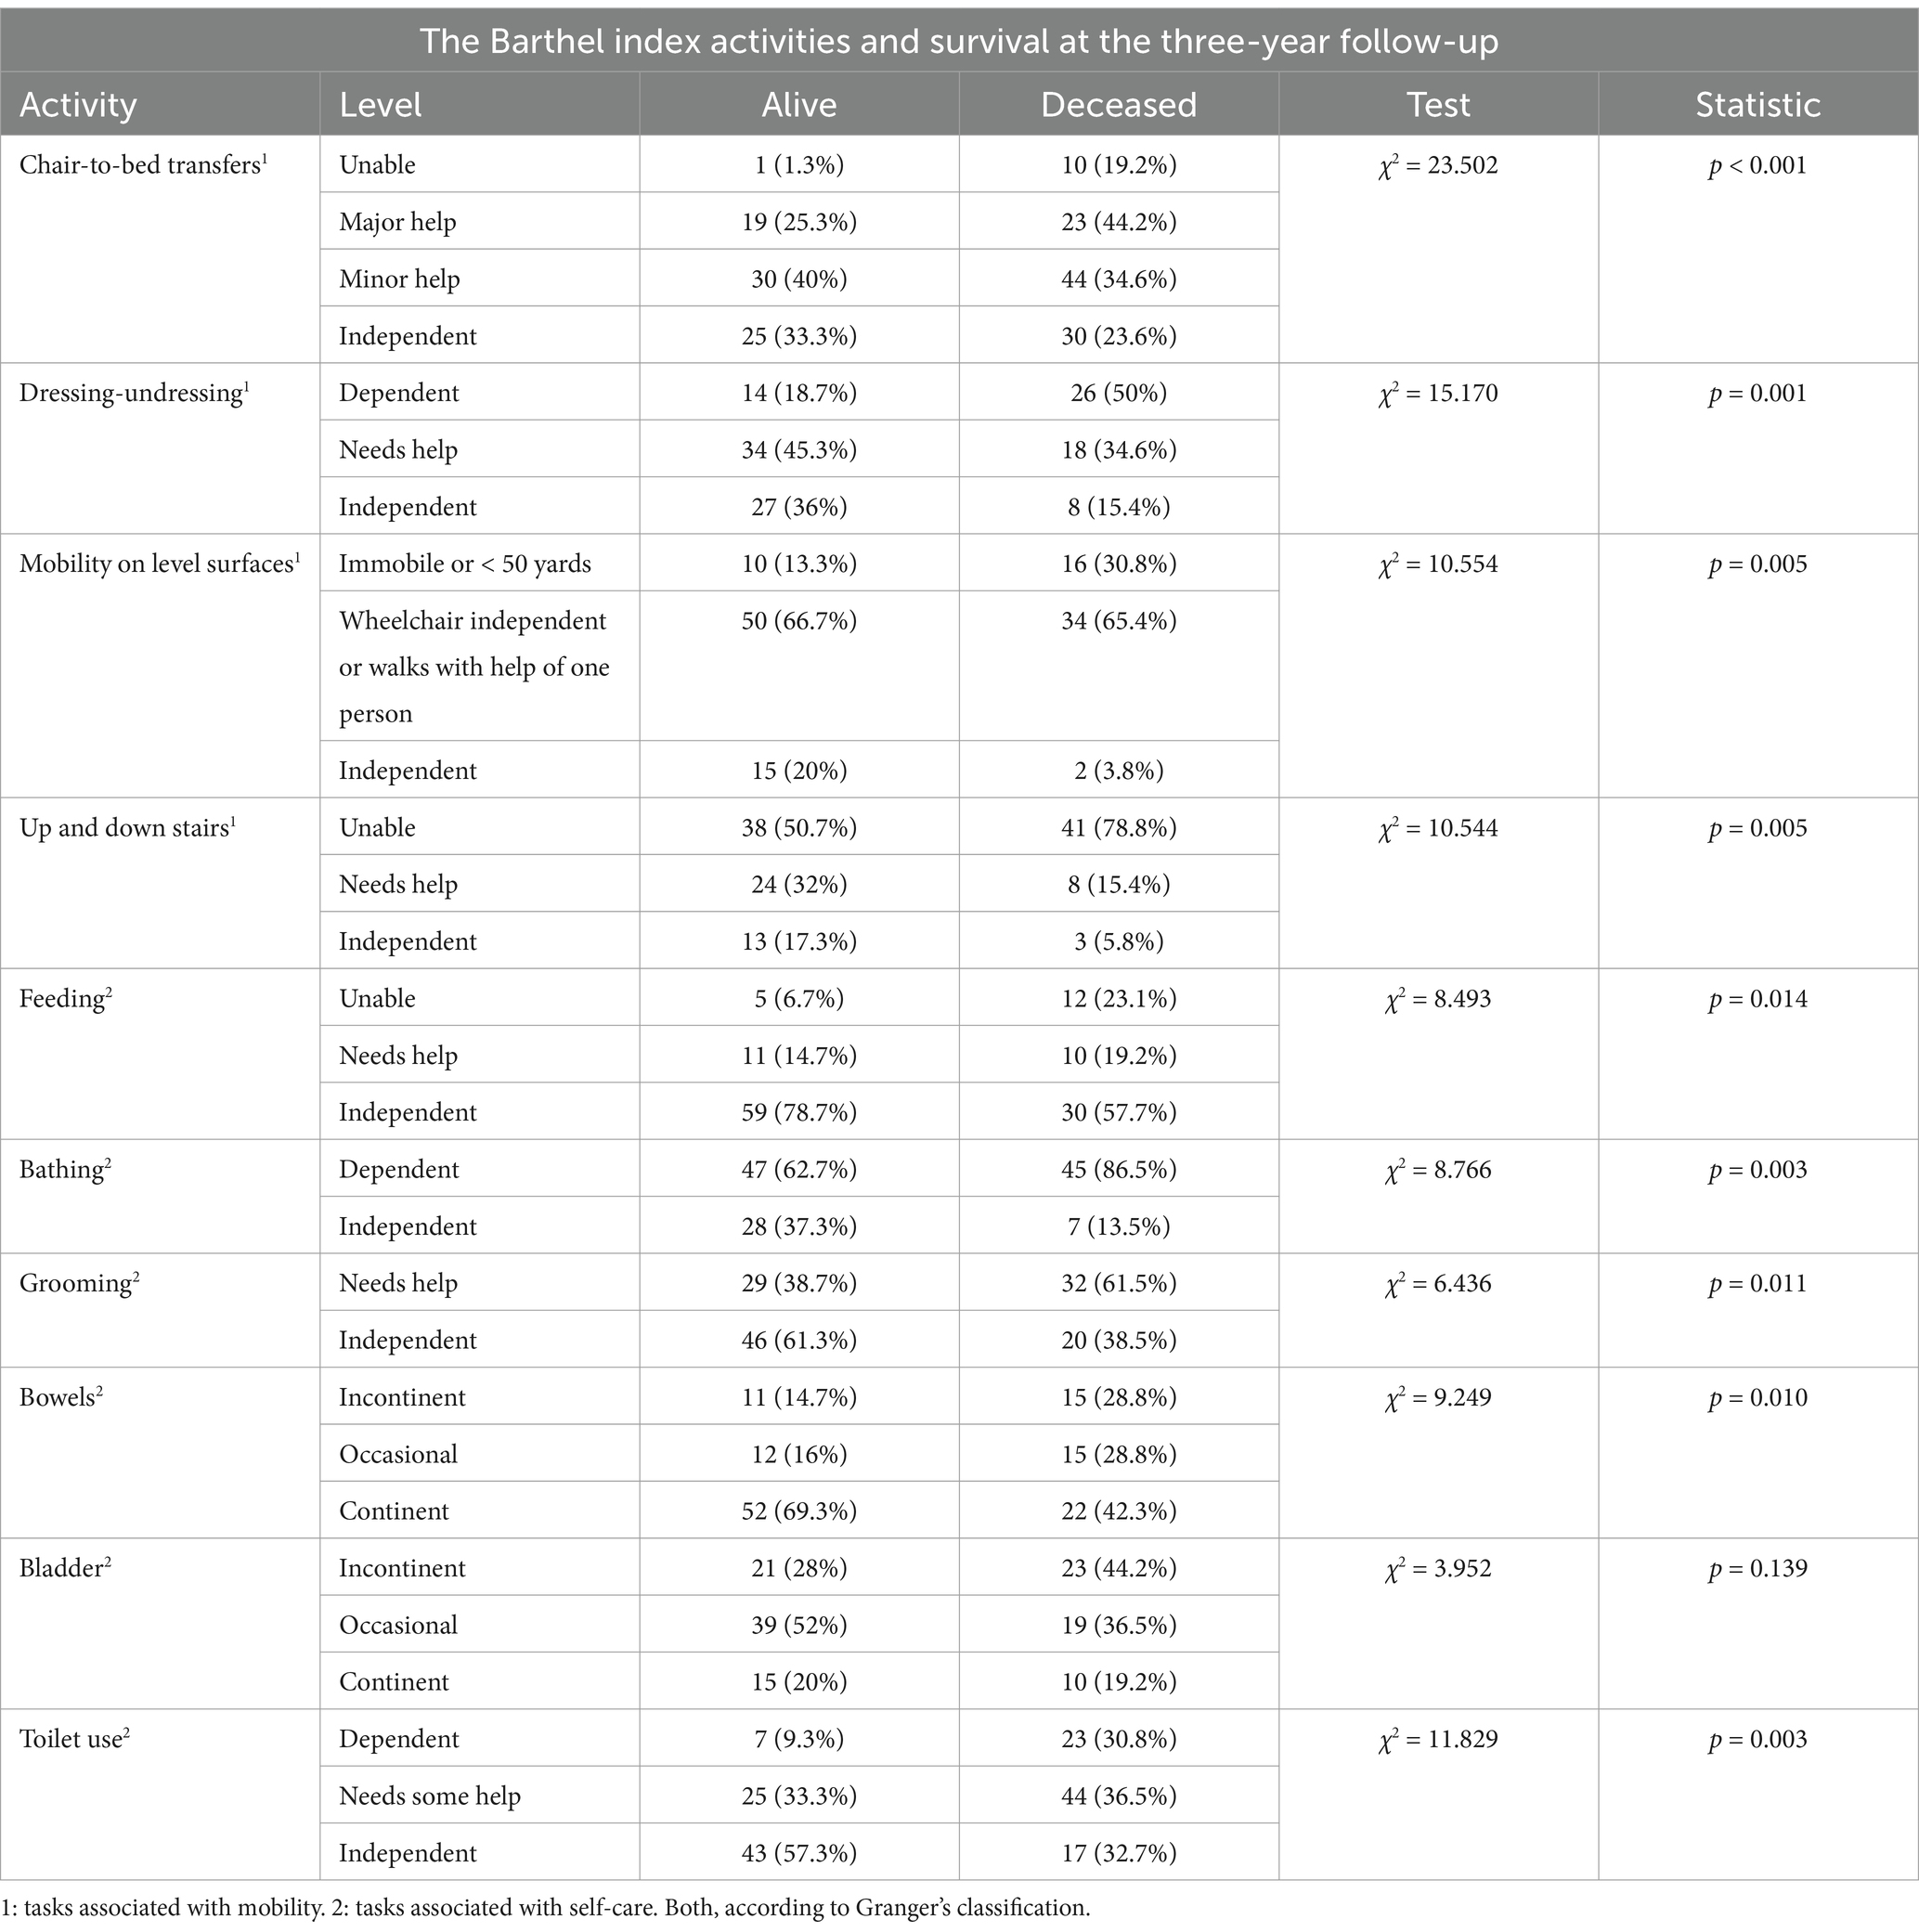
Table 1. Activities of daily living assessed by the Barthel index and survival at the three-year follow-up in relation to the level of dependence for each activity.
Participants fully dependent on ‘chair-bed transfers’ exhibited the highest mortality rate (90.9%), significantly higher than those requiring great assistance (54.8%), those who required minimal assistance (31.8%), or those who were independent (16.7%).
Within the group of people with total functional dependence (n = 19; Barthel Index score < 20 points), 36.8% (n = 7) were also dependent for “chair-to-bed transfers,” whereas the remaining 63.2% (n = 12) were not dependent for this activity. Among the participants in this group who died, 60% (n = 9) had total functional dependence but were not dependent on chair-to-bed transfers. The remaining 40% (n = 6) had total functional dependence and were dependent on other people to perform chair-to-bed transfers.
From 2020 to 2023, regarding the different activities included in the Barthel Index (Table 1), the mortality risk was not homogenous. The percentages of participants with dependence for performing each activity who died are as follows: feeding (70.6%), using the bathroom (69.6%), dressing-undressing (65%), mobility on level surfaces (61.5%), going up and down stairs (51.9%), bathing (48.9%), grooming (52.5%), bowel incontinence (57.7%), and bladder incontinence (52.3%); these percentages were lower than that observed among people with dependence for chair-to-bed transfers (90.9%).
Finally, among the participants who were dependent on others to perform chair-to-bed transfers, a high level of codependence was observed with respect to other activities of the Barthel Index. In relation to activities associated with self-care, the observed percentages of participants with dependency for each activity were 72.7% for “feeding,” 100% for “bathing,” 90.9% for “urinary incontinence,” 81.8% for “bathroom use” and “grooming,” and 72.7% for “fecal incontinence.” Among the activities associated with mobility, the percentages of participants were 100% for “mobility on level surfaces,” “up and down stairs,” and 90.9% for dressing-undressing (Table 1).
This implies a high mortality rate in persons who have a dependence on multiple activities. Regarding dependence on chair-to-bed transfers and dependence on another activity of the Barthel Index, the percentages of deaths associated with other activities were 87.5% (n = 7) for “feeding,” 90.9% (n = 10) for “bathing,” 88.9% (n = 8) for “bathroom use” and “grooming,” 90% (n = 9) for “urinary incontinence,” and 87.5% (n = 7) for fecal incontinence. Among the activities associated with mobility, the percentages of participants were 90.9% (10) for “mobility on level surfaces” and “up and down stairs” and 90% (n = 9) for dressing-undressing.
However, among participants who were not dependent on chair-to-bed transfers but were dependent on another activity, the risk of mortality was lower. Specifically, the percentages of deaths associated with self-care activities were 55.6% (n = 5) for feeding, 43.2% (n = 35) for bathing, 57.1% (n = 8) for bathroom use, 46.2% (n = 24) for grooming, 41.2% (n = 14) for urinary incontinence, and 44.4% (n = 8) for fecal incontinence. For activities associated with mobility, the percentage of deaths was 45.6% (n = 31) for going up and down stairs, 56.7% (n = 17) for dressing-undressing, and 40% (n = 6) for mobility on level surfaces.
In the second step, the use of the “chair-to-bed transfer” factor as a test for the assessment of mortality risk was analyzed. As a criterion for “healthy” or “not exposed,” the situation of “independently performing chair-to-bed transfers” was used. In addition, being “dependent for chair-to-bed transfers” was used as the criterion for “sick” or “exposed.” The outcome of the test was measured in terms of survival or death.
Analysis of the “chair-to-bed transfer” factor as a diagnostic test for mortality risk revealed that the test had a high sensitivity and specificity for predicting mortality risk and a high negative predictive value, with a positive likelihood ratio of 5.45 and a negative likelihood ratio of 0.11 (Table 2). These results translate to a predictive accuracy that can be considered “good.”
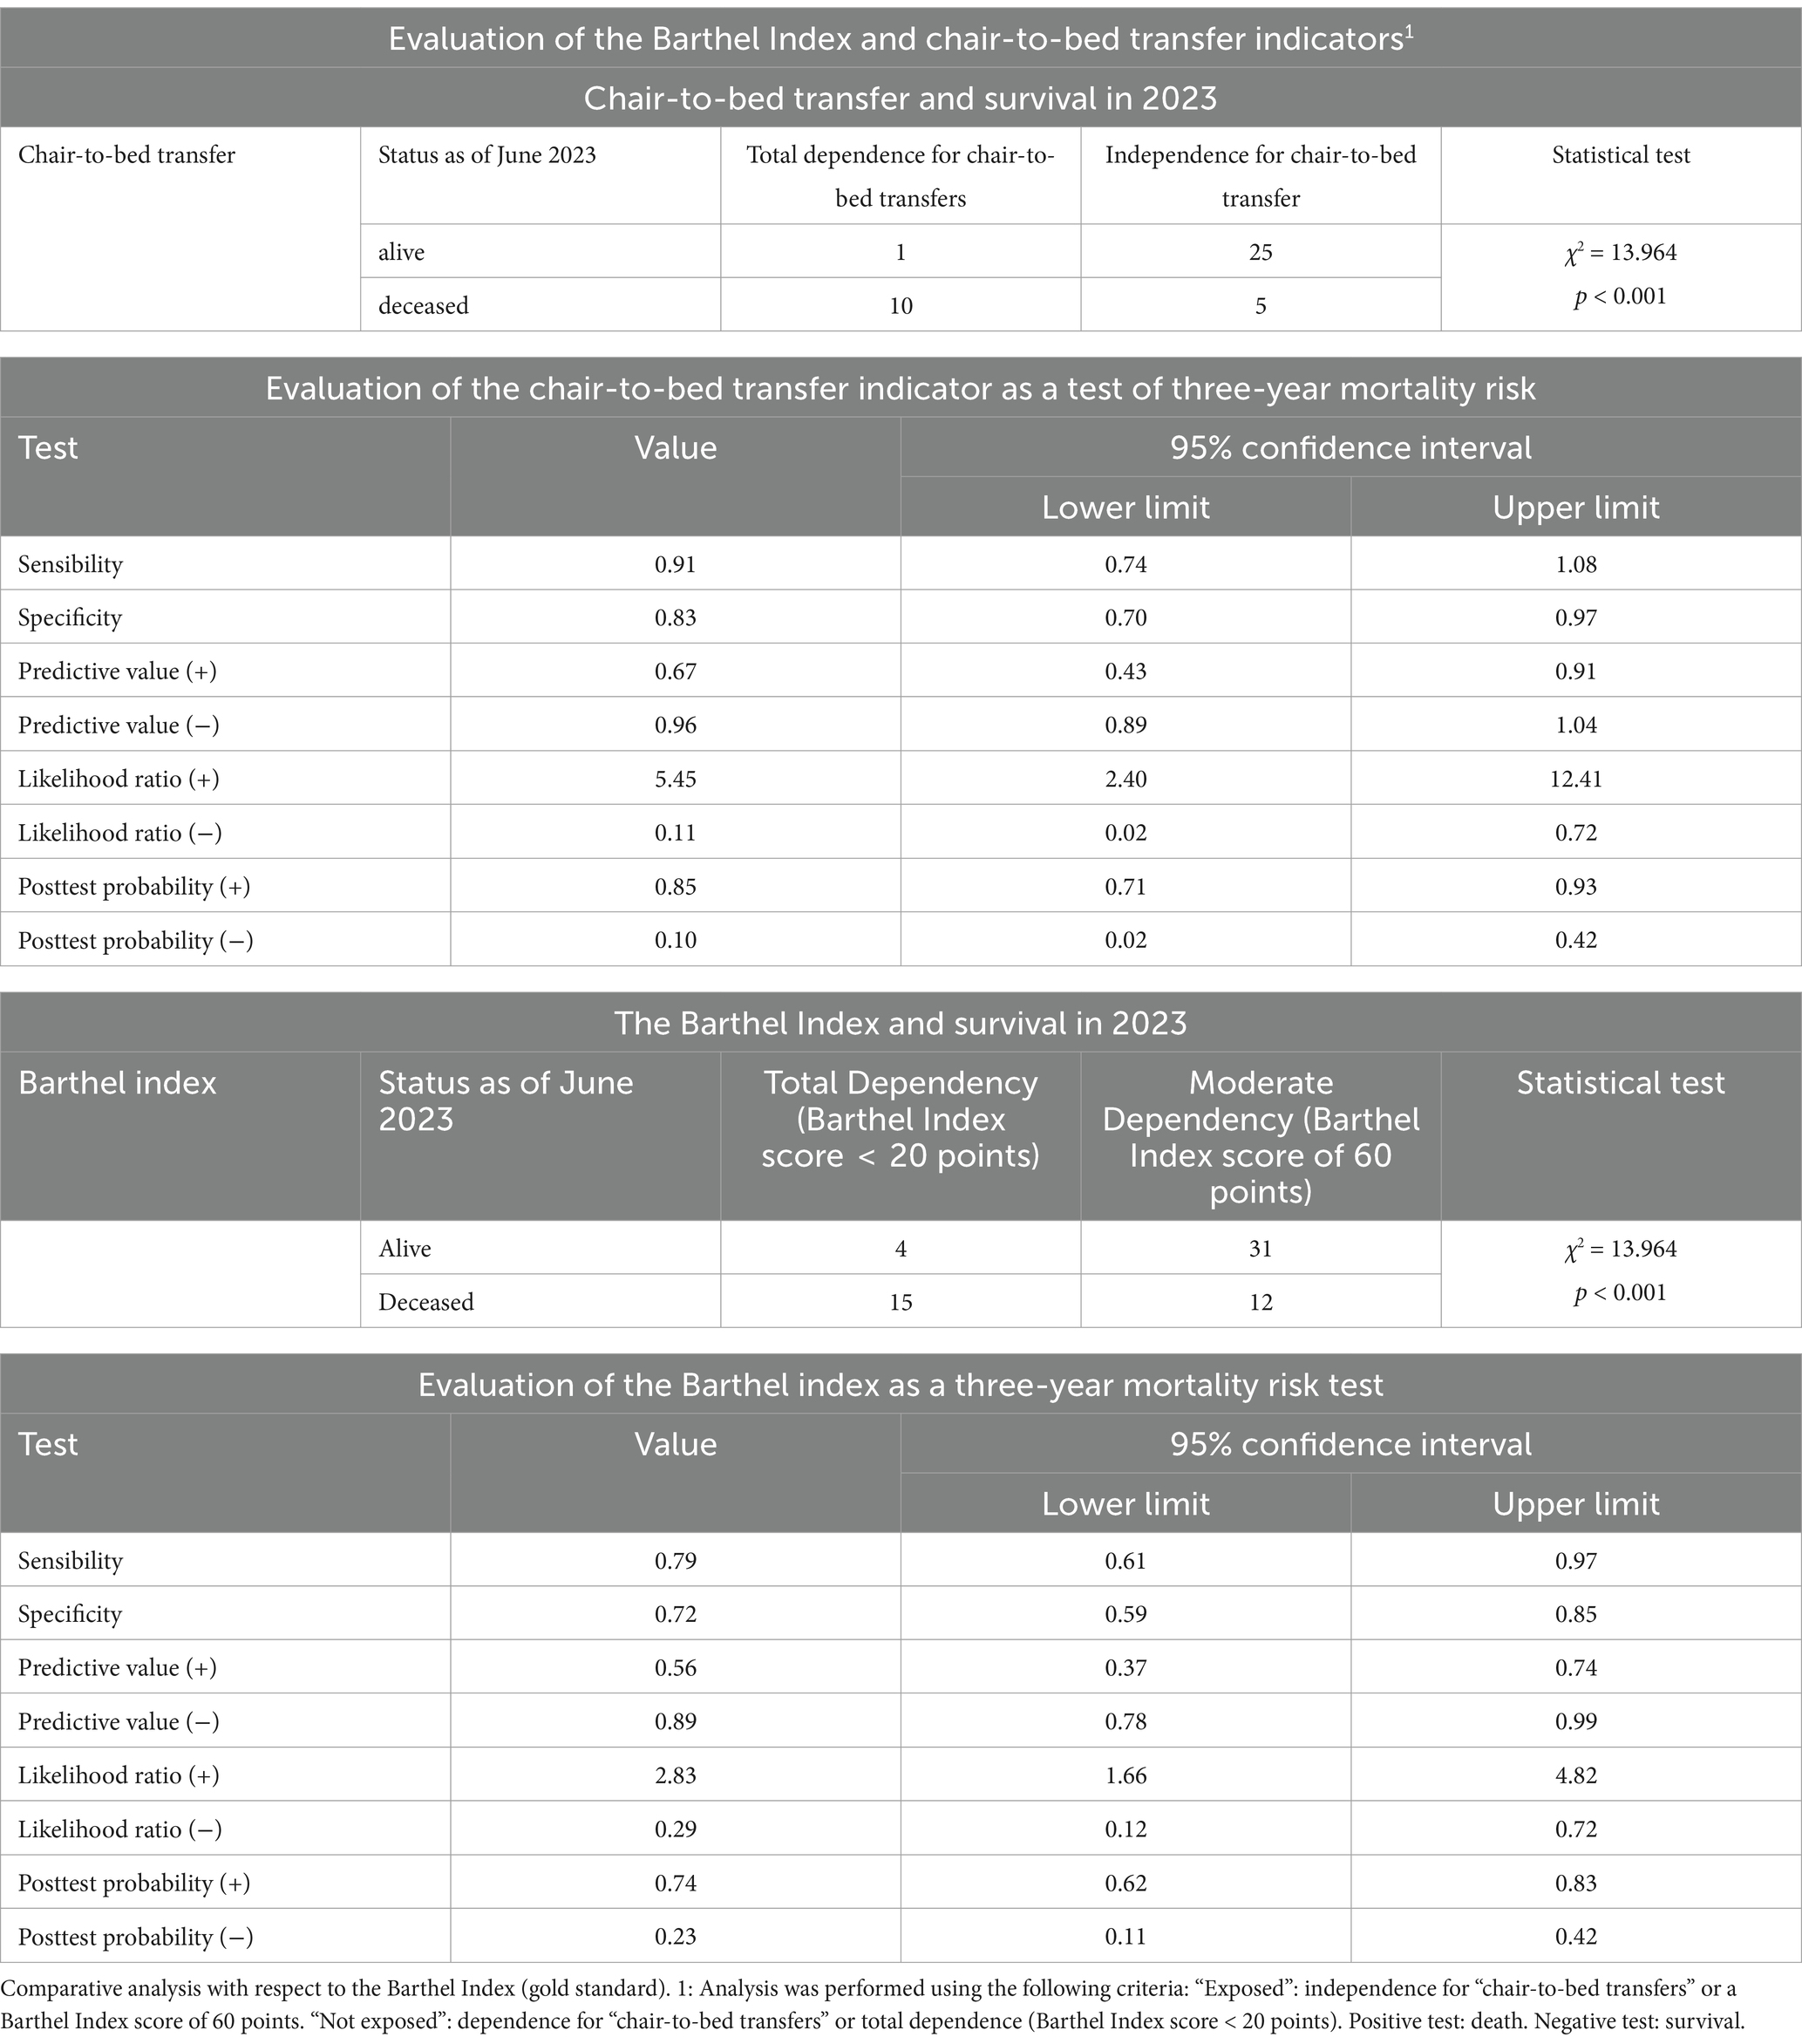
Table 2. Analysis of the “chair-to-bed transfer” indicator as a diagnostic test for mortality risk.
After performing this analysis, the discriminatory capacity of this factor as a diagnostic test was analyzed via the area under the ROC curve, which revealed an area of 0.814 (CI 0.658–0.970; p = 0.001; Figure 2). Compared with being dependent, being independent on others to perform “chair-to-bed transfers” was associated with a lower risk of mortality at the three-year follow-up (OR 0.020; CI 0.002–0.193). The result obtained indicated that their discrimination capacity was good.
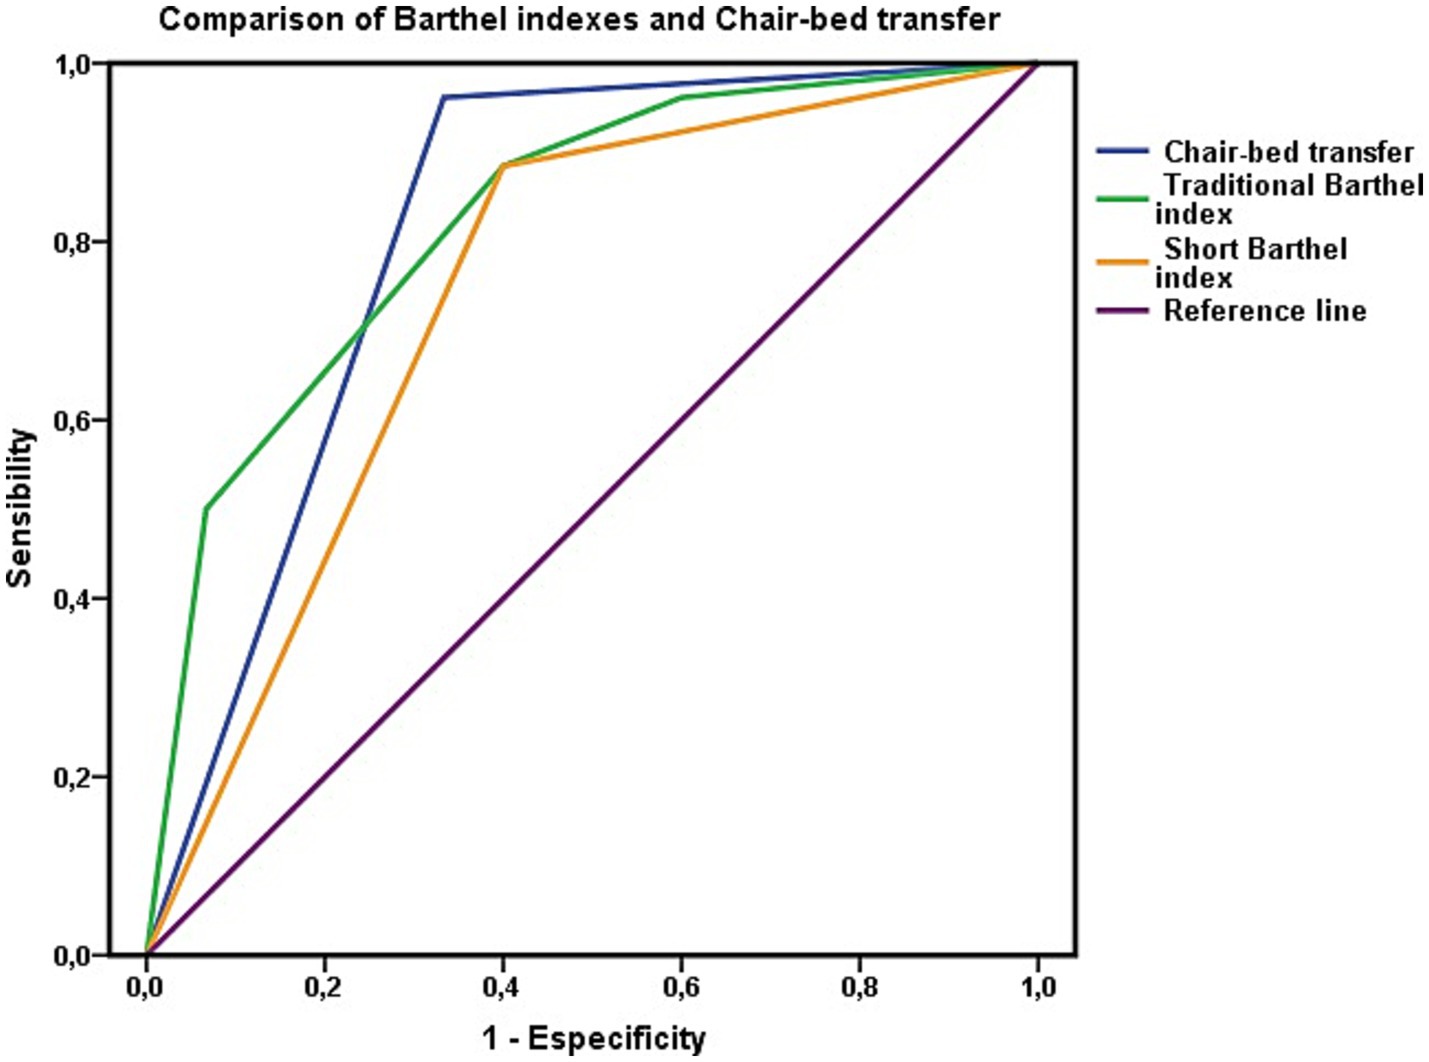
Figure 2. Evaluation of the ability to discriminate mortality risk using the area under the ROC curve for the “chair-to-bed transfer” factor. The areas under the ROC curve of the Barthel index in its traditional and summary versions represent the dependency to perform basic activities of daily living of people who are dependent or independent to perform the “chair-to-bed transfer.”
Finally, the calibration of the test was evaluated via the Hosmer–Lemeshow test, which yielded a χ2 value of 0.235 (p = 0.889, very close to 1). The Cox and Snell R2 values showed that the model explained 38.8% of the variance in survival, whereas Nagelkerke’s R2 value explained 53.1% of this variance. The concordance C index was 0.814.
The capacity of the variable “chair-to-bed transfer” to assess mortality risk was contrasted with the gold standard, the Barthel Index score (Table 2). Following the same criteria as in the previous step, two levels of the Barthel Index were used for comparison. These levels were “total dependence” (Barthel Index score < 20 points), defined as “total dependence to perform chair-to-bed transfers,” and “mild dependence” (Barthel Index score of 60 points), defined as “independence to perform chair-to-bed transfers.” At the mild dependency level of the Barthel Index (Barthel Index score = 60 points), no person was dependent on “chair-to-bed transfers.”
In the determination of mortality risk, the Barthel Index has lower sensitivity and specificity and a high negative predictive value. The test revealed that the Barthel Index had a positive likelihood ratio of 2.83 and a negative likelihood ratio of 0.29, and its rating was regular. The accuracy of the index in predicting mortality risk was lower than that of the chair-to-bed transfer factor. In relation to the predictive ability of the index (Figure 3), the area under the ROC curve was 0.721 (CI 0.587–0.855; p = 0.001), so its discriminatory capacity was regular.
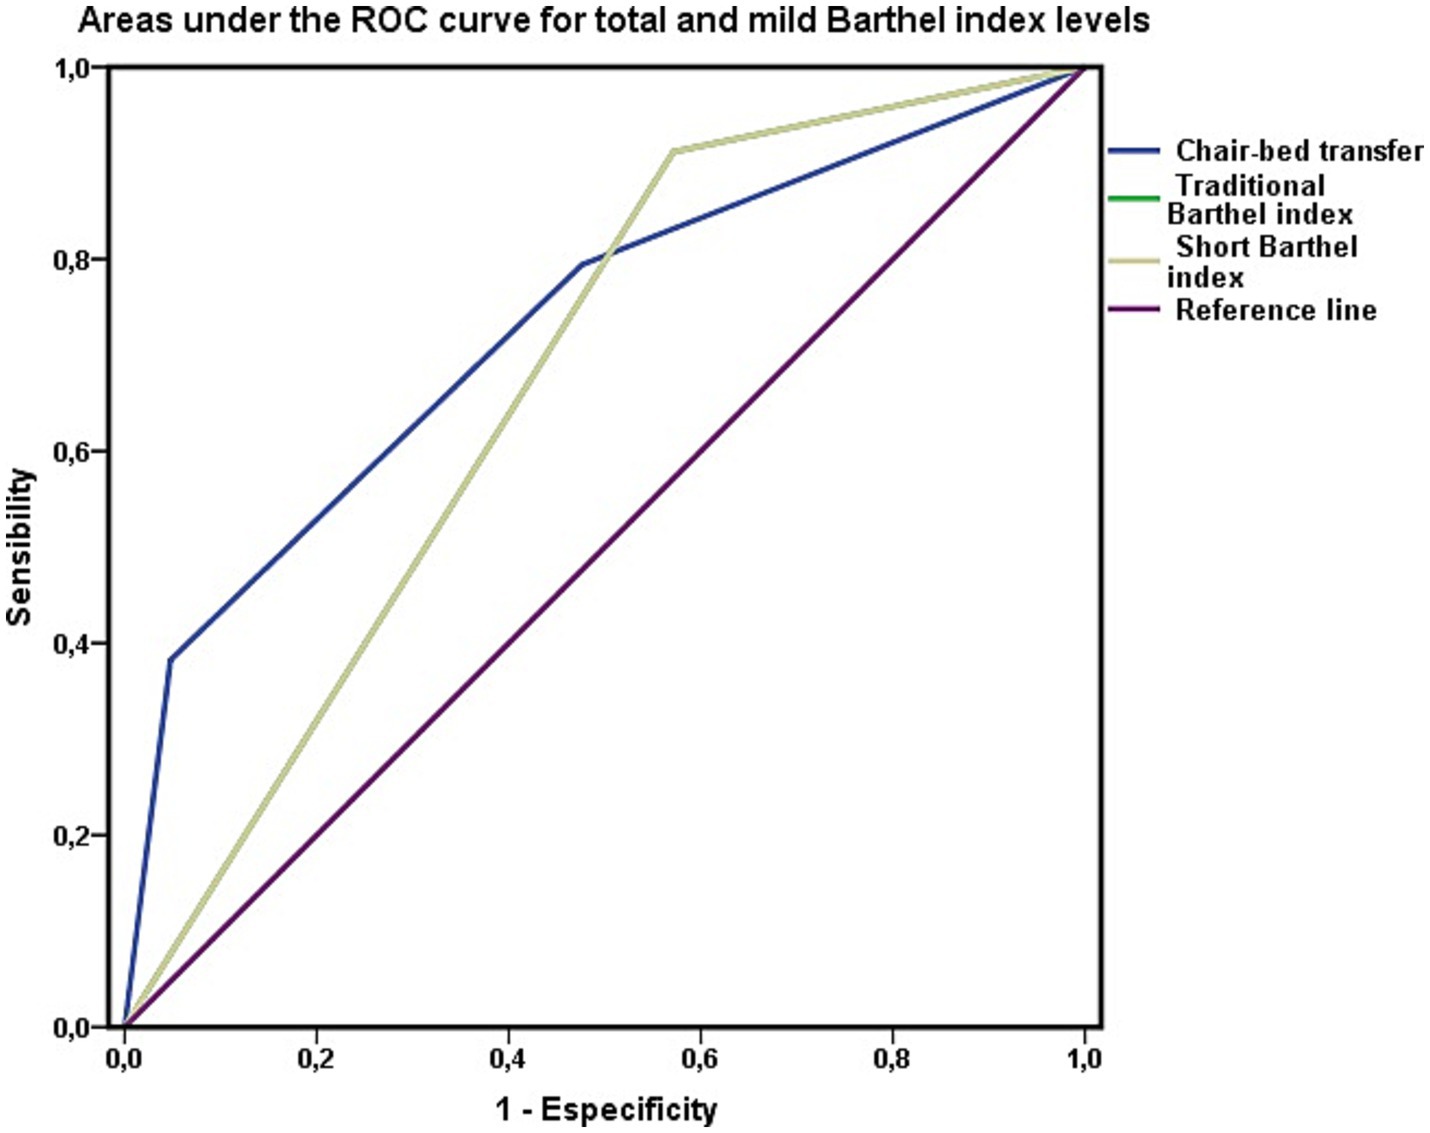
Figure 3. Barthel index as a test to discriminate mortality. Areas under the ROC curve of the total (Barthel <20) and mild (Barthel 60) levels of the Barthel index in persons not dependent for chair-to-bed transfer. The area under the ROC curve of the variable “chair-bed dependence” represents exclusively persons who require great help to perform this activity, require minimal help, or are independent in its performance.
Finally, for the calibration of the Barthel Index, the Hosmer–Lemeshow test yielded the following results: χ2 = 0.149 and p = 0.928. The Cox and Snell R2 values showed that the model explained 27.2% of the variance in survival, whereas Nagelkerke’s R2 value explained 36.5% of that variance. The concordance C index was 0.792. These results revealed a lower performance of the Barthel index as a test for assessing mortality risk.
These results suggested that the Barthel Index performed worse in assessing mortality risk than the chair-to-bed transfer factor alone. However, when the areas under the ROC curve were compared via the DeLong method, the large difference observed between the areas calculated for both variables, the chair-to-bed transfer factor and the Barthel index, was not significant (χ2 = 0.171; p = 0.279). Thus, in terms of predictive capacity, we can only consider a trend, with the remaining parameters analyzed, marking the differences that may have clinical utility.
Along these lines, we visually analyzed the impact of the chair-to-bed transfer factor on the Barthel Index (Figures 2, 3). In Figure 2, the area under the ROC curve for the Barthel Index was calculated among people who were dependent on chair-to-bed transfer or independent of this activity. This figure thus represents the influence that dependence-independence for chair-to-bed transfers has on the Barthel index.
In Figure 3, the area under the curve for the Barthel Index was calculated among people who had total (Barthel Index score < 20 points) or mild (Barthel Index score of 60 points) functional dependence, without incorporating persons who were dependent for chair-to-bed transfers in this calculation. This represents the difference between being mildly or dependent according to the Barthel Index, discounting the effect of being dependent for chair-to-bed transfers.
Finally, as shown in Figure 4, the areas under the curve of both the Barthel Index model and the “chair-to-bed transfer” factor were analyzed for the entire cohort, without excluding any patients, to determine their predictive capacities in common clinical practice. The four classification levels of both the chair-to-bed transfer factor and the Barthel Index are represented in this figure.
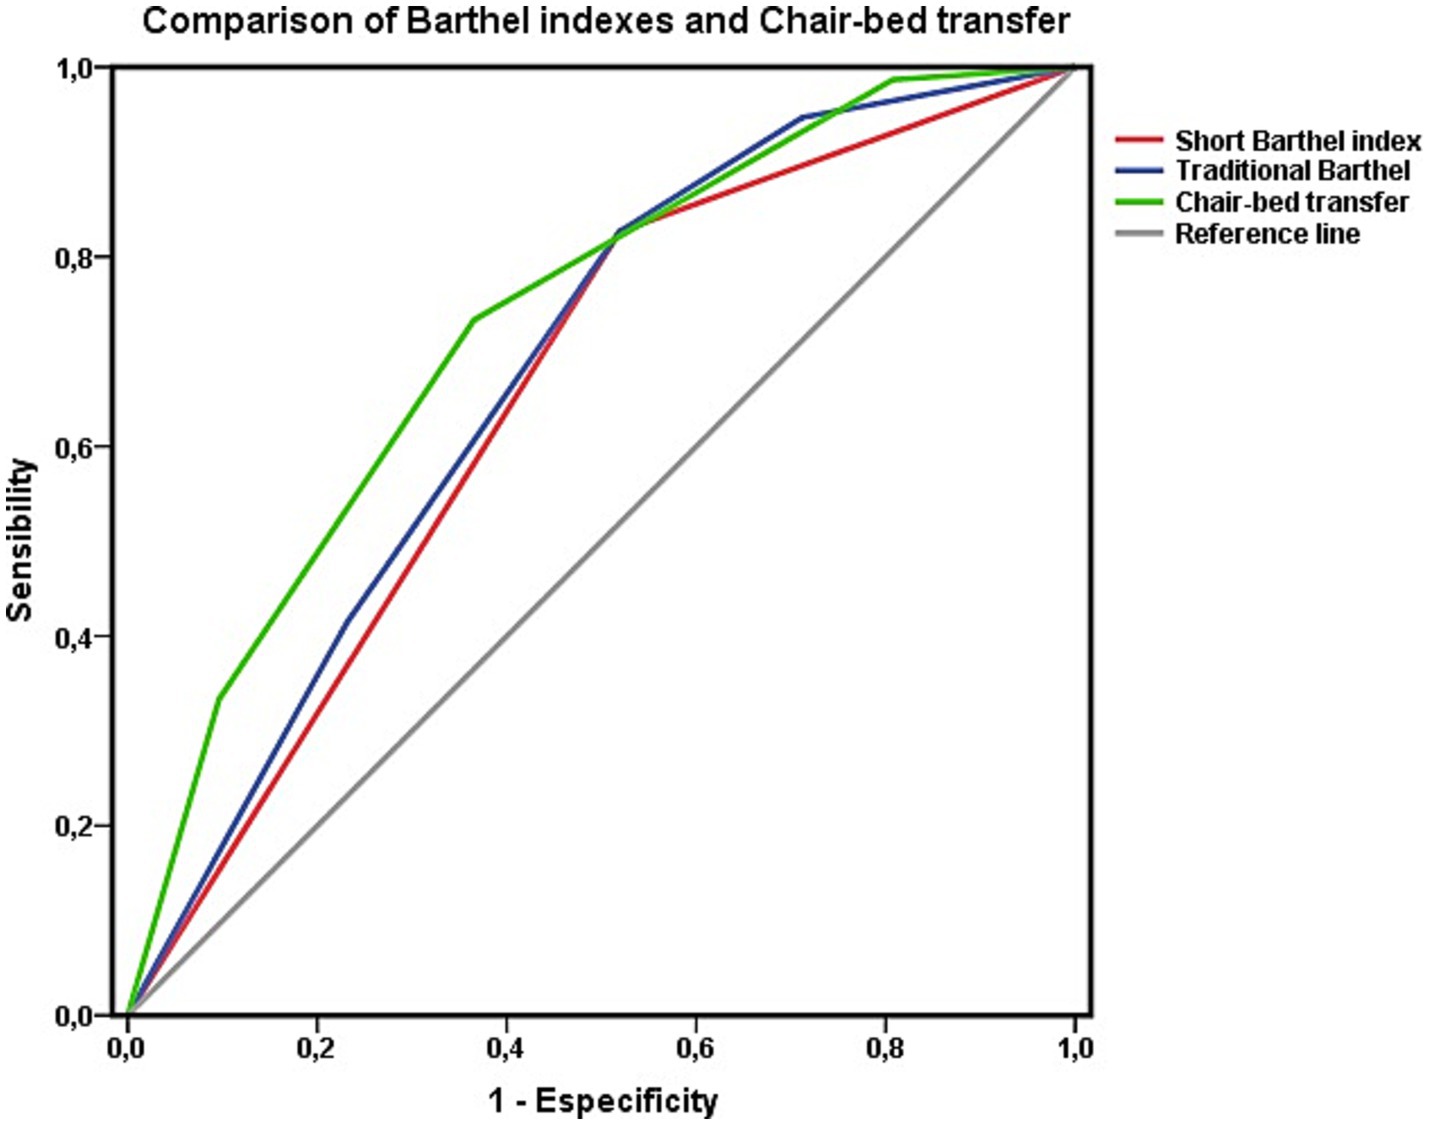
Figure 4. Areas under the ROC curve of the Barthel index estimated using the traditional four-level classification and the abbreviated two-level classification with respect to survival at 3 years. Comparison with the item “chair-to-bed transfer. Data for the whole cohort.
A survival analysis was performed via Cox regression to complete this analysis. This analysis revealed that being independent for “chair-to-bed transfers” was associated with a lower risk of mortality at the 3-year follow-up (HR 0.459; CI 0.331–0.638). The risk of mortality increased as dependence on this activity increased, and mortality associated with needing great assistance to perform “chair-to-bed transfers” was also relevant. No significant differences were observed between the “independent” and “need minimal assistance” levels (Figure 5).
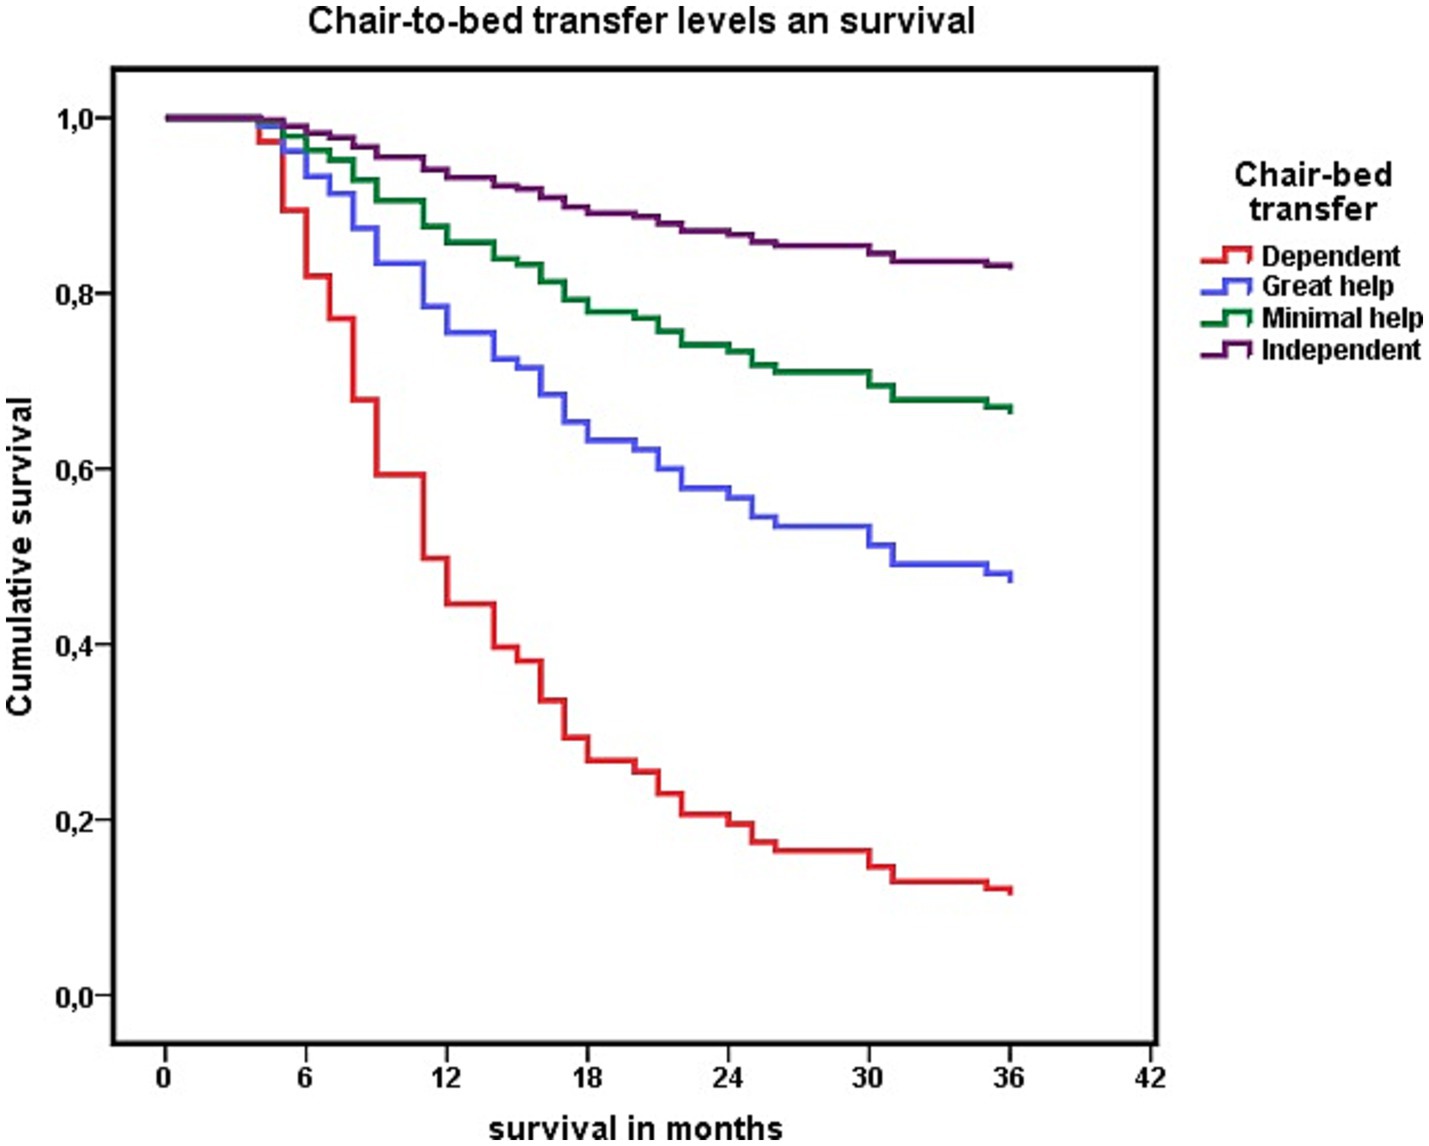
Figure 5. Cox regression analysis of the association between each level of dependency to perform “chair-to-bed transfers,” and survival at 3 years.
These results led us to consider dichotomizing the “chair-to-bed transfer” activity into two profiles: 1: “being dependent or needing great assistance from others to perform chair-to-bed transfers” and 2: “being independent or requiring minimal assistance to perform chair-to-bed transfers.”
Dichotomizing the activity “chair-to-bed transfer” into the two options described, being “dependent or needing great assistance to perform chair-to-bed transfers,” was associated with an increased risk of mortality (HR 2.957; CI 1.678–5.211). Among the participants who died in these 3 years, 63.5% (n = 33) were “dependent or needed great assistance to perform chair-to-bed transfers.” Among those who were “independent” for this activity or “required minimal assistance” (n = 74), 36.5% (n = 19) died.
When this result was cross-checked with the second diagnostic test, the summary version of the Barthel index, among people with severe functional dependence (n = 28; Barthel Index score < 40 points) and “dependence or need for great assistance in chair-to-bed transfers,” 75% (n = 21) died in the 3 years (2020–2023). Among people with moderate functional dependence (n = 25; Barthel Index score of 40–60 points), 48% (n = 12) of those with “dependence or the need for great assistance” for chair-to-bed transfers died during this three-year period, whereas 23.4% (n = 15) of those who were not dependent or required minimal assistance died (OR 0.332; CI 0.125–0.879).
The distribution of mortality in relation to the level of functional dependence assigned according to the classic Barthel Index was also relevant. A total of 28.3% (n = 15) of the persons with “dependence or the need for great assistance for chair-to-bed transfers” had moderate functional dependence (Barthel Index score of 40–55 points). In addition, 18.9% (10) of the participants had a mild level of functional dependence (Barthel Index score of 60 points). Among those with moderate functional dependence who were also dependent or needed great assistance for “chair-to-bed transfers,” 53.3% (n = 8) died. This mortality was lower among participants who, despite being dependent on “chair-to-bed transfers,” had an overall level of dependence classified as mild, a group in which 40% of the participants died (n = 4).
It was also relevant to know whether this mortality was influenced by nutritional status, age, disease burden, mobility, or social support. With respect to nutritional status, no differences were observed in relation to BMI (Mann–Whitney U, z = −0.849, p = 0.396) between those who were “dependent or needed great help to perform the chair-to-bed transfer” (28.22 ± 5.25, range 15.77–41.42) and those who were “independent or required minimal help” (28.83 ± 4.30, range 15.06–42.67).
Age did not influence greater or lesser dependence to perform chair-to-bed transfers (Mann–Whitney U z = −1.690; p = 0.091). The mean age among those who presented “dependence or needing great help to perform chair-bed transfers” was 87.57 ± 6.7 years, with a range between 68 and 102 years, while among those who were “independent or needed minimal help,” this mean was 85.96 ± 5.9 years, with a range between 66 and 99 years.
Nor were differences associated with disease burden observed (OR 0.875; CI 0.396–1.935), with 28.3% (n = 15) of those with “dependence or needing great assistance to perform the chair-bed transfer” and 25.7% (n = 19) of those who were “independent or required minimal assistance” having five or more chronic diseases.
Regarding mobility, in June 2020, 69.8% (n = 37) of people who were “dependent or needed major assistance” to perform chair-to-bed transfer were living homebound, while 67.6% (n = 50) of people who were “independent for this activity or needed minimal assistance” maintained the ability to leave home (OR 0.208; CI 0.097–0.445). Greater independence in performing chair-to-bed transfers was associated with a lower probability of living homebound. Extending this analysis (Table 3), the Barthel index activity that presented the strongest relationship between a higher level of dependence and a higher probability of living homebound was chair-to-bed transfer.
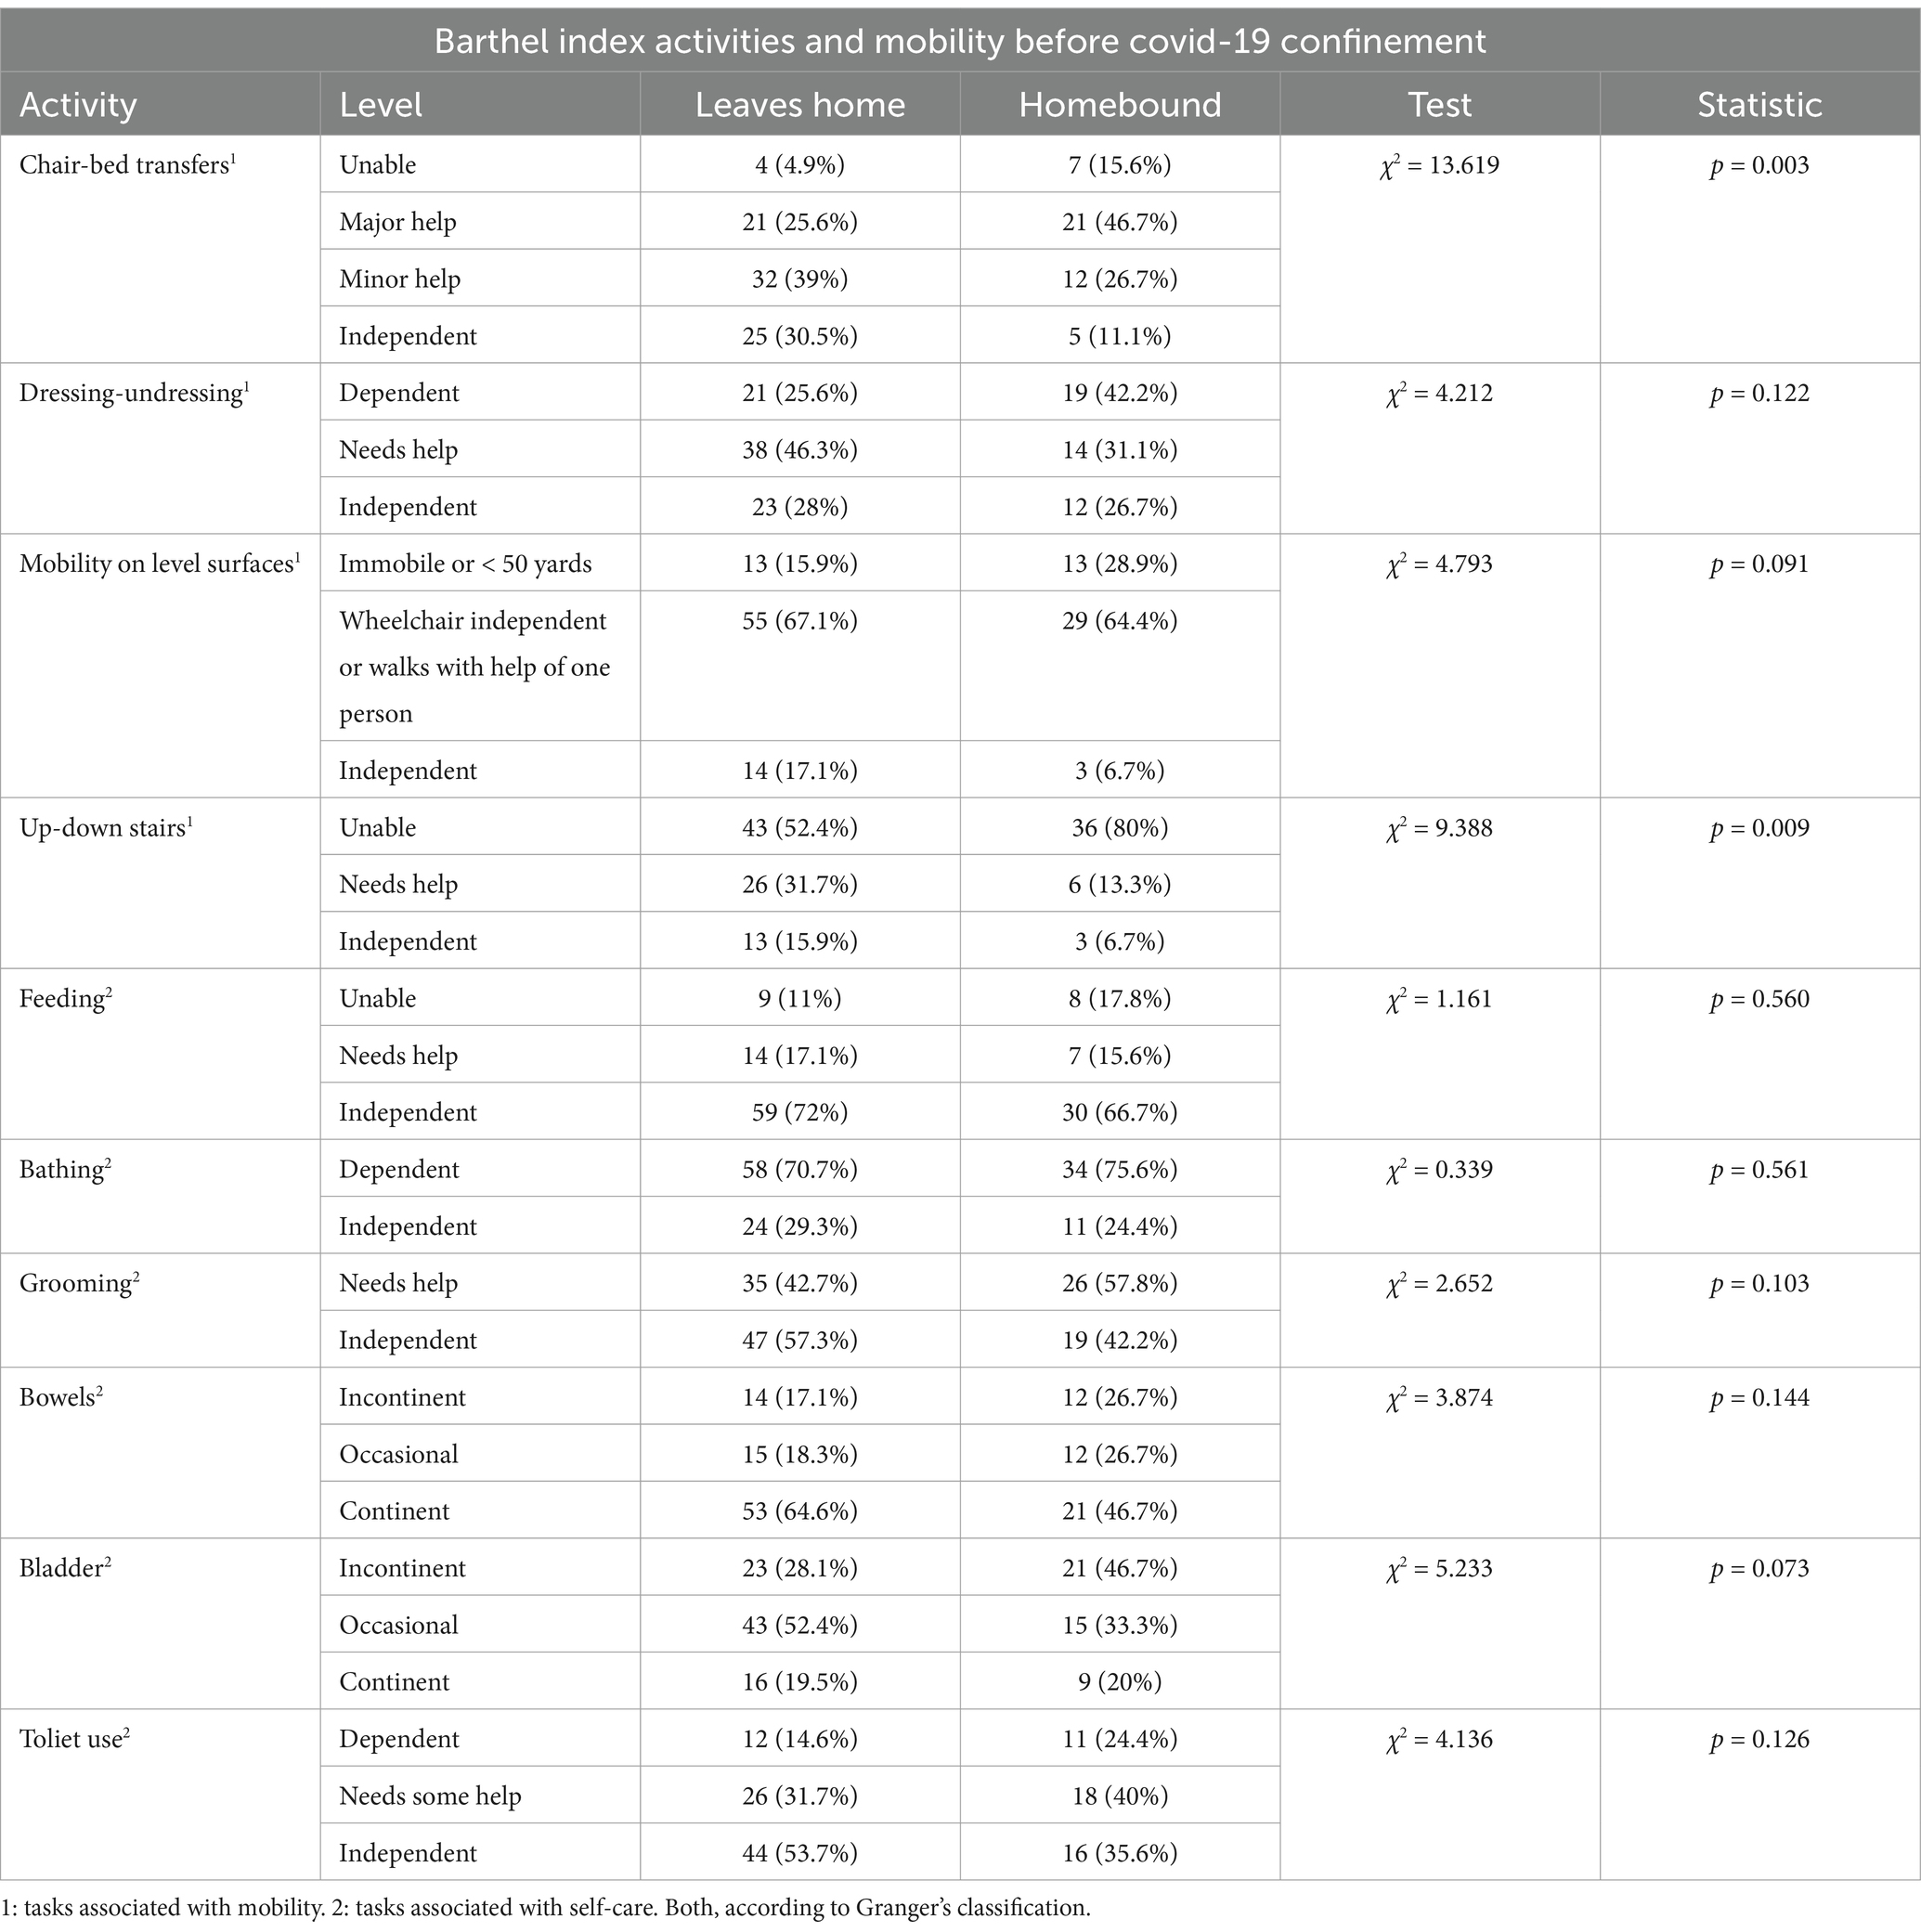
Table 3. Mobility, estimated by the ability to leave home versus living homebound, and functional dependence to perform basic activities of daily living before the COVID-19 pandemic confinement.
Finally, 60.4% (n = 32) of those with “dependence or needing great help to perform the chair-bed transfer” lived with their children, 20.8% (n = 11) lived with people other than their children, and 21.3% (n = 10) lived independently with their partner. These percentages were 33.8% (n = 25), 16.2% (n = 12), and 78.7% (n = 37), respectively, among those who were “independent or required minimal assistance” (χ2 = 13.305; p = 0.001).
The Barthel Index model with a cut-off score of 40 points and two categories, severe (Barthel Index score < 40 points) and moderate (Barthel Index score of 40–60 points) dependence, was used as a reference for this comparison. According to the results of this Barthel Index model, from 2020 to 2023, 48.1% (n = 25) of all persons with functional dependence who died had severe functional dependence, and 51.9% (n = 27) had moderate functional dependence. Within the group of persons with moderate functional dependence who died, 44.4% (n = 12) were dependent or needed great assistance for “chair-to-bed transfers.” Severe functional dependence (Barthel Index score < 40 points) was associated with an increased risk of mortality (HR 2.227, CI 1.514–3.276). This risk was lower than that observed for “being dependent or requiring great assistance for chair-to-bed transfers.”
With this new model being used as a diagnostic test to assess the risk of mortality (Table 4), lower results were obtained when “dependence for chair-to-bed transfers” and “need for great assistance for chair-to-bed transfers” were included in the same variable. The performance was highest when only the “dependence for chair-to-bed transfers” was included in the model.
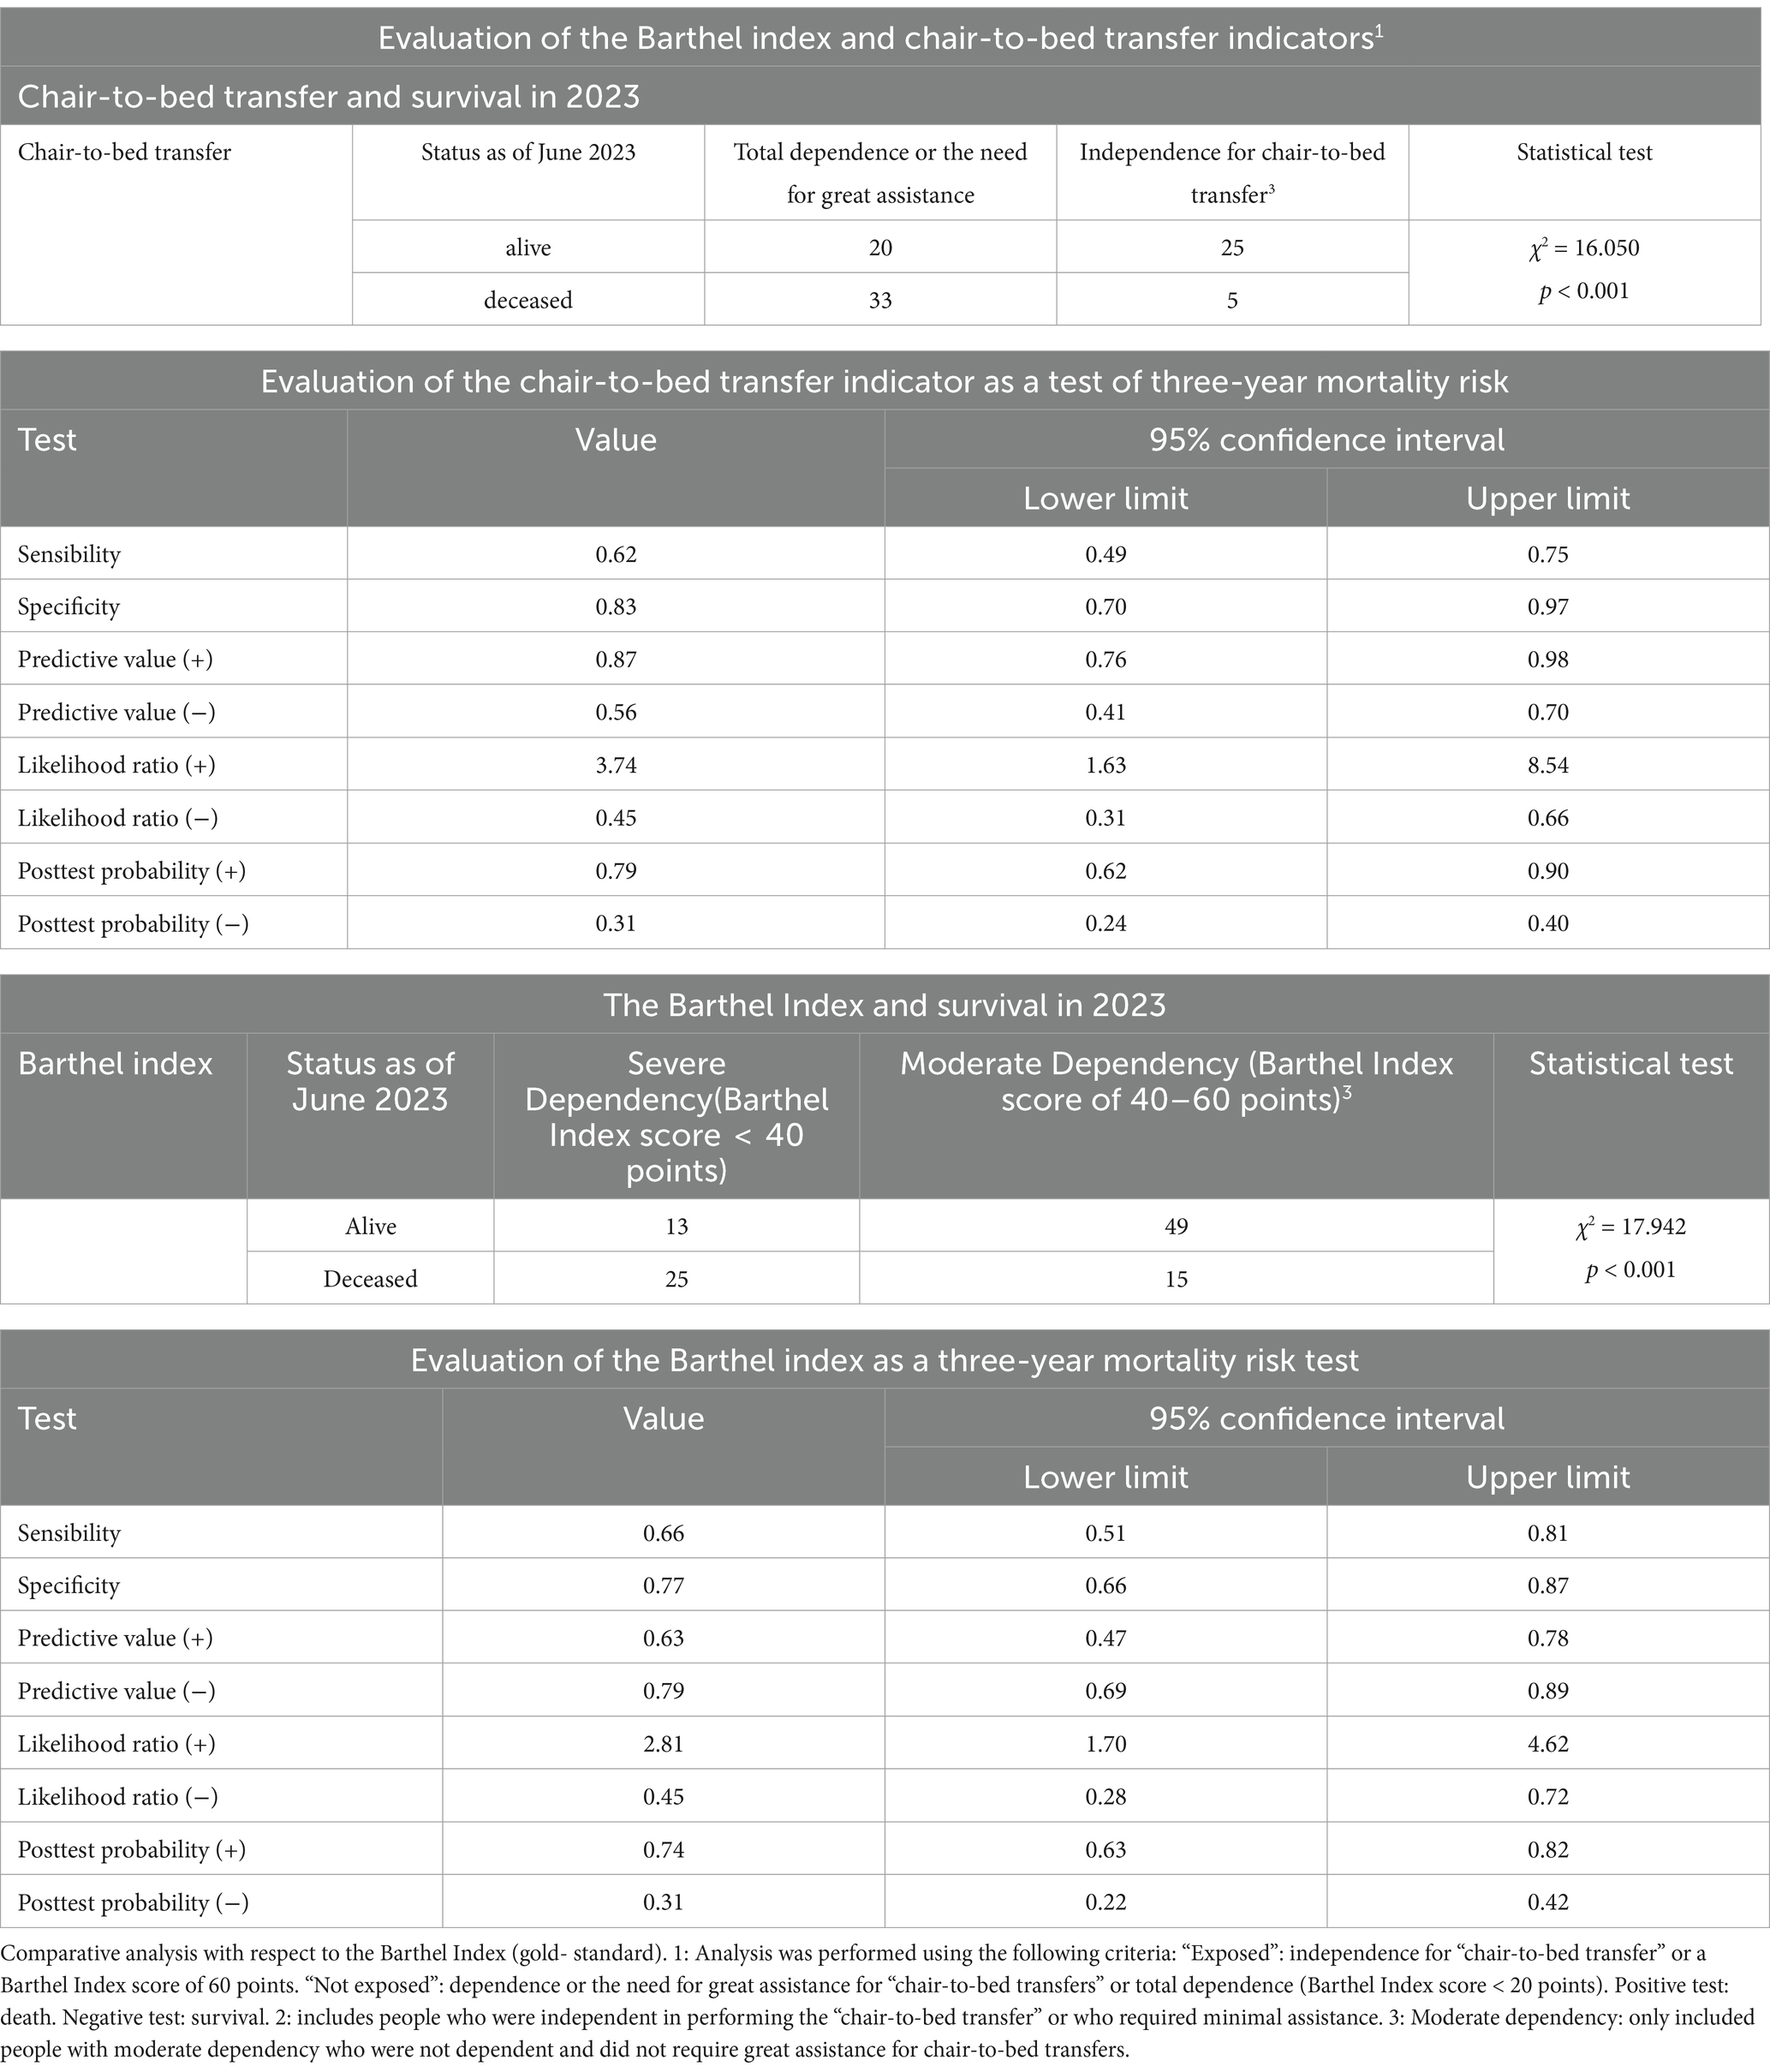
Table 4. Analysis of the “chair-to-bed transfer” indicator as a diagnostic test for mortality risk.
However, these results varied only slightly from those obtained with the gold standard, the summarized version of the Barthel Index, which has two levels of dependence (severe–moderate) and maintained statistical significance. To perform these analyses, in the group of patients with mild functional dependence (Barthel Index score of 60 points), 24 participants were excluded for “needing great assistance for ‘chair-to-bed transfer.’ One person with dependence for “chair-to-bed transfers,” who had a moderate level of functional dependence, was also excluded. Thus, in this group, which corresponded to the “unexposed” group, there were no “exposed” participants included.
When assessing their predictive ability, the area under the ROC curve for the dichotomized “chair-to-bed transfer” variable was 0.684 (CI 0.588–0.780; p < 0.001). For the dichotomized version of the Barthel Index, and in the circumstances described, the area was 0.708 (CI 0.601–0.814; p < 0.001). When the areas under the ROC curve were compared via the DeLong method, the differences between the areas of the dichotomized “chair-to-bed transfer” and dichotomized Barthel index variables were not significant (χ2 = 0,004; p = 0,948).
Bivariate analysis revealed that the variables “sex” (HR 0.486; CI 0.272–0.869) and “level of economic income” (HR 2.376; CI 1.357–4.161) were significantly related to survival at the three-year follow-up. Thirty-five percent (n = 35) of the females and 63% (n = 17) of the males died during this period; females had a lower mortality risk. However, sex was not associated with greater or lesser dependence for “chair-to-bed transfers” (OR 0.869; CI 0.369–2.047) or with greater or lesser ADL dependence, as assessed by the Barthel Index (OR 1.018; CI 0.402–2.580).
Using multinomial regression, when both variables were included in the model, the constant was no longer significant. Introducing the “chair-to-bed transfer” activity and the “level of economic income” into the dichotomized version of the model, the Cox and Snell R2 value showed that the model explained 17.3% of the variance in survival, and Nagelkerke’s R2 showed that the model explained 23.4% of the variance. The concordance index C was 0.736. Finally, the Hosmer–Lemeshow test was used to assess the goodness-of-fit of the model, and the results were as follows: χ2 = 0.709 and p = 0.702. This model had a sensitivity of 73.3% and a specificity of 63.5%.
By substituting the “chair-to-bed transfer” activity for the Barthel Index and following the same evaluation process, the Cox and Snell R2 value for the Barthel Index showed that the model explained 21.1% of the variance in survival, while Nagelkerke’s R2 showed that the model explained 28.6% of the variance. The concordance C index was 0.761, and the Hosmer–Lemeshow test used to assess the goodness-of-fit of the model yielded the following results: χ2 = 0.794 and p = 0.672. This model had high sensitivity (91.9%) and low specificity (47.5%).
In addition, a comparative analysis was performed between the Barthel Index and the “chair-to-bed transfer” activity, assessing survival in six-month periods, which revealed that the predictive capacity of the “chair-to-bed transfer” item as a risk factor progressively increased, and at 36 months, it surpassed that of the Barthel Index (Table 5). Although the level of association of both indicators with survival increased over time, “chair-to-bed transfers” did so to a greater extent.
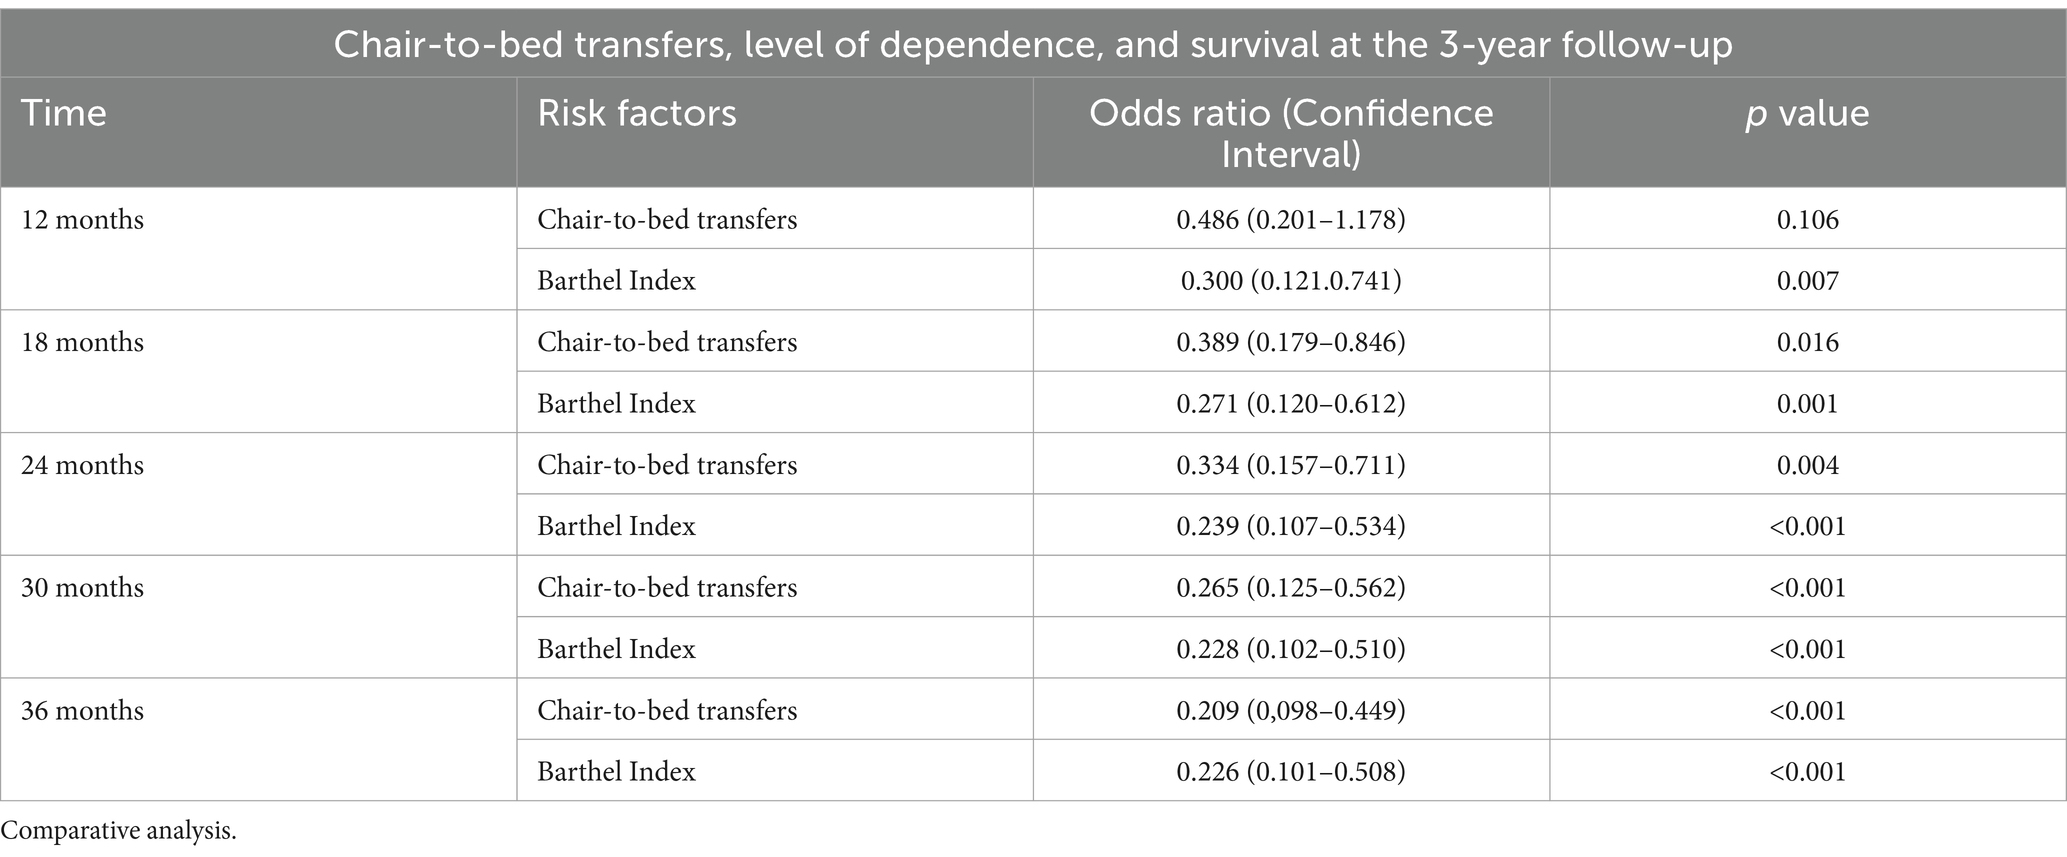
Table 5. Level of dependence, dependence for “chair-to-bed transfers,” and survival in the three-year follow-up period.
On the other hand, within the analysis using ROC curves, when differentiating between the group of activities associated with self-care and those related to mobility, dependence on activities involving mobility tended to be associated with lower survival.
The study’s objectives also included assessing whether the level of dependence influenced the results. For this reason, in parallel, the area under the curve for each of the activities included in the Barthel index was analyzed via ROC curves separately for each level of dependency: moderate (Barthel Index score of 40–60 points) and severe (Barthel Index score < 40 points). For both severely dependent persons (Figure 6A) and moderately dependent persons (Figure 6B), the only item that showed statistical significance in relation to survival was “chair-to-bed transfers.”
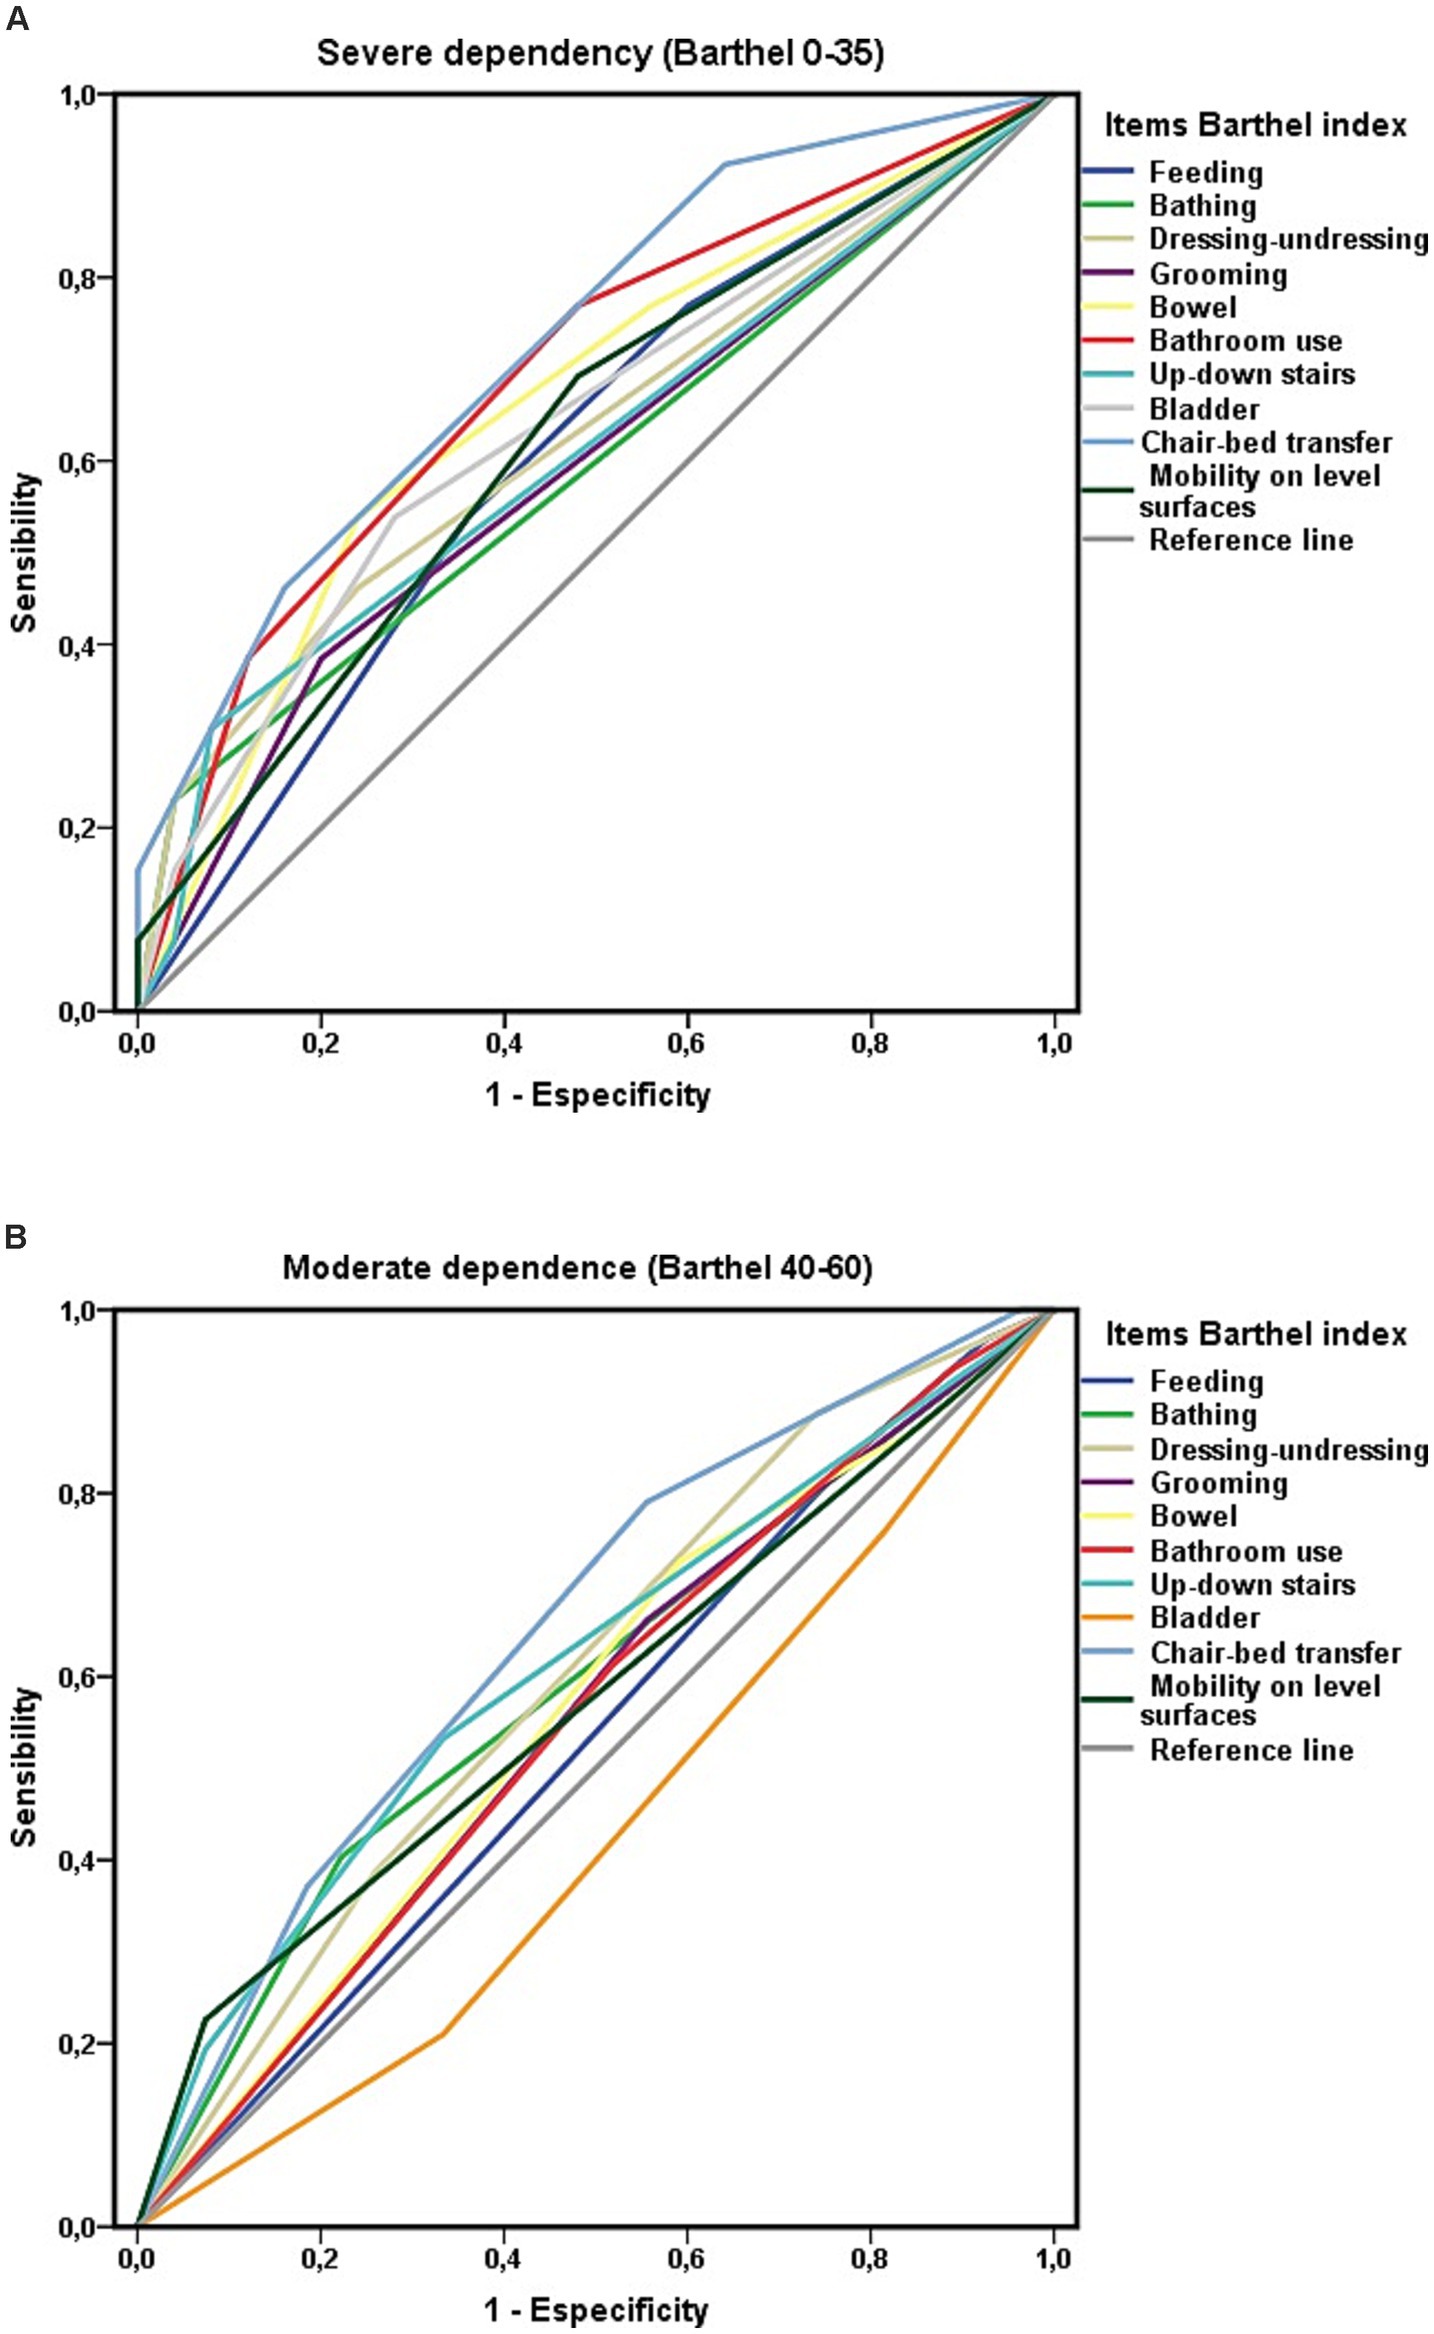
Figure 6. (A) Areas under the curve ROC of the Barthel index items and survival at 3-year follow-up among people with severe ADL dependence (Barthel less than 40). (B) Areas under the curve ROC of the Barthel index items and survival at 3-year follow-up among people with moderate ADL dependence (Barthel 40–60).
Extending the analysis by the level of ADL-dependency, greater independence in performing chair-to-bed transfers was associated with a lower risk of mortality, both in individuals with severe (HR 0.492; CI 0.290–0.865) and moderate (HR 0.574; CI 0.355–0.927) ADL-dependence. Among the participants with moderate ADL dependence, 48% (n = 12) of those who were “dependent or required great assistance for the “chair-to-bed transfers” (n = 25) died, whereas 23.4% (n = 15) of those who could perform this activity independently or with minimal help (n = 64) died. Among the group of persons who were “dependent or required great assistance to perform chair-to-bed transfers” who died (n = 33), 36.4% (n = 12) had moderate ADL dependence, and 63.6% (n = 21) had severe ADL dependence.
To complete the objectives of the study, the influence of economic level
留言 (0)