Muscle generates force through the cross-bridge ATPase cycle, during which the cross-bridges pass through various chemical and structural states, which are grouped into non-force-generating and force-generating states. The forward transition from non-force-generating to force-generating states is associated with the release of inorganic phosphate (Pi) and the force-generating step, also called the power stroke when referring to the individual myosin motor. Studies on muscle fibers and myosin working under load indicate that Pi release is reversible, allowing cross-bridges to rebind Pi and reverse force generation, i.e., the force produced by cross-bridges, by cycling backward from force-generating to non-force-generating states (Mannherz, 1970; Ulbrich and Ruegg, 1971; Hibberd et al., 1985a; Hibberd et al., 1985b; Webb et al., 1986). However, models of the cross-bridge ATPase cycle differ with respect to the sequence of Pi release and the power stroke. The original model, which proposed that the force-generating step occurs concurrently with Pi release (Eisenberg et al., 1980), has undergone continuous refinement. Many studies support models where the power stroke precedes Pi release (Millar and Homsher, 1990; Kawai and Halvorson, 1991; Dantzig et al., 1992; Ranatunga, 1999; Muretta et al., 2015; Woody et al., 2019; Matusovsky et al., 2021; Scott et al., 2021), whereas others support the opposite sequence (Davis and Rodgers, 1995; Smith, 2014; Llinas et al., 2015; Rahman et al., 2018; Offer and Ranatunga, 2020; Hwang et al., 2021; Moretto et al., 2022). Further complexity arises because of the need for at least one additional power stroke (Capitanio et al., 2006; Hwang et al., 2021; Matusovsky et al., 2021) and recent evidence from kinetics of single molecule fluorescence and molecular modelling that Pi release from muscle myosin (myosin II) occurs in multiple step (Moretto et al., 2022). Earlier evidence for a stepwise mechanism of Pi release has been given by studies of crystal structures of myosin VI (Llinas et al., 2015; Robert-Paganin et al., 2020). Moreover, the correlation between mechanical and energetic quantities led to the concept that the myosin power stroke is weakly coupled to its ATPase cycle (Yanagida et al., 1985; Ishijima et al., 1998) or more concretely to models in which cross-bridges can cycle through additional pathways, enabling some uncoupling (Linari et al., 2010; Debold et al., 2013; Scott et al., 2021), or loosening of the coupling (Caremani et al., 2013; Governali et al., 2020) between force generation and Pi release. Additional pathways include the detachment of myosin from actin before releasing Pi (Linari et al., 2010), Pi release from one pre-power stroke state and three post-power stroke states (Caremani et al., 2013; Governali et al., 2020), and detachment of myosin upon rebinding of Pi to the pre-power stroke (Debold et al., 2013) or to the post-power stroke state (Scott et al., 2021). The advantages and disadvantages of the different models are discussed in details (Debold, 2021; Mansson et al., 2023; Rassier and Mansson, 2025); however, arriving at a consensus remains challenging to date.
Understanding the mechanisms of Pi release and force generation is linked to their relation to the transitions limiting the rates of cross-bridge cycling. Although these rate-limiting transitions have been explored in many studies discussed by Gordon et al. (2000), Takagi et al. (2004), Geeves and Holmes (2005), Mansson et al. (2015), Stehle and Tesi (2017), Rahman et al. (2018), their nature remains controversial. Elucidating the relationship between these rate-limiting transitions and reversible Pi release and force generation is important for developing targeted strategies to modulate the rate of muscle contraction reviewed by Gordon et al. (2000), Takagi et al., (2004), Hinken and Solaro (2007), Stehle and Iorga (2010), Mansson et al. (2015), Geeves (2016), Houdusse and Sweeney (2016), Stehle and Tesi (2017). This study aims to explore the coupling between the process of Pi release-associated force generation and rate-limiting transitions. This coupling is still poorly understood, even for the main pathway. Because of the open questions regarding the sequence of Pi release and force generation and the increasing difficulty to identify specific rate-limiting transitions in multi-step and multi-pathway model, the strategy for defining the constraints for the rate-limiting step in this study was to analyze simple, single-pathway models with various sequence and kinetics of the Pi release and the force-generating step.
A measurement of the rates limiting the transition between non-force-generating and force-generating states is the kinetics of mechanically-induced force redevelopment induced by rapidly switching from a transient period of active unloaded shortening to active isometric contraction (Brenner, 1988). The rate constant kTR of this force redevelopment represents the sum of apparent rate constants in the cross-bridge ATPase cycle limiting the transitions of cross-bridges between non-force-generating and force-generating states (Brenner, 1988), reviewed in Gordon et al. (2000). The addition of Pi increases kTR and decreases force in skeletal and cardiac muscle (Millar and Homsher, 1990; Regnier et al., 1995; Araujo and Walker, 1996; Wahr et al., 1997; Regnier and Homsher, 1998; Tesi et al., 2000; Stehle et al., 2002a; Tesi et al., 2002; Hinken and McDonald, 2004; Edes et al., 2007; Papp et al., 2014; Stehle, 2017; Stehle and Tesi, 2017; Governali et al., 2020). The opposing effects of [Pi] on kTR and force provide evidence for Pi shifting of cross-bridges backward from force-generating to non-force-generating states (Hibberd et al., 1985a; Hibberd et al., 1985b; Webb et al., 1986; Kawai and Halvorson, 1991; Dantzig et al., 1992; Ranatunga, 1999; Mansfield et al., 2012; Woodward and Debold, 2018). Without Pi, redistribution is solely determined by the rate-limiting forward transitions f and g in the ATPase cycle, and kTR = f + g, with f denoting the apparent rate constant of the transition to force-generating states and g the apparent rate constant of the transition to non-force-generating states. Increasing [Pi] promotes the rebinding of Pi and facilitates the backward transition to non-force states, characterized by the apparent rate constant f– which contributes to kTR by kTR = f + g + f–, where f– is a function of [Pi.] (Palmer and Kentish, 1998; Stehle et al., 2002a; Stehle and Tesi, 2017). Recently, the reversibility of force generation was demonstrated at the molecular level by identifying elementary reverse strokes of force measurements on single cardiac myosin heads and filaments (Woody et al., 2019; Hwang et al., 2021). The step size of the two reverse strokes quantified in the experiments with single cardiac myosin were −6 nm and −3 nm and of similar magnitude as the two forward strokes of +6 nm and +3 nm (Hwang et al., 2021). Importantly, reverse strokes were confirmed by their experiments with single cardiac myosin filaments also to occur at high physiological [ATP].
The present study explored the effects of [Pi] on kTR and force in cardiac myofibrils of guinea pigs on the kinetic coupling of Pi binding induced force reversal and f–. The interrelation between kTR and force at various [Pi], i.e., the Pi-modulated kTR-force relation is demonstrated to provide a basis for probing the strength of this coupling. The coupling strength (CS) derived from this interrelation reaches its theoretical maximum when Pi binding and the reversal of the force-generating step are combined with f– into a slow single step, according to the limiting case of a two-state cross-bridge model in which Pi alters kTR and force in a simple reciprocal manner, such that, kTR changes in proportion to 1/force, i.e., delta kTR = 1/delta F. Based on this limiting case, an empirical equation was developed to define CS on a scale of +1 for maximum coupling and 0 for the case when kTR becomes independent of [Pi]. The Pi-modulated kTR-force relation of the cardiac myofibrils from guinea pigs yielded a high CS of +0.84 ± 0.08. Testing different models revealed that either Pi binding or force reversal, or both, must be connected to f– to yield the high CS observed in the experiments.
2 Materials and methods2.1 Myofibrillar preparation and solutionsDunkin-Hartley guinea pigs weighing 450–750 g were anesthetized with 5 vol% isoflurane and euthanized by decapitation. The use of animals and procedures in this study complied with the law for animal protection (TierSchG) transferred from the EU guidelines and was reviewed and approved by the Official Animal Care and Use Committee (LANUV NRW, Az 84-02.05.20.13.080 and 84-02.05.50.15.029). After exsanguination of the animal body, the heart was excised, and skinned strips from the trabeculae were prepared as described previously (Linke et al., 1993). First, the blood was removed from the heart by a brief (2–3 min) retrograde perfusion through the aorta at 37°C using a perfusion solution containing 132 mM NaCl, 5 mM KCl, 1 mM MgCl2, 10 mM TRIS, 5 mM EGTA, 1 mM sodium azide, 7 mM glucose, and 2 mM DTT, adjusted to pH 7.1. The heart was then transferred into an ice-cold perfusion solution without glucose, and the left ventricular cavity was opened by cutting in the axial direction. Thin strips with diameters of 0.3–0.4 mm were dissected from the endocardial trabeculae carneae under observation through a Olympus SZ51 stereomicroscope (Olympus, Hamburg, Germany) at about 20-fold magnification using a Vannas spring Scissors and a Dumont#5SF forceps (Fine Science Tools, Heidelberg, Germany) and pinned with microneedles on the Sylgard surface (Sylgard 184 Elastomer Kit, Dow Corporate, Mat. No. 4019862) in a chamber containing ice-cold skinning solution comprising 1% v/v Triton-X-100, 5 mM K-phosphate, 5 mM Na-azide, 3 mM Mg-acetate, 5 mM K2EGTA, 3 mM Na2ATP (including 3 mM MgCl2 and 6 mM KOH), 47 mM Na2CrP, 2 mM DTT, 0.5 mM 4-(2-aminoethyl) benzenesulfonylfluoride HCl, 10 μM leupeptin, 10 μM antipaine, 5 mg/mL aprotinine (adjusted to pH 7 at 0°C). EGTA (324,626) was from Merck Millipore. Triton X-100 (T8787), Na2ATP (A2383), Na2CrP (2,380) and protease inhibitors were from Merck Sigma Aldrich in high purity grade. The pinned strips were incubated in the skinning solution at 0°C for 4 h, and the skinning solution was replaced by storage solution (same composition as the skinning solution but without triton), in which the skinned strips were stored at 4°C for up to 3 days. Myofibrils were prepared on the day of the mechanical experiment by homogenizing the skinned strips at 0°C for 4–6 s at maximum speed using a blender (T10 Ultra-Turrax, IKA, Stauffen, Germany). The homogenate was then filtered through polypropylene meshes with 22 µm pore openings.
The standard activating buffer (pCa 4.5) used for mechanical experiments contained 10 mM imidazole, 3 mM CaCl2K4EGTA, 1 mM Na2MgATP, 3 mM MgCl2, 47.7 mM Na2CrP, 2 mM DTT, and different [Pi] with a pH of 7.0 at 10°C, and µ = 0.178 M. The standard relaxation buffer (pCa 7) contained 3 mM K4Cl2EGTA, instead of 3 mM CaCl2K4EGTA. Submaximal activating buffers, pCa (5.88–5.03), were prepared by mixing the standard activating and relaxing buffers in different ratios. Free calcium concentration [Ca2+] and pCa = -log [Ca2+]/M were calculated using a computer program (Fabiato and Fabiato, 1979). The [Pi] in the buffers was measured using a phosphate assay kit (E−6646; Molecular Probes, Eugene, OR). Pi contamination in the standard activating buffer was 170 ± 20 µM (mean ± SD). Activating and relaxing buffers of lower [Pi] (15 ± 5 µM Pi) were produced by adding 1 mM methylguanosine and 0.5 units/mL purine nucleotide phosphorylase (PNP). Activating and relaxing buffers with higher [Pi] were produced by adding phosphate buffer (30% NaH2PO4− 70% Na2HPO42-, pH 6.85). To maintain constant ionic strength, [Na2CrP] was reduced by 0.67 mM per 1 mM increase of [Pi]. All activating and relaxing buffers of different [Pi] were adjusted to a final pH 7.0 at 10°C.
2.2 Apparatus and technique to measure myofibril force redevelopmentThe mechanical setup consisted of an Olympus IX-70 microscope with a self-built rigid stage on top to which all manipulators for positioning of the chamber, the solution flow, the micro-needles and the atomic force cantilever were mounted. The micro-flow for the rapid solution change and the optics for force detection by the principle of atomic force microscopy has been described previously (Stehle et al., 2002a; Stehle et al., 2002b). A droplet of myofibrils suspended in the storage solution was added to the thermostatically controlled (10°C) chamber filled with relaxing solution. After sedimentation, a thin myofibril bundle was picked up from the bottom of the chamber at one of its ends using a tungsten micro-needle (# 5,775, A-M Systems, Inc., Carlsborg, WA) connected via a piezo actuator (P602.1SL, Physik Instr.) to a micromanipulator. The bundle was then moved with the micromanipulator to position its other, free end close to the tip of the atomic force cantilever (Nanoprobe© FESP type, compliance: 0.2–0.4 μm/μN), which was coated with a mixture (2:3 v/v) of 4% nitrocellulose in amyl-acetate and silicon adhesive (3140 RTV Coating, Dow Corning, Midland, United States). To fix the free end of the bundle at the surface of the coating, the bundle was pressed against the coating using a microneedle installed on a separate manipulator.
Dimensions and sarcomere length (SL) of myofibrils were determined under phase contrast microscopy using the 60x/0.70 Ph2 LCPlanFl objective and the 1.5 magnification lens built in the IX-70 microscope imaged to an ORCA-ER camera (Hamamatsu Photonics, Japan). The bundles used in the experiments had diameters ranging from 1.0 to 3.2 µm and slack lengths of 31–66 µm. The mean slack sarcomere length was 2.02 ± 0.11 µm (mean ± SD). Prior to activation, the bundles were stretched to a 2.4 µm SL. Signal conditioning for movement of actuators and acquisition of force and length signals was performed using a PCI6110-E device under self-written programs in LabView 4.0 (National Instruments, Austin, TX). During force recording, the myofibrils were exposed to one of two laminar streams of solutions produced by a double-channel theta-style capillary (TGC150-15, Clark Electromed. Instr., UK) and driven by gravitational pressure (30–35 cm H2O). Rapid Ca2+ activation and relaxation were induced by rapid solution changes (Colomo et al., 1998). The position of the flow was altered by the rapid lateral movement of the capillary, controlled by a piezo actuator (P289.40, Physik Instrumente, Karlsruhe, Germany), which effectively changed the solution at the bundle within 5–15 ms. Force redevelopment (kTR-measurement) was induced during Ca2+ activation. Rapid length changes were applied to the bundle via the microneedle using a piezo actuator (P602.1SL, Physik Instrumente). To determine the rate constant kTR for force redevelopment, a single exponential function was fitted to the force transients using the LabView program.
2.3 Coupling strength (CS) and model simulationAn indicator, the coupling strength (CS) was defined to quantify the coupling between Pi binding induced force reduction and the rate-limiting backward transition f– in the cross-bridge ATPase cycle. CS was scaled to 0 for no coupling, to +1 for maximum coupling, and to approach the limit value of −1 for maximum inverse coupling.
The maximum positive coupling exists when Pi rebinding, the reverse of the force-generating step, and the rate-limiting step for the backward transition of cross-bridges from force-generating states to non-force-generating states all represent the same step, with no other steps contributing to the backward cycling of cross-bridges. This scenario corresponds to the two-state model (Figure 1), involving the forward rates f and g and the reverse rate f–, where f represents the Pi release-coupled force generation and f– the Pi binding-coupled reverse of force generation. In this model, the force (F) is proportional to the fraction of attached motors f/(f + g + f –), and the rate constant of tension redevelopment kTR is equal to the sum of the rate constants: kTR = f + g + f – (Huxley, 1957; Brenner, 1988; Stehle et al., 2002a). For different [Pi], the statement is correct under the condition that the force per motor remains the same when changing [Pi]. The latter is supported by several studies on slow (Governali et al., 2020; Smith et al., 2020), fast skeletal (Caremani et al., 2008), and cardiac muscle preparations (Ebus et al., 1994; Zhao and Kawai, 1996).
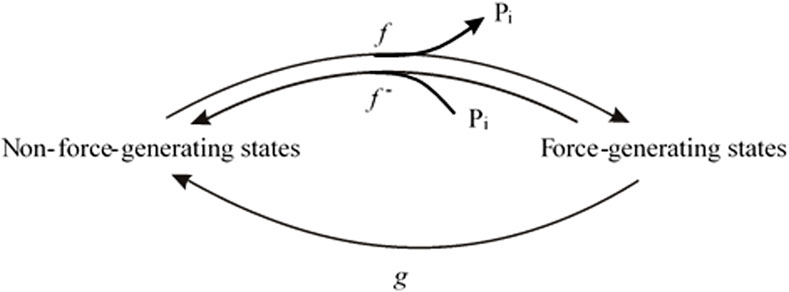
Figure 1. Two-state model in which Pi release step, force-generating step and the rate-limiting step for entering force-generating states are merged to single, fully reversible equilibrium.
To implement the [Pi] dependence of the force and kTR associated with Pi binding in this model, the (fixed) rate constant f– was replaced by an apparent rate constant f–app defined by Equation 1:
where f –0 is the value of f–app at standard [Pi], i.e., the [Pi] in the standard activating solution, and f –+Pi is an arbitrary function of [Pi] describing the change in f–app from standard [Pi] to a given [Pi].
Then, at standard [Pi]:
where F0 is F and kTR,0 is kTR at the standard [Pi].
At any given [Pi]:
F+Pi∝f/f+g+f–0+f–+Pi(3a)kTR,+Pi=f+g+f–0+f–+Pi(3b)where F+Pi is F, and kTR,+Pi is kTR at the given [Pi], respectively.
Inserting Equation 2b in Equation 2a yields
Inserting Equation 3b in Equation 3a yields
Dividing Equation 4b by Equation 4a results in
F+Pi/F0∝f/kTR,+Pi/f/kTR,0=kTR,0/kTR,+Pi(5)Equation 5 demonstrates that the force at the respective [Pi] normalized to the force at the standard [Pi] is reciprocally related to kTR at the respective [Pi] normalized to kTR at the standard [Pi]. Therefore, changes in [Pi] result in reciprocal alterations in force and kTR.
Equation 5 can be expressed as
where kTR,Pi is kTR and FPi, is the force at a given [Pi]. kTR,0 is kTR and F0 is the force at basal [Pi].
The CS is defined as 0 when Pi alters the force without changing kTR (kTR = constant) and is defined as 1 for maximum coupling as described in Equation 6.
Based on the two edge cases for CS = 0, kTR,Pi = kTR,0, and CS = +1, kTR,Pi = kTR,0F0/FPi (Equation 6), an empirical equation was formulated to describe the intermediate shapes of the Pi-modulated kTR-force relation in terms of a linear scale for CS within the interval [0, +1]:
kTR,Pi=kTR,0CSF0/FPi - 1+1=kTR,01 - CS+CS F0/FPi(7)CS can be negative, i.e., kTR,Pi can decrease with decreasing FPi if rate-limiting transitions f and f– occur after rapid Pi release-rebinding. In this case, increasing [Pi] further reduces the force by shifting the cross-bridges back to non-force-generating states via Pi binding. However, kTR,Pi decreases because the starting state of the rate-limiting forward transition f to force-generating states is the post-Pi release state, which is also the Pi-rebinding state. Increasing [Pi] lowers the occupancy of this state via Pi rebinding and therefore the contribution of f for rate modulating kTR. Consequently, kTR decreases from f + f– + g at low [Pi] to f– + g at high [Pi]. The empirical equation describing the relation between kobs and force due to decreasing f (Poggesi et al., 2005) was transformed to describe kTR-force relations with a negative CS in the interval (−1, 0], i.e., for CS > −1 and ≤0.
kTR,Pi=kTR,01+CS/1+CS FPi/F0(8)The assumption for deriving (Equation 8) is that basal [Pi] is zero. This assumption is not required to derive Equation 7, for which any standard [Pi] can be defined as the basal [Pi].
To illustrate the dependence of kTR-force relations on CS, the normalized kTR (y = kTR,Pi/kTR,0) is plotted versus the normalized force (x = FPi/F0) for increasing CS from 0 to 1 in increments of 0.1, as calculated using Equation 7 (Figure 2A) and for decreasing CS from 0 to −0.9 in increments of −0.1 using Equation 8 (Figure 2B). Starting from a flat, linear relation for zero CS, kTR increases with force reduction by Pi; CS becomes positive. Conversely, the more kTR decreases with force reduction, the more CS becomes negative. The magnitude of change in kTR and the curvature of the kTR-force relation increase with the absolute value of CS.
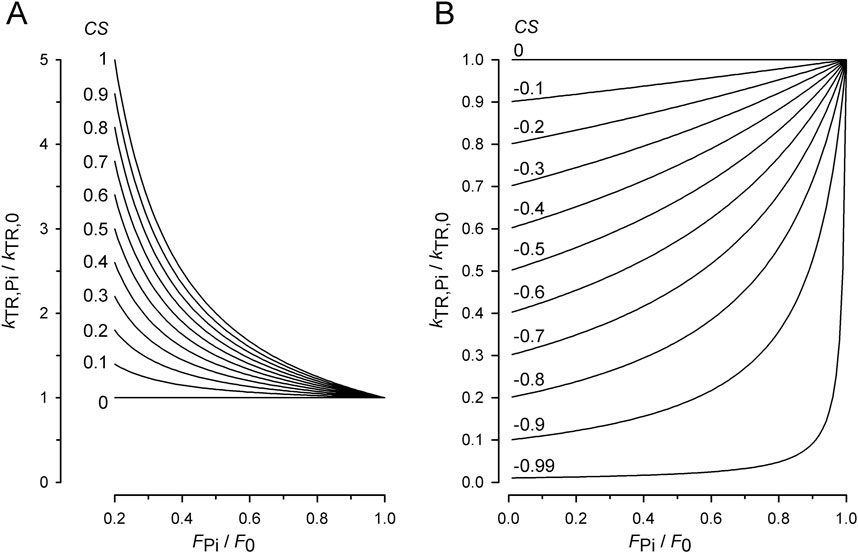
Figure 2. Effect of coupling strength (CS) on normalized kTR–force relations. (A) Relations for positive CS calculated by Equation 7. Increasing the CS by constant step sizes from 0 to 1 results in equidistant series of relations. For CS = 1, Equation 7 becomes equivalent to Equation 6 and y = 1/x. (B) Relations for negative CS calculated by Equation 8. Decreasing the CS by constant step sizes results in equidistant decreases of kTR,Pi-values at the ordinate. Note that for zero CS, kTR,Pi = kTR,0 and y = 1 for Equation 7 as well as for Equation 8.
Equation 7 and Equation 8 can be used to fit the kTR-force data of muscle preparations obtained at various [Pi] to derive the CS from the experimental data or data obtained by model simulations.
Model simulations were performed using the Berkeley Madonna 8.3.18 differential equation solver. Graphs and fits of experimental and model data were produced by SigmaPlot 8.0. Statistic F-test was performed under GraphPad Prism 4.
3 Results3.1 Characteristics of force redevelopment at different [Pi]Figure 3 shows the force transients of the guinea pig cardiac myofibrils at 10°C, pCa 4.5, and different [Pi]. The force recordings in Figure 3A illustrate the experimental protocol. The myofibril bundle was exposed to the flow of the relaxing solution (pCa 8), and calcium-induced force development was initiated by rapidly switching to the flow of the activating solution (pCa 4.5), consisting of the same [Pi] as the relaxing solution. To measure kTR during steady-state Ca2+ activation, the kinetics of force redevelopment following a transient period of active unloaded shortening was induced (Brenner, 1988). This was performed by applying a slack and re-stretch maneuver to the myofibril bundle consisting of a fast release by 15% of myofibril length to induce unloaded shortening for 50 ms and then a rapid stretch to the original length. After the redevelopment of the force, the bundle was relaxed by switching back from the activating to the relaxing solution. Subsequently, the next activation-kTR-measurement-relaxation cycle is performed at the next [Pi].
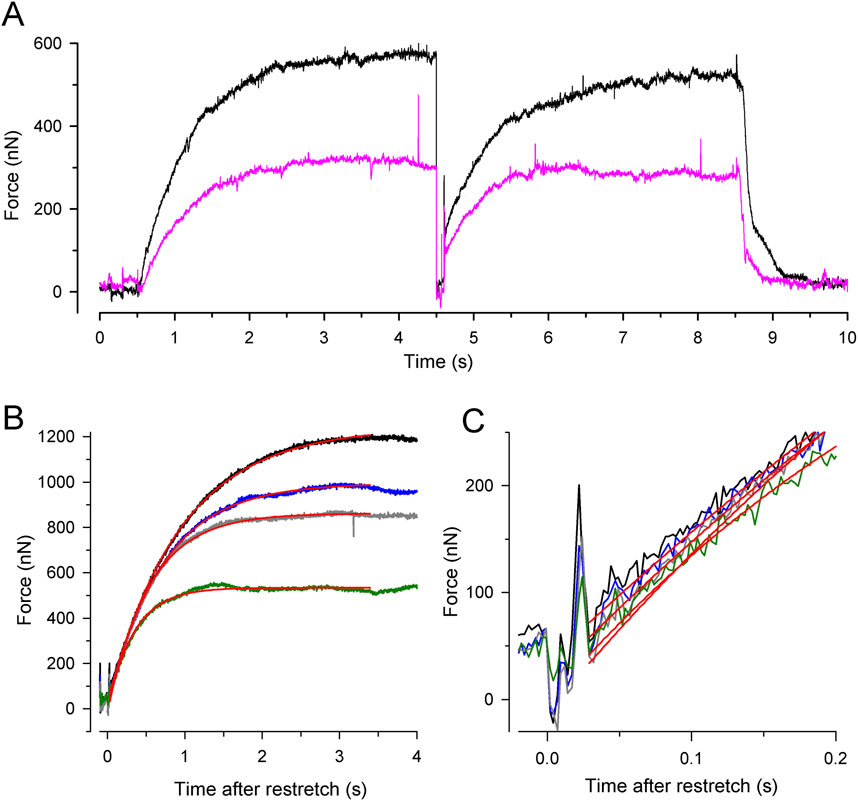
Figure 3. Experimental protocol and force redevelopment at different [Pi] at 10°C. (A) Typical full force transients obtained from a myofibril bundle (2.3 µm diameter, 66 µm length) at 0.17 ± 0.04 mM Pi (contaminant [Pi] in standard buffer, black transient) and 20 mM Pi (pink transient). At t = 0.5 s, the bundle was activated by switching from relaxing solution (pCa 8) to activating solution (pCa 4.5). At t = 4.5 s, the bundle was slackened for 100 ms by 15% of its length and then re-stretched to the original length to induce force redevelopment. At t = 8.5 s, the bundle was relaxed by switching back to relaxing solution. Force redevelopment after re-stretch mostly starts from a higher level than slack force like in this example. (B) Force redevelopment transients from a myofibril bundle (3.2 µm diameter, 47 µm length) at 1 mM Pi (black), 2.5 mM Pi (blue), 10 mM Pi (grey), and 20 mM Pi (green). Red lines are single exponentials fitted to transients yielding values for kTR of 1.4 s−1 (1 mM Pi), 1.7 s−1 (2.5 mM Pi), 1.9 s−1 (10 mM Pi), and 2.9 s−1 (20 mM Pi). In this experiment, force redevelopments started close to slack force enabling the comparison of their initial force rises that exhibit similar slopes as shown in (C).
Increasing [Pi] reduced the isometric force and the time required to reach the force plateau (Figures 3A, B). Force transients were fitted using single exponential functions (red lines in Figures 3B, C) to determine the rate constant of tension redevelopment, kTR. Increasing [Pi] from 1 mM up to 20 mM decreased force by approximately 50% and increased kTR by approximately 2.1-fold (Figure 3B), while the initial slope of the force redevelopment remained relatively constant (less than 15% change, Figure 3C). The constant initial slope is expected when the rate constant of an exponential function changes reciprocally with its amplitude, indicating the maximum possible rate modulation of kTR (Equation 6).
3.2 Dependence of force and kTR on the [Pi]To exploit the force reduction and rate modulation of kTR over a broad range of [Pi], force redevelopment transients were recorded from 19 myofibril bundles at variable [Pi] ranging from 0.015 mM to 20 mM. The force values of the transients were then normalized to the mean force produced by the myofibril bundle in the standard activating solution containing a contaminant [Pi] of 0.17 mM. Figure 4A illustrates the relationship between the normalized active force and [Pi]. Force reduction was already observed at low, sub-millimolar [Pi] levels. Fitting the force-[Pi] relation using a hyperbolic function yields three parameters: the fit value at zero [Pi] (F0Pi), [Pi] for half-maximum hyperbolic change (Pi50), and the final value at infinity [Pi] (F∞Pi). The fitted F∞Pi (0.13 ± 0.09) suggests an active force component that cannot be inhibited by Pi. Plotting force on a logarithmic scale of [Pi] revealed a bilinear relationship with a 6-fold less steep decrease in force per decade increase of [Pi] for data with ≤1 mM Pi than for the data with ≥2.5 mM Pi (Figure 4B).
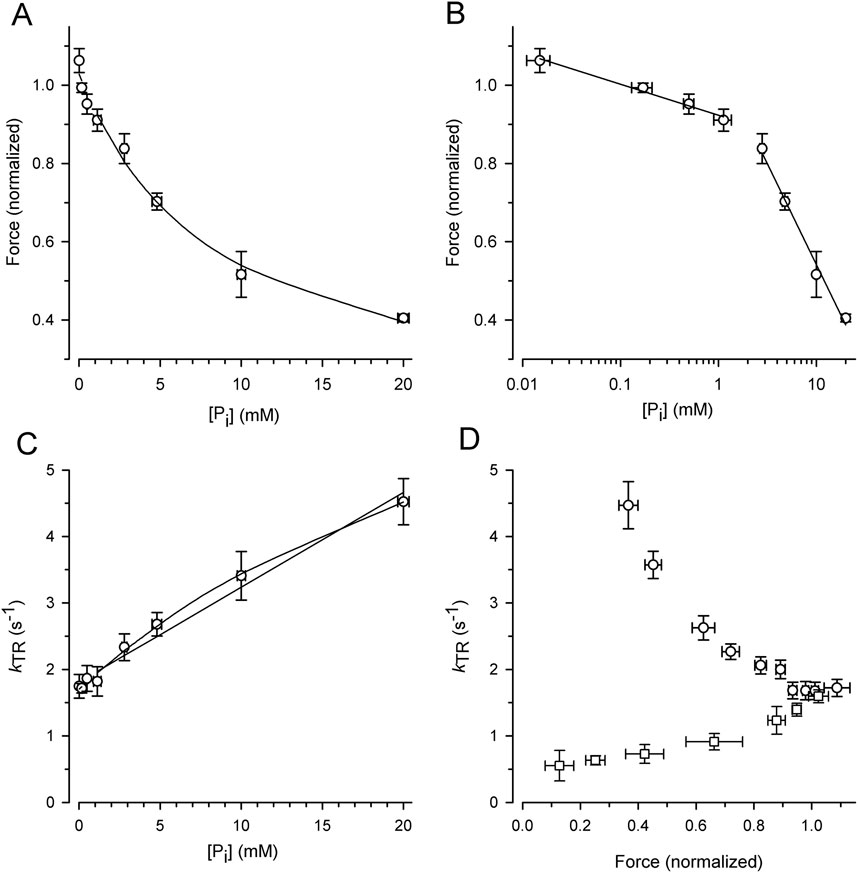
Figure 4. Alteration of force and kTR by [Pi] and comparison of kTR-force relations resulting from varying [Pi] and [Ca2+] at 10°C. For each myofibril, force data was normalized to force measured in standard activating solution (0.17 mM Pi, pCa 4.5). (A) Force-[Pi] relation. The line present the hyperbolic function fitted to the data yielding F0Pi = 1.03 ± 0.02, Pi50 = 8.4 ± 2.1 mM and F∞Pi = 0.13 ± 0.09. (B) Force-log [Pi] relation. Lines indicate linear regression lines with slopes of −0.08 per decade increase of [Pi] at low [Pi] (≤1 mM Pi) and −0.51 at high [Pi] (≥2.5 mM Pi). (C) kTR-[Pi] relation and analysis of its curvature. The lines present linear (k0Pi = 1.81 ± 0.07 s-1, slope = 0.143 ± 0.008 s-1/mM Pi) or hyperbolic fit functions (k0Pi = 1.70 ± 0.04 s−1, Pi50 = 33 ± 9 mM and k∞Pi = 9.2 ± 1.3 s−1) to the data. (D) Relations of kTR versus force altered either by changing the [Pi] between 0.015 mM and 20 mM (circles) at full Ca2+ activation (pCa 4.5) or by changing the pCa between 4.5 and 5.88 (squares) at constant [Pi] of 0.17 mM. Data was sorted for increasing normalized force values, subdivided in similar groups of n = 14–15 and plotted as mean ± s.d. For force and mean ± SEM for kTR.
Figure 4C illustrates the increase in the kTR-data with the [Pi], which can be fitted with a linear and hyperbolic function. If a process other than Pi binding limits the backward transition from force-generating to non-force-generating states (f–), kTR saturates at high [Pi], resulting in a hyperbolic kTR-[Pi] relation. In contrast, if f– refers to the rate constant of Pi binding, a linear increase in kTR with [Pi] is expected. A weak curvature in the kTR-[Pi] relation was observed, and the hyperbola fits the data significantly better (p = 0.0052 yielded by F-test) than the linear curve (lines in Figure 4C).
The effects of [Pi] on kTR and force were analyzed by plotting the kTR-force relation, i.e., by pairing the kTR values with the corresponding relative force from the same transient (Figure 4D, circles). Because force decreases with increasing kTR, the kTR-force relation exhibits a negative slope that becomes steeper at low forces. To determine whether kTR simply increased owing to the lower isometric force, the force was reduced by reducing [Ca2+] in the standard activating solution without adding Pi. Force transients from eight myofibrils were recorded at both full and partial Ca2+ activation. The force of each transient was normalized to the force at full Ca2+ activation (pCa 4.5, 0.17 mM Pi), and the kTR value was paired with the normalized force from the same transient and plotted in Figure 4D (square symbols). Consistent with previous studies, Ca2+ modulates kTR in the same direction as the force (Brenner, 1988; Sweeney and Stull, 1990; Regnier et al., 1995; Wolff et al., 1995; Edes et al., 2007; Norman et al., 2007; Kreutziger et al., 2008; Papp et al., 2014), which is opposite to the Pi-modulated kTR-force relation.
3.3 Quantification of coupling strength from [Pi]-modulated kTR-force dataTo quantify the CS from the experiments with varying [Pi], each individual kTR value obtained from each transient was paired with the normalized force value from the same transient, and these data pairs were plotted in the kTR,Pi-force relation shown in Figure 5. The symbols represent the values of 144 force transients obtained from 19 myofibrils at different [Pi] (indicated by different symbols or colors in the online version). The line represents the best fit of Equation 7 to the data, yielding a CS of 0.84 ± 0.08 and kTR,0 of 1.73 ± 0.07 s-1. The latter reflects the kTR-value of the fit curve at unity force in the standard solution, which is 0.17 mM Pi.
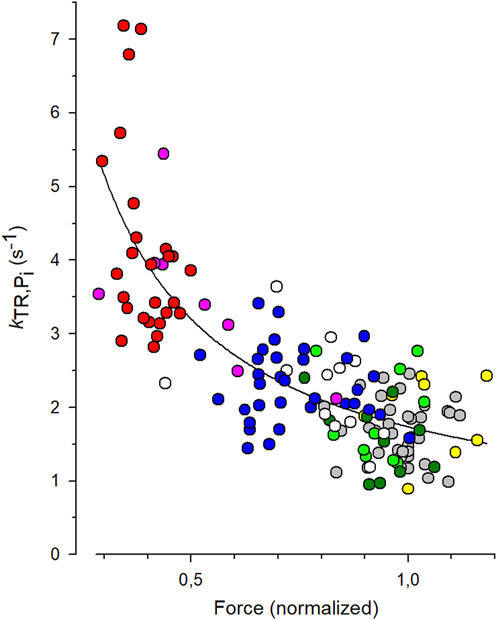
Figure 5. Fit of coupling strength (CS) function (Equation 7) to kTR-force data. All force data is normalized to mean force of each myofibril at 0.17 mM Pi that was the contaminant [Pi] in standard solution. Grey symbols: data obtained at 0.17 mM Pi (36 transients), green: 0.5 mM Pi (10 transients), dark green: 1 mM Pi (10 transients), white: 2.5 mM Pi (12 transients), blue: 5 mM Pi (33 transients), pink: 10 mM Pi (8 transients), red: 20 mM Pi (26 transients). In three myofibrils, [Pi] was further reduced by the Pi scavenger PNP resulting in a [Pi] of 0.015 mM (yellow, data of 9 transients). The best fit of Equation 7 (line) to the pooled kTR-force data yields the fit coefficients CS = 0.84 ± 0.08 and kTR,0 = 1.73 ± 0.07 s−1 (mean ± s.d).
3.4 Rate modulation of kTR by [Pi] and coupling strength depend on the modelTo assess the compatibility of the high CS obtained in the myofibril experiments with cross-bridge cycle models, various models with different sequences and kinetics for three critical events determining the reversible transition into force-generating states were tested for their [Pi]-dependent modulation of force and kTR. Three critical events were defined as reversible equilibria: an equilibrium abbreviated as R for the rate-limiting forward and backward transitions (f and f–), an equilibrium abbreviated as F for the force-generating step and its reversal, and an equilibrium abbreviated as P for Pi release-rebinding. The equilibria R, F, and P were incorporated into various models of the cross-bridge cycle using the same rate constants for ATP binding (step 1), ATP hydrolysis (step 2), and load-dependent ADP release (step 6), but with different sequences of R, F, and P (steps 3–5) and different associations of P or F with R. Models were named by the letters from left to right according their sequence in forward direction of the cycle indicating the sequence of steps for forward transitions. The sequence of steps for backwards transitions results from reading the letters of model names from right to left. Parentheses in names mean that P or F or both are merged with R to single slow equilibrium resulting in combined rate constants (P = R, F = R, and P = F = R), To simulate scenarios where F or P, or both, act as the rate-limiting forward-backward transition, they were combined with R into a single equilibrium, indicated by enclosing either F or P or both with R by a parenthesis in the model name. The different models and their corresponding rate constants are described in Table 1, their schemes are illustrated in Figure 6.
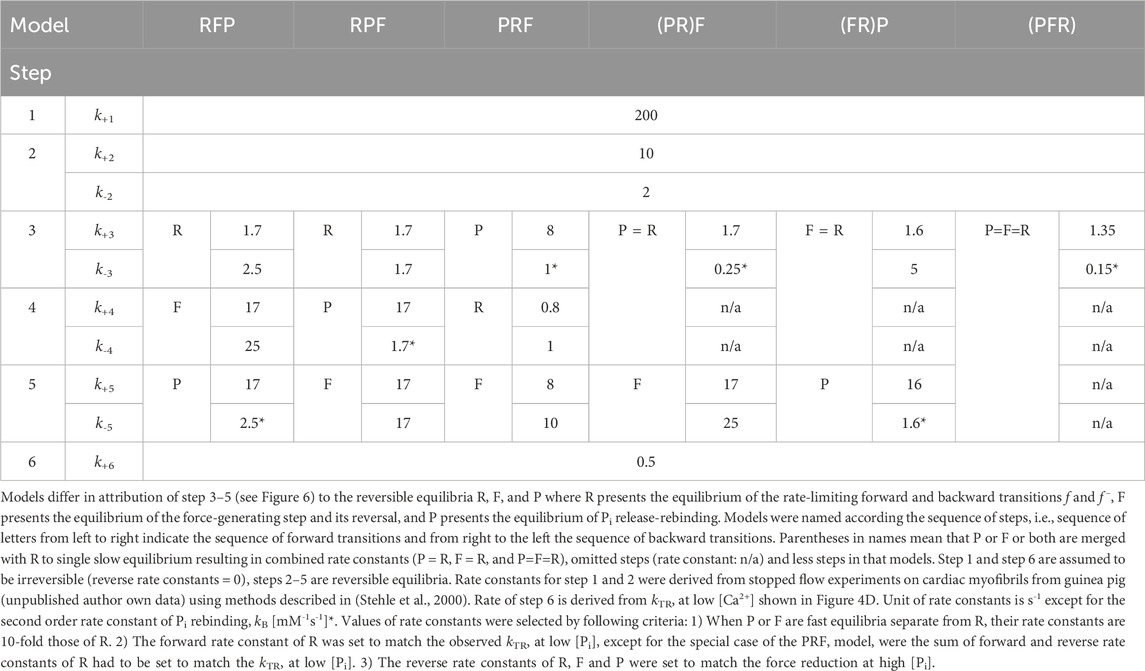
Table 1. Rate constants for simulations of 6 different models of the cross-bridge cycle.
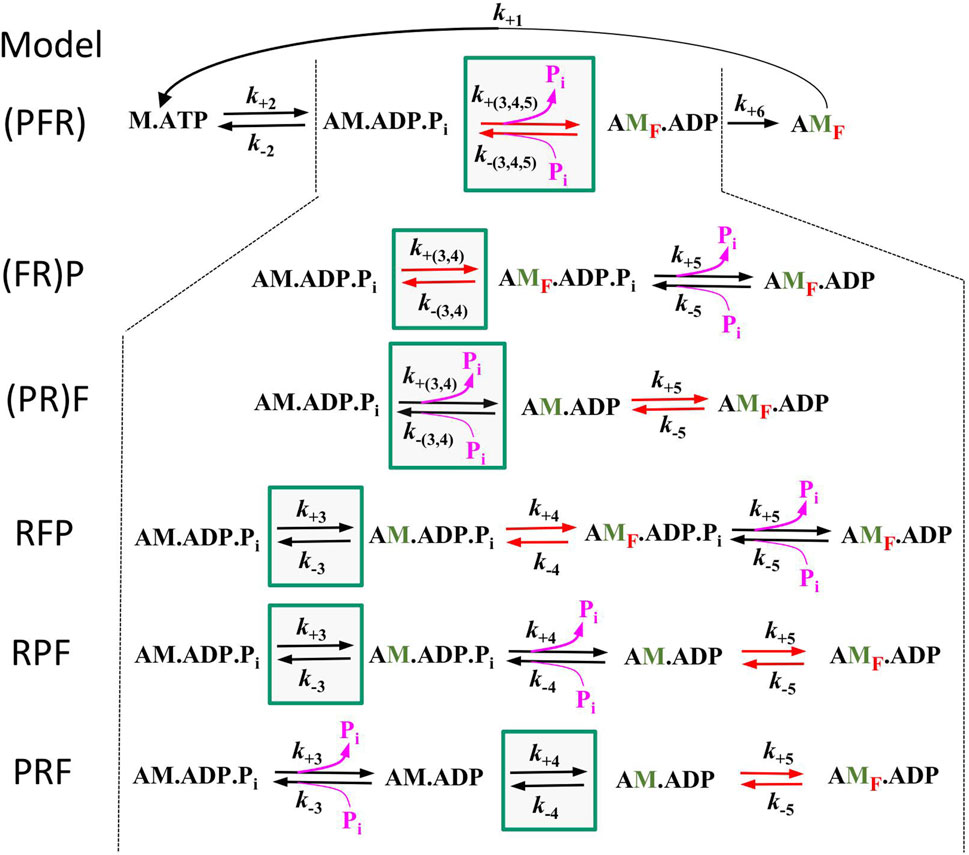
Figure 6. Schemes of the 6 different models tested in this study. All models are equal in step 1 (ATP binding), step 2 (ATP hydrolysis), and step 6 (load dependent forward transition, g) but differ in step 3–5. Green boxes mark the equilibrium for rate-limiting forward and backward transitions f and f –(equilibrium R), red arrows mark the equilibrium of the force-generating step and its reversal (equilibrium F) and pink arrows the equilibrium of Pi release-rebinding (equilibrium P). Lettering of models from left to right indicate the sequence of equilibria in forward direction, brackets indicate inclusion of F or P or both with R. Green labelled ‘M′ indicate strongly bound myosin states that have undergone the rate limiting transition, red subscript ‘F′ in states indicate force-producing myosin states.
To determine kTR-values and force for each model, force redevelopment transients were simulated for each model and [Pi]. This involved the calculation of the steady-state distribution of states during unloaded shortening (with the forward rate constant of step 6 set to k’+6 = 50 s-1) and then switching it at t = 0 to a low value for isometric contraction (k+6 = 0.5 s-1). The simulated transients were then fitted using the same type of single exponential function that was used to fit the transients from the myofibril experiments.
The force amplitude for each model was normalized to the force amplitude at 0.17 mM Pi, and the normalized force was plotted against either the [Pi] (Figure 7A) or the log [Pi] (Figure 7B) together with the relations obtained from the myofibril experiments. The curvature of the myofibril force-[Pi] relation can be largely described by the (PFR) and (PR)F models, where Pi release/rebinding limits the forward/backward transition into/from force-generating states; however, both models overestimate the observed force reduction at the highest [Pi] of 20 mM Pi. A similar curvature of the force-[Pi] relation was predicted by the RPF model, with the sequence of the rate-limiting transition controlling rapid Pi release, triggering fast force generation. Models in which force generation precedes rapid Pi release predict increased curvatures, regardless of whether F is coupled to R in the (FR)P model or whether F is a fast step following R in the RFP model. The PRF model, in which rapid Pi release precedes the rate-limiting transition, yields the lowest curvature. Nevertheless, all the models recapitulate the basic feature of force reduction over a large range of [Pi], making it difficult to exclude certain models based on the force-[Pi] and force-log [Pi] relations.
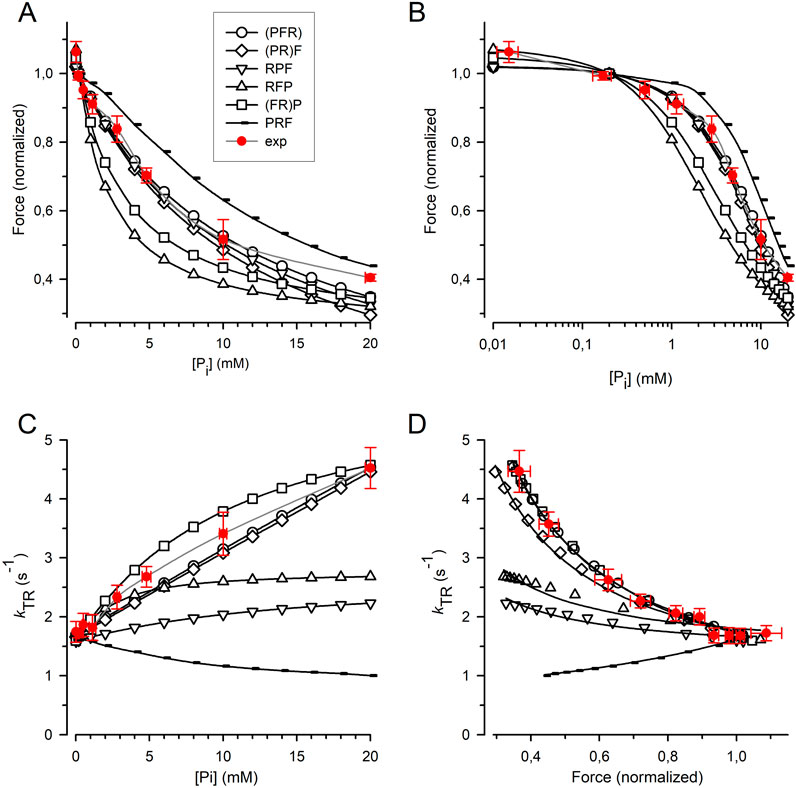
Figure 7. Relation of force and kTR on [Pi] predicted by cross-bridge models differing in sequence and kinetics of reversible equilibria for Pi release and force-generating step. (A) Force-[Pi] relations. (B) Force-log [Pi] relations. (C) kTR-[Pi] relations. (D) kTR-force relations. Filled red circles and error bars represent the experimental data replotted from Figure 5. Black symbols indicate relations calculated for the different models: Open circles refer to the (PFR) model in which Pi release, force-generating step and rate-limiting transition f are merged to a single slow step. Squares refer to the (FR)P model in which the force-generating step presents the rate-limiting transition f followed by faster Pi release. Diamonds refer to the (PR)F model in which the Pi release presents the rate-limiting transition f followed by a faster force-generating step. Tip-up triangles refer to the RFP-model with the sequence: 1. Rate-limiting transition f, 2. Fast force-generating step, 3. Rapid Pi release. Tip-down triangles refer to the RPF model with the sequence: 1. Rate-limiting transition f, 2. Rapid Pi release, 3. Fast force-generating step. Small symbols present the PRF model with the sequence: 1. Rapid Pi release, 2. Rate-limiting transition f, 3. Fast force-generating step. Lines in subfigures (A–C) are spline curves. Lines in (D) represent best fits of Equation 7 to each model except for the RPF model fitted by Equation 8. Model-dependent CS: 0.86 ± 0.02 for (PFR), 0.90 ± 0.02 for (FR)P, 0.67 ± 0.02 for (PR)F, 0.26 ± 0.03 for RFP, 0.19 ± 0.03 for RPF, and −0.52 ± 0.01 for PRF. The CS of experimental data (red) is 0.84 ± 0.08.
Figure 7C shows that the kTR-[Pi] relation strongly depends on the type of cross-bridge model used. In the (PFR) and (PR)F models, where the backward transition f– is directly limited by Pi rebinding, kTR increases steeply and linearly with [Pi]. In addition, a steep but curved increase in kTR with [Pi] was observed when force generation and its reversal were coupled to rate-limiting transitions prior to rapid Pi release-rebinding, as in the (FR)P model. The kTR-[Pi] relation for cardiac myofibril falls between the linear relations predicted by the (PFR) and (PR)F models and the curved relation predicted by the (FR)P model, which is consistent with these three models. In contrast, the RFP and RPF models in which F and P are fast, reversible equilibria produce less steep kTR-[Pi] relations than those observed in the experiments. Notably, the PRF model, in which rapid Pi release-rebinding occurs before the rate-limiting transitions f and f− predicts a declining kTR-[Pi] relation.
To determine the CS, Equation 7 (see Methods) was fitted to the kTR-force data simulated for each model (Figure 7D). Sequential models in which Pi release and rebinding were integrated with rate-limiting transitions yielded a high CS of 0.86 for the (PFR) model and 0.90 for the (PR)F model) (Figure 7D). The CS of these models does not reach the maximum value of 1.0 observed in a two-state model because the ATP cleavage step also participates slightly in limiting the redistribution of cross-bridges between the non-force and force-generating states. The CS of both models was in agreement with the CS of 0.84 ± 0.08 obtained in the real experiments (Figure 5). A reasonably high CS of 0.67 is also observed in the (FR)P model, where fast Pi release-rebinding occurred after rate-limiting, reversible force generation. However, when both the force-generating step and Pi release are fast,
留言 (0)