Over the past two decades, research has demonstrated that various forms of training can lead to neuroplasticity in the adult brain, encompassing physical activities, motor skills development, and language acquisition (Draganski et al., 2004; Raichlen et al., 2016; West et al., 2018; Kuper et al., 2021). Braille reading offers a unique opportunity to study cross-modal plasticity, a remarkable adaptive feature of the brain where the loss or alteration of one sensory modality induces cortical reorganization, enhancing sensory performance in the remaining modalities. Cross-modal plasticity occurs when brain structures previously devoted to processing a particular sensory input begin to accept input from a different sensory modality (Grafman, 2000). Previous research highlighted how sensory deprivation prompts extensive cortical reorganization in blind individuals. Cross-modal plasticity can be observed in the visual cortex following auditory stimulation (Ortiz-Terán et al., 2016) and tactile stimulation (Burton et al., 2004), including both early sensory regions (Sadato et al., 1996) and higher-order visual areas (Büchel et al., 1998), as well as the reading network (Reich et al., 2011). Furthermore, such plasticity can persist even after restoring the lost sense, highlighting its role in maintaining neural activity (Mowad et al., 2020). Braille training engages basic motor and sensory regions and brain areas associated with higher-order cognitive functions, providing a comprehensive model to study cross-modal plasticity (Matuszewski et al., 2021). Most importantly, however, Braille training induces changes in the activity of the reading network (Dehaene, 2010).
The reading network is a complex system of interconnected brain regions that work together to process language. It begins in the posterior parietal region, responsible for top-down attention, and the occipital areas, responsible for processing visual inputs. The ventral occipitotemporal cortex—the visual word form area (VWFA)—comes next, acting as the brain’s letterbox (Dzięgiel-Fivet et al., 2021). This area is crucial for recognizing and interpreting letters and words. Previous research has identified this area as involved in sighted adults reading visually (Lerma-Usabiaga et al., 2018) and blind individuals reading Braille tactilely (Reich et al., 2011). The inferior frontal gyrus, anterior temporal gyrus, anterior fusiform gyrus, middle temporal gyrus, and angular gyrus are responsible for retrieving meaning in language, allowing us to understand and interpret written words. The superior temporal gyrus, anterior insula, precentral gyrus, and supramarginal gyrus are responsible for pronunciation and articulation. These areas form the reading network, working together to process and understand written language (Figure 1).
Importantly, cross-modal plasticity is not limited to individuals with sensory impairments. For instance, when blindfolded, sighted adults also show increased early visual cortex activation during tactile stimuli discrimination (Merabet et al., 2008). More recent studies using both complex tasks, such as the Lexical Decision Task (LDT) and simple word reading tasks, have provided valuable insights into the dynamics of training-induced plasticity, including, but not limited to, cross-modal plasticity, through Braille reading in sighted individuals (Siuda-Krzywicka et al., 2016; Matuszewski et al., 2021). These studies collectively indicate that tactile reading stimulates motor and sensory regions, the reading network, and brain areas linked with advanced cognitive functions, such as the VWFA. Notably, the first effects were observed after 3 months of training. However, given that neuroplasticity can manifest within weeks (Debowska et al., 2016), days (Chen et al., 2019), or even minutes (Sagi et al., 2012), the temporal dynamics of neural reorganization during Braille’s early learning stages should also be examined. This can be achieved by using a longitudinal approach. By assessing brain activity at multiple time points, we can capture the progression and consolidation of learning-induced plasticity. Such an approach provides a deeper understanding of the learning process than the pre-post approach used in many longitudinal studies (Mårtensson et al., 2012; Grant et al., 2015; Legault et al., 2019) and allows distinguishing between initial rapid changes and longer-term adaptations in the brain. Such detailed temporal mapping is crucial for understanding how the brain reorganizes itself to accommodate new skills, particularly in the context of cross-modal plasticity.
No study has leveraged a linguistic task to observe neural activation shifts within the first few weeks of Braille learning. While increased brain activity has been observed in the primary somatosensory cortex and the fusiform gyrus (Debowska et al., 2016), it was done in a task with a strong detection and recognition component present, where no language-related decision-making was required. Since reading acquisition requires a distinctive manner of linguistic processing in response to stimuli, it is crucial to distinguish it from other processes, such as detecting simple patterns or objects, which may still induce activity in the reading network (Reed et al., 2004). Using linguistic tasks makes it possible to assert that the reorganization reflects increased abilities to identify and process Braille symbols and the appropriation of linguistic meaning to abstract symbol representations that constitute the tactile script. Moreover, a reading task and the presence of a linguistic component allows us to precisely measure the learning progress through quantifiable metrics such as the number of letters or words or correctly classified Braille stimuli as words or pseudowords. Significant changes in the performance and activation within the reading network would allow us to draw valuable comparisons between the neural regions activated during Braille reading and those involved in reading through sight. These comparisons are vital for understanding how different sensory inputs influence the reading network and cognitive development.
In sighted people, the Braille alphabet can be learned using both vision and touch. Contrasting visual and tactile Braille-related activity could help identify which regions of the reading network are specifically engaged in tactile reading. Previous research involving the same group of sighted Braille teachers has demonstrated that visual Braille reading, which lacks natural line junctions, is significantly less efficient than reading scripts like Cyrillic. Even with previous visual Braille knowledge, reading was slower and more prone to errors than in the Cyrillic alphabet learning group after just 3 months of learning (Bola et al., 2017a). Although tactile and visual reading have been tested in an fMRI setting before (Siuda-Krzywicka et al., 2016), no direct comparison has been computed. This highlights the need for a direct comparison to understand the specific neural mechanisms engaged in tactile Braille reading, preferably in naive people with no prior Braille knowledge.
Previous research with sighted Braille learners has focused mainly on explicit reading or simple tactile pattern recognition tasks. While invaluable when it comes to understanding cross-modal plasticity, these tasks do not consider that in everyday life, much of the interaction of sighted individuals with reading is done without conscious effort, for example, when reading a book or reading subtitles while watching a movie. This form of reading can be defined as implicit. Studies have demonstrated that implicit reading can induce significant neural activity similar to that observed in explicit reading tasks. For instance, even when subjects are instructed to perform a nonlinguistic visual feature detection task, the presence of words or pseudowords activates a widespread neuronal network that aligns with areas of the reading network (Thuy et al., 2004; Price and Devlin, 2011). This suggests that the brain processes words beyond the functional demands of the task, highlighting the underlying neural mechanisms that support implicit reading. However, to our knowledge, no one has tested whether implicit reading in the tactile domain can induce a different functional response in the brain. With the acquisition of linguistic context for the Braille symbols, such implicit reading could also emerge even in a non-linguistic task. Thus, the activation of regions in the reading network in response to tactile Braille stimulation without an overt linguistic task would further support the multimodal and modality-independent nature of the brain areas involved in reading.
Finally, learning might evoke potential transfer effects, although the literature on this topic remains inconclusive (Soveri et al., 2017). Cognitive training paradigms, including linguistic ones, are proposed as tools in neurorehabilitation or as preventive measures to delay the onset of age-related cognitive decline. In this context, it is a valid question whether acquiring a new skill, such as reading in a tactile domain, translates into improved performance on an unrelated cognitive task. We incorporated n-back and Stroop tasks in our study design to test this. These tasks are well-established measures of working memory and cognitive control, respectively, and they allowed us to investigate potential generalization cognitive effects induced by complex learning.
Current research consisted of a seven-month tactile Braille reading course combined with functional neuroimaging, including Braille processing in visual and tactile modalities as well as behavioral testing across multiple time points ranging from days to months after training onset and aimed to answer the following questions:
(1) “At which stage does the reading network become involved in visual and tactile Braille reading?” We postulated that the reading network would be engaged during visual reading within the first week of learning. However, given the inherent complexity of tactile reading, we expected the VWFA and inferior frontal gyrus (IFG) involvement to become apparent in the tactile domain after a more extended period than visual reading.
(2) “What are the brain networks engaged in tactile and visual Braille reading, and which regions are involved in Braille word processing regardless of the presentation domain?” Studies on blind people showed that VWFA constitutes a reading center independent of visual experience (Reich et al., 2011). We hypothesized, therefore, that areas of the reading network, such as the IFG and VWFA, would be involved in both visual and tactile reading tasks.
(3) “Can the involvement of the reading network be observed during implicit Braille reading?” We hypothesized that a comparison between Braille learners and passive controls would reveal a higher activity level in the reading network areas among the learning group during an implicit reading task (Thuy et al., 2004; Brem et al., 2009).
2 Materials and methods 2.1 ParticipantsTwenty-one right-handed female university students were recruited to the experimental group in the study. One participant resigned due to health-related problems before the learning started. Two participants took part in the Braille course but quit before it ended. One participant did not participate in the follow-up experimental session. Therefore, the final number of participants was 17 (Age M = 21.00; SD = 1.37). We collected written informed consent before the study. We recruited all participants upon completing an online questionnaire focused on demographics, education, general linguistics, and health-related issues. To increase the subjects’ motivation to complete the training course, we recruited only students from a pedagogical university (The Maria Grzegorzewska University) in the experimental group (Siuda-Krzywicka et al., 2016; Bola et al., 2017b; Matuszewski et al., 2021). This is one of the very few schools with a possibility of a degree in typhlopedagogy - a branch of special education dealing with the education of visually impaired individuals.
Additionally, 21 right-handed demographically matched female students were recruited as a passive control group. Two participants resigned from the study before the end of its main part. The final sample consisted, therefore, of 19 participants (Age M = 20.84; SD = 1.57). Our recruitment criteria for controls were the same as in the experimental group, though we did not restrict our recruitment process to the pedagogical school. Furthermore, we matched controls demographically to the experimental group and found no statistically significant differences in age (t (34.77) = −0.33; p = 0.75; d = −0.11) and number of known foreign languages (t (30.90) = −0.59; p = 0.56; d = −0.19).
2.2 Experimental designDuring the study, the subjects in the experimental group took part in 7 behavioral and neuroimaging sessions: 2 pre-exposure (time point −1; TP−1 and TP0), 3 during (TP1 - TP3), 1 at the end (TP4) and one 3 months after the end of training (TP5). The control participants did not participate in the 1st pre-exposure session (TP−1) (see Figure 2 and Table 1 for an overview). The Committee for Research Ethics of the Institute of Psychology of the Jagiellonian University approved this study.
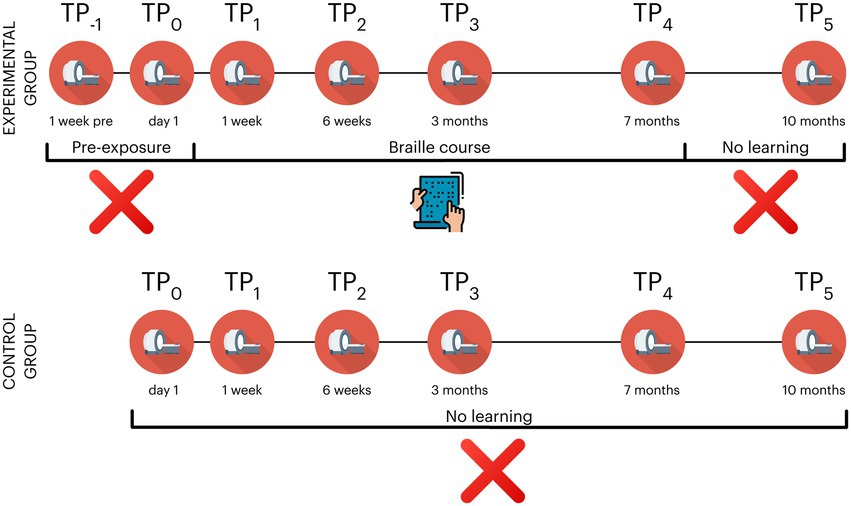
Figure 2. Overview of experimental design in the Braille learning (experimental) and passive control groups. The control group did not participate in TP−1 (a prescan a week before the beginning of the course); TP, time point. Icons created by Flaticon.
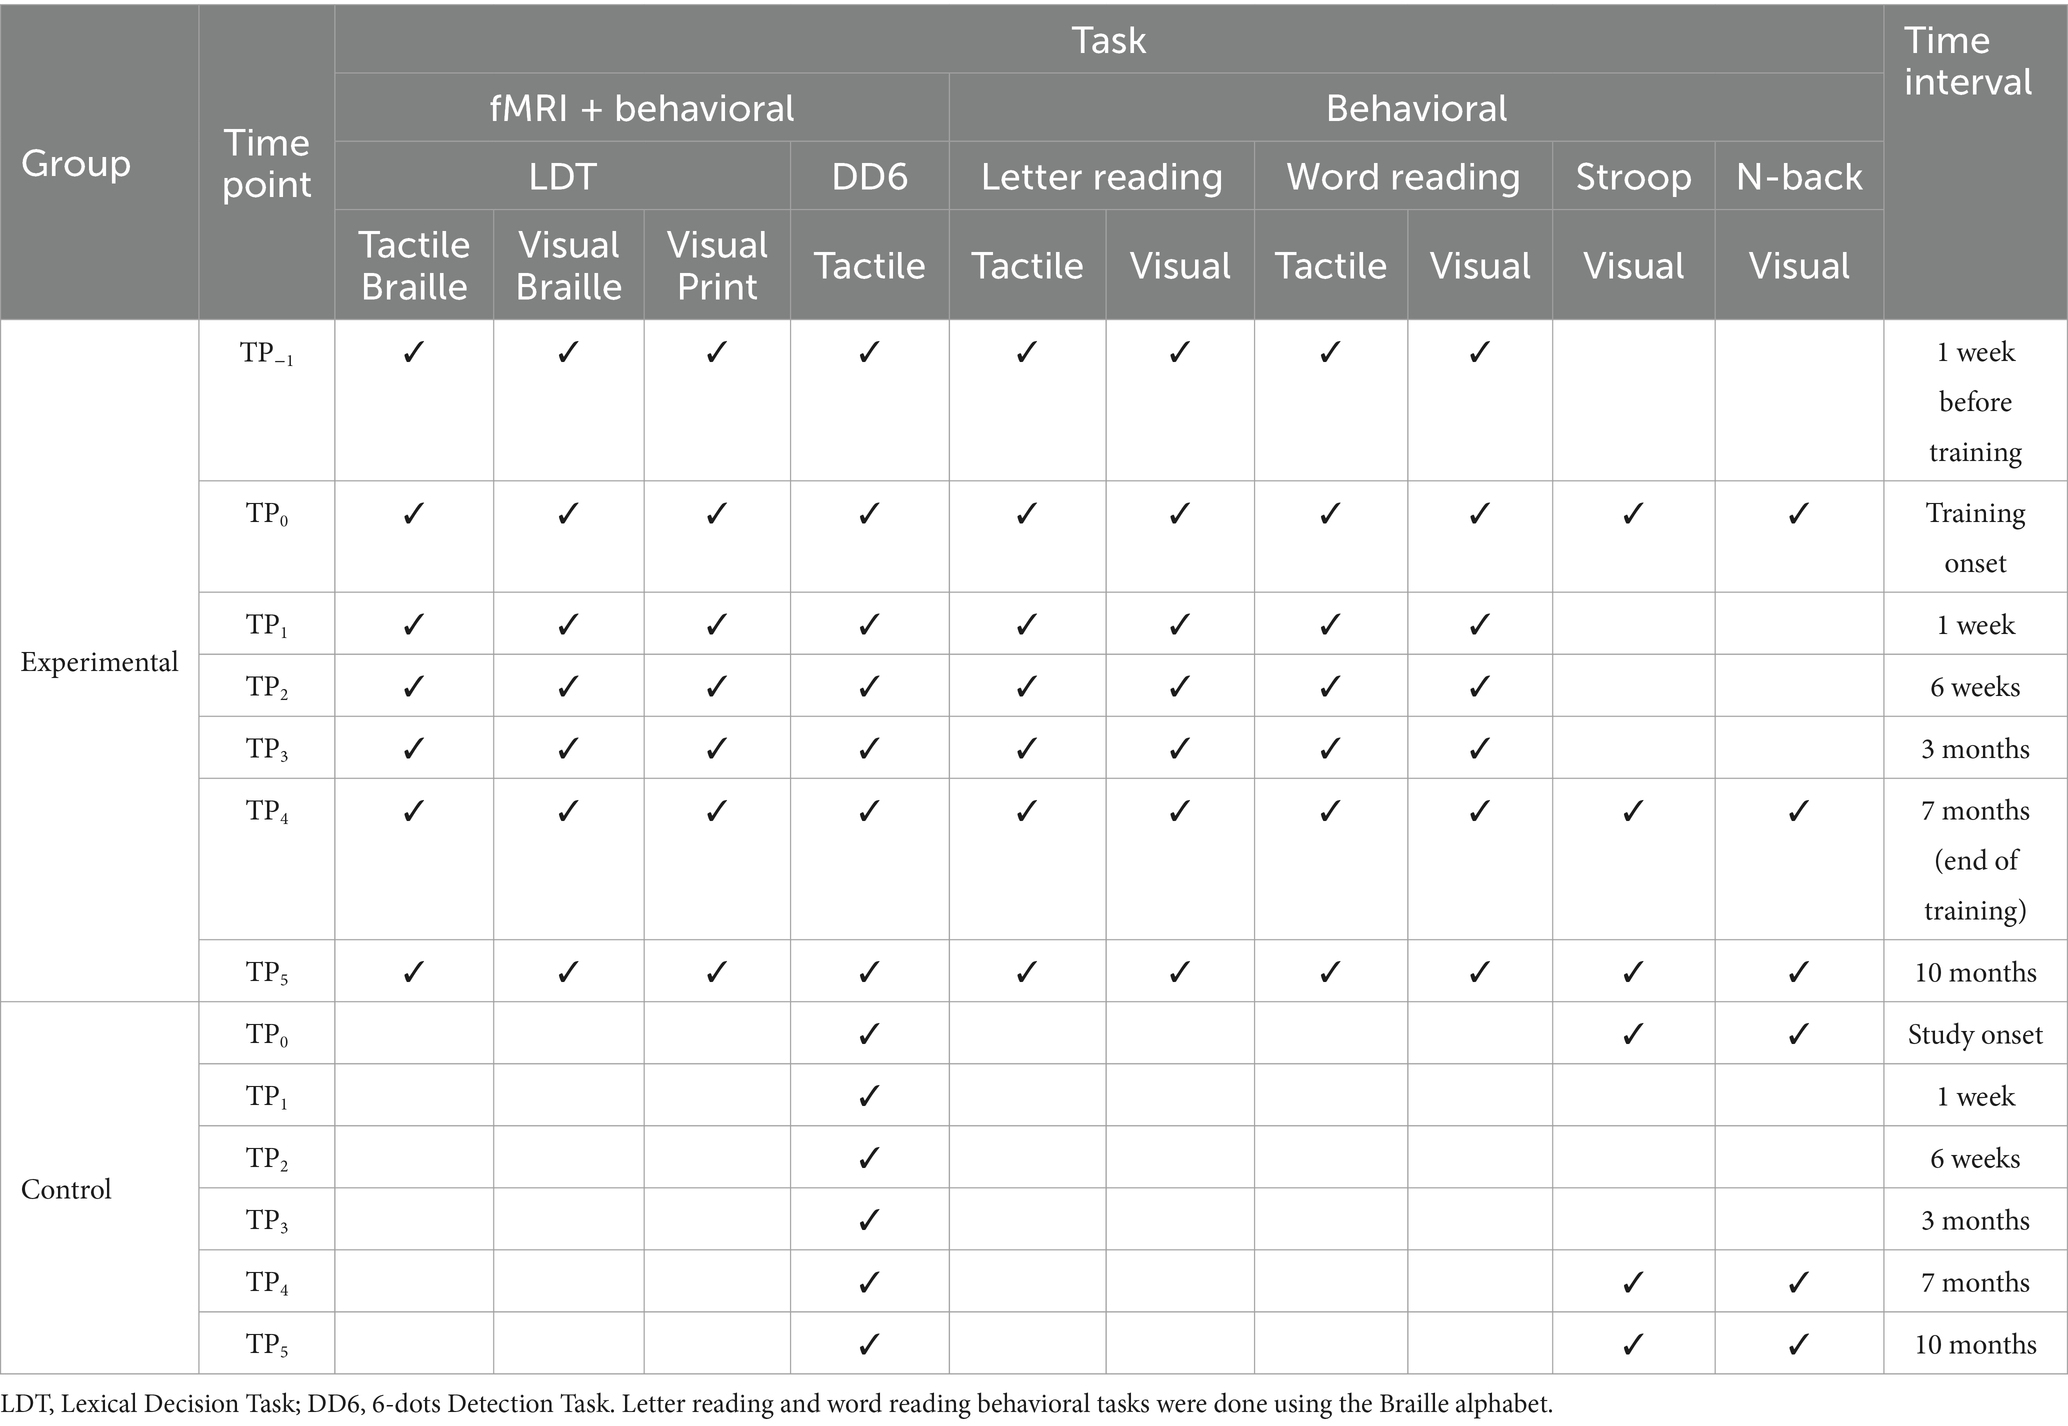
Table 1. Overview of the behavioral and fMRI tasks in the Braille learning (experimental) and passive control groups.
2.3 Braille courseThe tactile Braille reading course was scheduled for 6 months. Due to the ongoing SARS-CoV-2 pandemic and no possibility of conducting on-site research at the scheduled end of the course, we extended its duration to 7 months. The course involved 9 online meetings with an instructor and asynchronous work of all the participants (see Figure 2 for an overview) with 6 sets of Braille study cards (60 cards in the set for the first month and 30 in each set dedicated for the months 2–6). Each study card’s workload was estimated to take from 10 to 20 min of tactile reading - a total of approximately 52.5 h of self-practicing without any repetition. The first 3 meetings on the first, seventh, and fourteenth days were held in small groups of at most 5 students. All the other meetings were held in larger groups of around 10 students. To ensure similar progress in learning crucial for the initial stage of training in the first week, the participants received a list of individual tasks to do on a specific day of the course. The remaining weeks of the first month were organized in a weekly manner. The instructions for the remaining months were not organized in any timely manner - the participants were free to learn and process the material at their own pace, though they were highly encouraged to do one card a day. The course focused primarily on teaching to read Braille in the tactile domain. However, because the participants are sighted, they naturally supported the learning process using vision.
In line with previous Braille courses (Bola et al., 2016; Matuszewski et al., 2021), the current course introduced 32 letters and 2 symbols. The first week of the course was the most demanding. The participants had to practice the proper way of moving the hand through the Braille card or shape discrimination during the meetings and later by themselves. They were instructed to read with their right index fingers and navigate the Braille card using their left index finger. At the same time, the instructor introduced the easiest 8 letters (A, B, C, D, E, K, L, O). During weeks 2–5, 4 new letters (I, M, S, T) were introduced. During weeks 6–12, the participants were presented with the next 4 letters (Ł, P, U, Y). Sixteen letters introduced in the first 12 weeks of the course were considered the core letters of the study and were used in stimuli during the fMRI experimental sessions. While months 4–6 of the course focused on mastering the core letters, they also introduced new material to maintain high interest and engagement. The fourth month of the course introduced 2 new signs - a Braille dot and the capital letter sign. The fifth month of the course introduced 6 additional letters of the Polish alphabet (Ą, Ę, F, G, J, N). The sixth month of the course introduced the remaining 10 letters (Ć, H, Ń, Ó, R, Ś, W, Z, Ż, Ź). See Figure 3 for a graphical overview of the material during the Braille course.

Figure 3. The overview of learning material during the Braille course. The core letters used to create stimuli for fMRI tasks are colored green, orange, and red. Additional letters and symbols (marked in gray) were introduced during the course to equalize subjects’ engagement.
2.4 Behavioral measures 2.4.1 Braille reading testsAt each TP, we assessed the experimental group’s Braille words and letters reading skills in both visual and tactile domains. For both tasks, participants read aloud as many words or letters as possible in 1 min, and we counted correctly read stimuli. For the word-reading test, tests consisted of 15 words that were 3 to 5 letters long. Crucially, in every experimental session after the course started, the words selected for the test contained only those core letters that that specific stage of the Braille course had already introduced. The only exceptions to the rule were TP−1 and TP0, the time points before the beginning of the course, which used the whole set of core letters presented in the core part of the course.
On the other hand, the letter-reading test comprised 28 letters randomly selected from the learning material. To maintain consistency with the course, we used a pseudo-randomized order, ensuring that the already covered letters were presented before the ones that had not been introduced.
2.4.2 Cognitive testsOn 3 separate occasions - TP0 (day 1), TP4 (7 months), and TP5 (follow-up) the participants from both the experimental and the control group did 2 cognitive tasks: the Stroop task and the N-back task. All experiments were programmed using the Presentation software (Neurobehavioral Systems, Inc., 2022). We used versions of the tasks available on the software’s website as part of the Neurobehavioral Systems’ experiment packages. In both tasks, a Cedrus RB-540 Response Pad was used to gather responses.
The Stroop task consisted of two separate blocks. In the ink blocks, participants were asked to identify the color of stimuli. In the color name blocks, their task was to determine the name of the color spelled by the word. Each experimental stimulus could appear in or be named with one of four target colors (red, green, blue, or yellow). While the control stimuli in the ink blocks contained Xs rather than color names, the control stimuli in the color name blocks were written in black. The experiment consisted of 3 ink and 3 color name blocks, which were presented alternately. A single block comprised 72 trials, half incongruent and half neutral. A single trial started with a fixation cross presented for 500 ms, followed by the stimulus presented until the answer was given (but no longer than 5,000 ms). An empty interval of 1,000 ms separated the trials. Before the main experiment, the participants did a test run of the task, which consisted of 12 trials of each block type. Feedback was given only in the test run. The task lasted around 5 min, with the fastest participant finishing in 4 min and 51 s and the slowest in 6 min and 40 s.
The visual n-back task was created using single letters on three levels of difficulty: 1-back, 2-back, and 3-back. The participants were presented with a sequence of single letters and had to respond with a button press every time the presented letter was the same as the one n steps back. A single block comprised 50 trials, 10 of which were the target and 40 were control trials. A single trial consisted of a stimulus presented for 500 ms. An empty interval of 1,000 ms separated the trials. Before the main experiment, the participants did a test run of the task, which consisted of 8 trials of each block type.
2.5 MRI protocolsWe acquired the MRI data using a Siemens Trio 3 T scanner with a 32-channel coil. Structural T1-weighted (T1w) image was acquired with a standard MPRAGE sequence with the following parameters: Field of view: 256 × 256 mm, voxel size: 1 × 1 × 1 mm, Repetition time: 2,530 ms, Echo time: 3.32 ms, Flip angle: 7°, 176 slices. The functional and resting state data were acquired using an Echo Planar Imaging (EPI) pulse sequence (FOV: 210 × 205 mm, voxel size: 2.5 × 2.5 × 2.5 mm, Repetition time: 1410 ms, Echo time: 30.4 ms, Flip angle: 56°, Multiband factor: 3).
2.6 fMRI tasks and stimuli 2.6.1 Lexical decision tasksAt each TP, participants from the experimental group performed 3 types of LDTs in the MRI scanner in the following order: visual using the Polish print alphabet, tactile using the Braille alphabet, and visual using the Braille alphabet (Figure 4). Tactile stimuli were presented via an MRI-compatible Braille display (Debowska et al., 2013), and visual stimuli were presented on a screen. In the experimental condition, the participants had to decide whether the presented sequence of letters constituted a real word or was just a set of letters that resembled one but does not exist in the Polish language (pseudoword). In the control condition, the task was to decide whether a presented sequence of characters contained exactly two nonlinguistic symbols (hash signs (#) in the Latin alphabet task or Braille six-dot characters (⠿) in the Braille) among random consonants. The stimuli were prepared so that half of the trials contained exactly two nonlinguistic symbols, and half contained none of them. The participant responded (nonlinguistic symbols present/not present) using a response pad with their left hand at the end of each trial. In visual tasks, each block consisted of 8 stimuli presented for 1 s each. In the tactile task, each block consisted of 5 stimuli presented for 5 s each. Each block was preceded by a fixation cross (in pseudo-randomized duration between 6 and 8 s) and a visual indication of the block to be presented (2 s). Every stimulus was then succeeded by response time (2 s) and an inter-stimulus interval (ISI, 1–2 s).
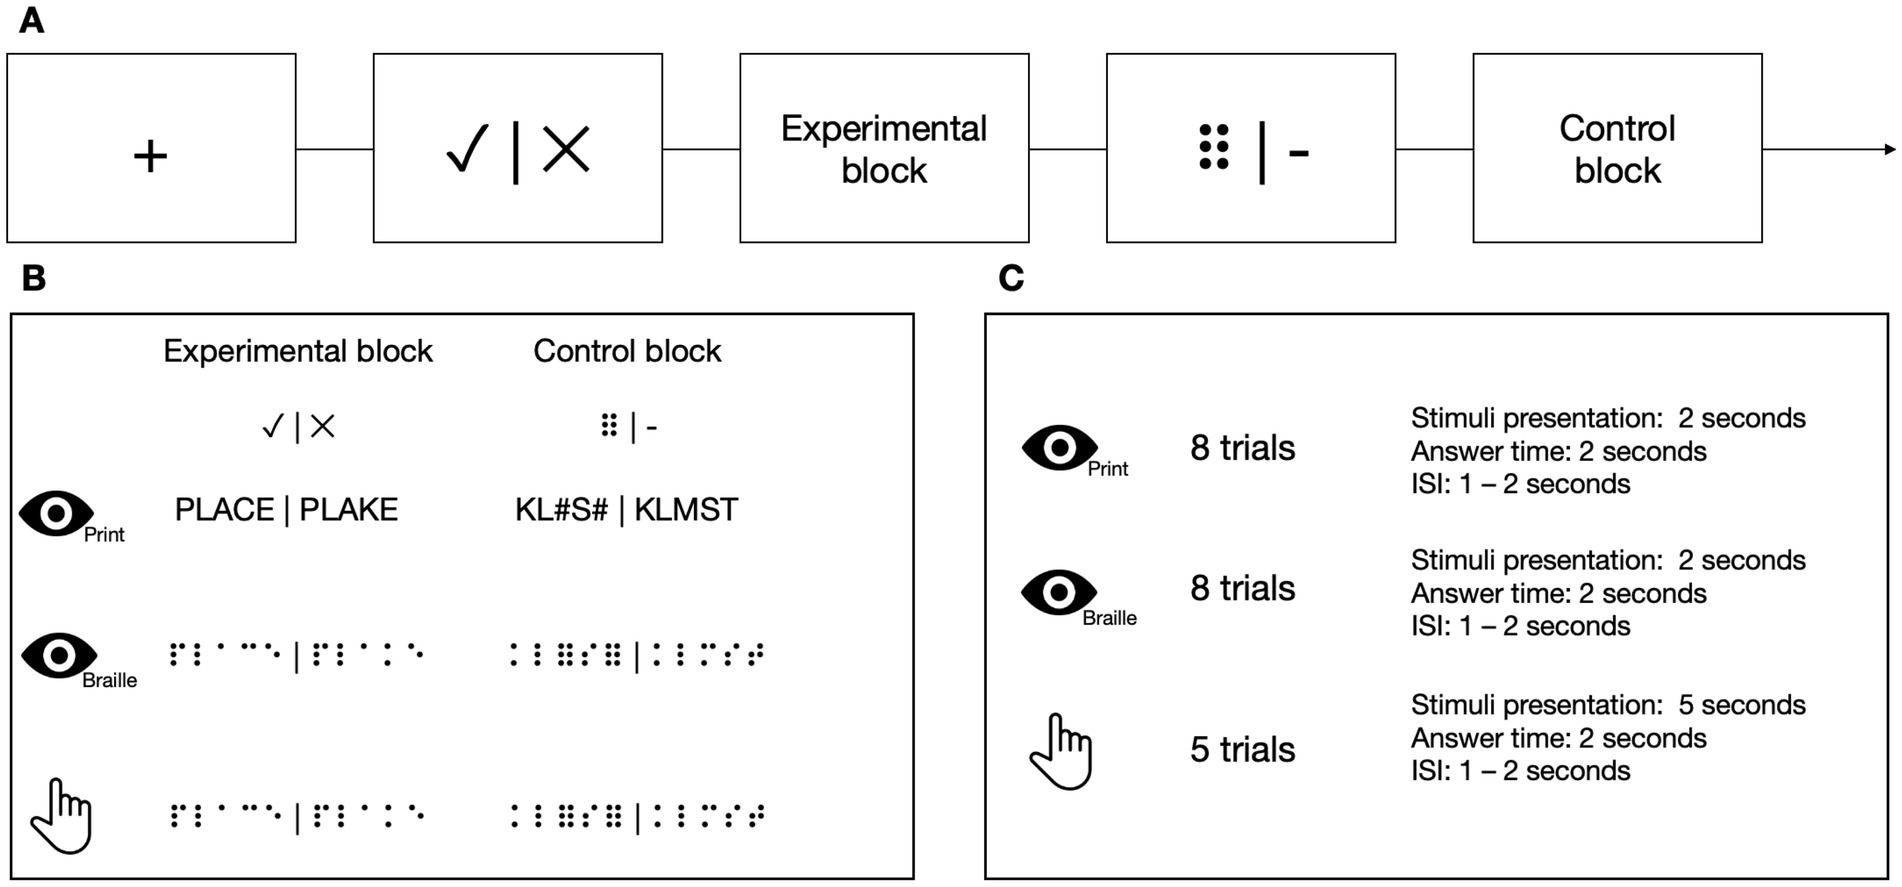
Figure 4. (A) The stimuli in Lexical Decision Tasks were presented in a block design. (B) In the experimental blocks, the participants had to decide whether the stimulus was a real word or a pseudoword. In the control blocks, the participants had to determine whether the presented stimulus contained two six-points (or hash symbols in the print visual task). (C) In visual tasks, each block consisted of eight stimuli. In the tactile task, each block consisted of five stimuli. Icons created by Flaticon.
In Braille tasks, the words were 3–5 letters long, consisting only of the core letters from the course (see point 2.3 for details). The only exceptions to these rules were TP−1 and TP0, the time points before the beginning of the course, which used the whole set of core letters presented in the core part of the course. All words had a frequency of occurrence higher than 1 per million, according to the SUBTLEX-PL database (Mandera et al., 2015). The pseudowords were created by changing 1 letter in the word.
2.6.2 6-dots detection task (DD6)To test subjects’ ability to read implicitly, we introduced a new task that could be used in both the experimental and control groups, the latter unfamiliar with the Braille alphabet (Figure 5). In the experimental condition, the participants sequentially moved their right index finger from left to right. They pressed a response button with their left hand whenever they detected a symbol of 6 dots (⠿) among random letter strings, resulting in 0, 1, or 2 responses per trial. The participants were not informed that approximately half of the stimuli in the experimental block included short, three-letter long words. The experimental blocks were separated by rest. Each block was preceded by a fixation cross (in pseudo-randomized duration between 6 and 8 s) and a visual indication of the block to be presented (1 to 2 s). In the experimental condition, each block consisted of 8 stimuli presented for 5 s each and an ISI which lasted 1 s. Each rest lasted 12 s.
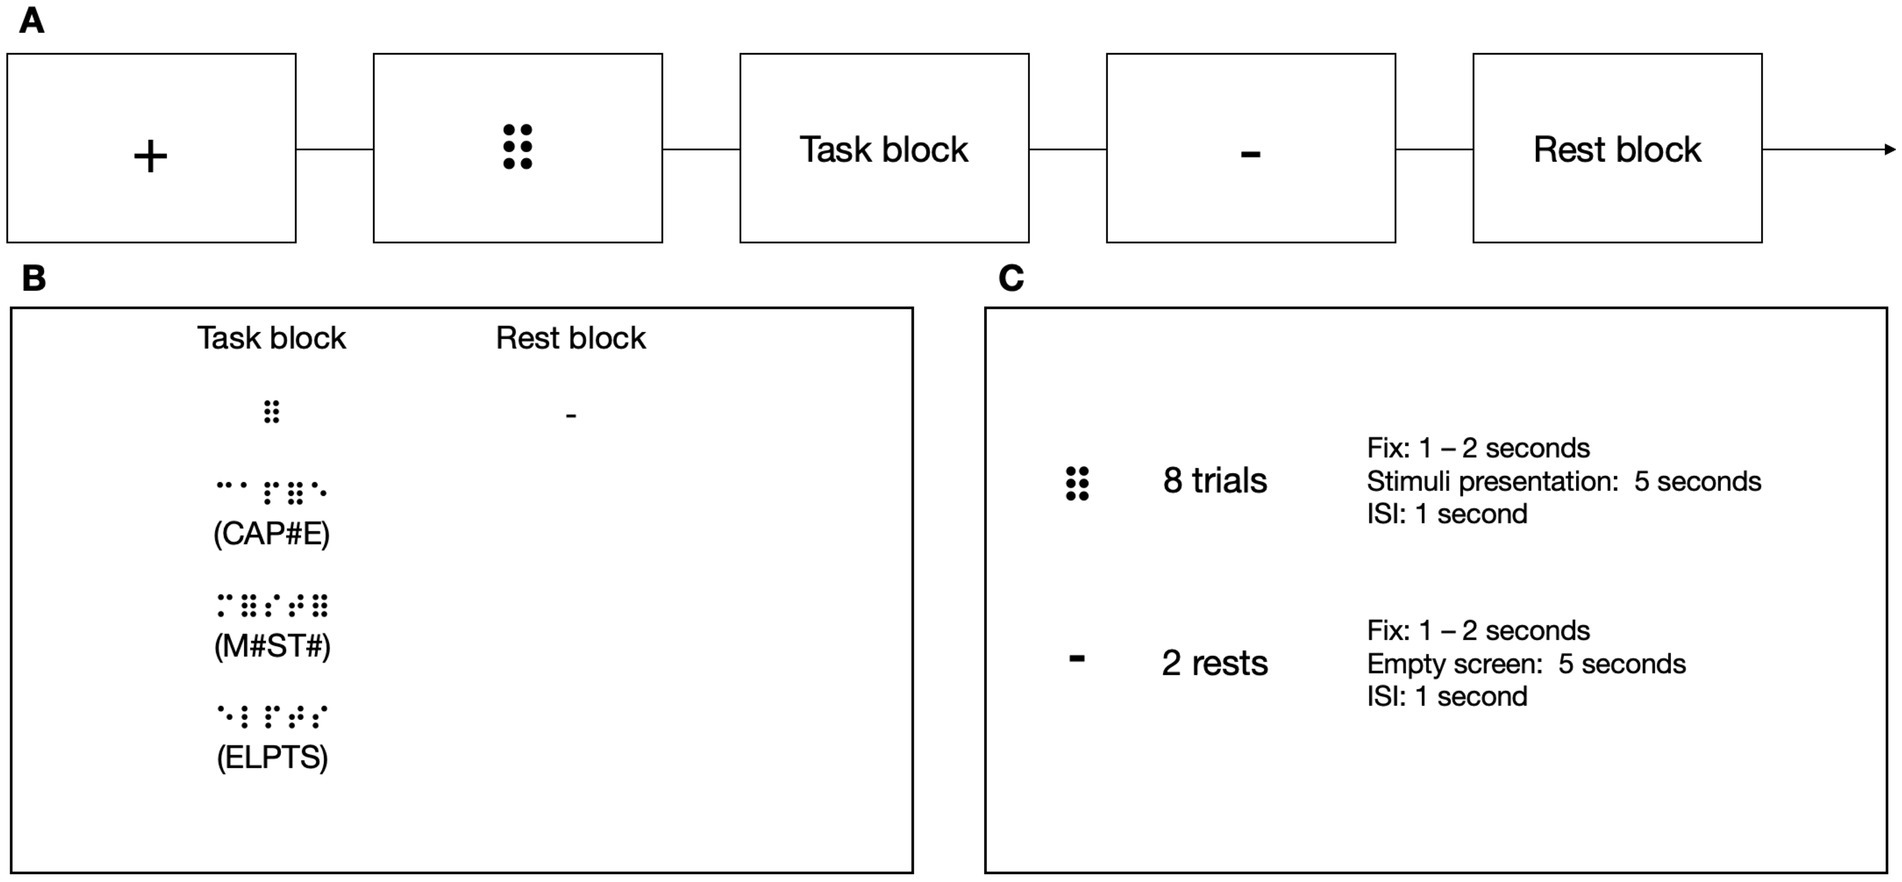
Figure 5. (A) The stimuli in the 6-dots Detection Task were presented in a block design. (B) In the task blocks, the participants had to move their right index finger from left to right and press a button with their left hand every time they detected a 6-dot symbol (⠿). The participants were unaware that some of the presented stimuli contained a simple three-letter long word. The participants had to wait during the rest while no sequence was presented. (C) Every experimental block consisted of eight stimuli, and every rest block consisted of two resting periods. Icons created by Flaticon.
2.7 Statistical analysis of behavioral dataWe used a repeated measures analysis of variance (rmANOVA) to analyze the Braille behavioral data. We computed a one-way analysis with time as a factor for Braille reading tasks. For the LDTs, we ran a series of two-way rmANOVAs (for each task separately), with time and condition as factors. In DD6, we ran a two-way mixed ANOVA, with time as a within-subject factor and group as a between-subject factor. We computed a three-way mixed ANOVA for cognitive tasks, with time and condition as within-subject factors and the group as the between-subject factor.
All post hoc tests were computed with Bonferroni correction for multiple comparisons. Greenhouse–Geisser F-tests and degrees of freedom corrections were used for cases with a violated sphericity assumption. Analyses were performed using the pingouin (Vallat, 2018) and statsmodels (Seabold and Perktold, 2010) packages written in Python and, in the case of a three-way ANOVA, using the rstatix library in R (Kassambara, 2023).
2.8 MRI data preprocessingEach subject’s data underwent preprocessing with fMRIPrep (Esteban et al., 2022). T1-weighted (T1w) images were corrected for intensity non-uniformity (INU) with N4BiasFieldCorrection (Tustison et al., 2010), distributed with ANTs 2.3.3 (Avants et al., 2008, RRID:SCR_004757). The T1w-reference was then skull-stripped with a Nipype implementation of the antsBrainExtraction.sh workflow (from ANTs), using OASIS30ANTs as the target template. Brain tissue segmentation of cerebrospinal fluid (CSF), white matter (WM) and gray matter (GM) was performed on the brain-extracted T1w using FAST [FSL 6.0.5.1:57b01774, RRID:SCR 002823, (Zhang et al., 2001)]. A T1w-reference map was computed after registration of T1w images from all sessions (after INU-correction) using mri_robust_template [FreeSurfer 6.0.1, (Reuter et al., 2010)]. Volume-based spatial normalization to two standard spaces (MNI152NLin2009cAsym, MNI152NLin6Asym) was performed through nonlinear registration with antsRegistration (ANTs 2.3.3), using brain-extracted versions of both T1w reference and the T1w template. The following templates were selected for spatial normalization: ICBM 152 Nonlinear Asymmetrical template version 2009c [(Fonov et al., 2009], RRID:SCR_008796; TemplateFlow ID: MNI152NLin2009cAsym), FSL’s MNI ICBM 152 non-linear 6th Generation Asymmetric Average Brain Stereotaxic Registration Model [(Evans et al., 2012), RRID:SCR_002823; TemplateFlow ID: MNI152NLin6Asym].
Each functional session for every subject underwent preprocessing with fMRIPrep (Esteban et al., 2022). A reference volume was created by aligning and averaging the single-band references (SBRefs). Preprocessing included head-motion parameters estimation using mcflirt [FSL 6.0.5.1:57b01774, (Jenkinson et al., 2002)], and slice-time correction using 3dTshift from AFNI [(Cox and Hyde, 1997), RRID: SCR_005927]. The BOLD time series were resampled onto their original, native space, correcting for head motion, producing preprocessed BOLD in the original space. Co-registration to the T1w reference used mri_coreg (FreeSurfer) and flirt [FSL 6.0.5.1:57b01774, (Jenkinson and Smith, 2001)]. We calculated several confounding time series, including framewise displacement (FD), DVARS, and three region-wise global signals using Nipype (Power et al., 2014). Noise correction was applied with physiological regressor extraction [CompCor, (Behzadi et al., 2007)]. After high-pass filtering the preprocessed BOLD time series, two CompCor variants were used: temporal (tCompCor) and anatomical (aCompCor). Motion artifact removal was done using independent component analysis [ICA-AROMA, (Pruim et al., 2015)] on the preprocessed BOLD on MNI space time-series post spatial smoothing. The functional data was smoothed with a 6 mm FWHM Gaussian kernel. Noise regressors were placed in the corresponding confounds file. Resamplings were done using antsApplyTransforms (ANTs) and mri_vol2surf (FreeSurfer). Internal operations used Nilearn 0.8.1 [(Abraham et al., 2014), RRID:SCR_001362].
2.9 Statistical analysis of functional dataFirst, functional data of three Lexical Decision Tasks (Print, Visual Braille, and Tactile Braille) and the 6-dots detection task were analyzed using a general linear model (GLM) at the subject level. The timings of experimental and control blocks (rest in DD6 task) were entered for each time point separately, together with six head movement regressors. The hemodynamic response was modeled using the default canonical functions of SPM 12.7771 (Penny et al., 2011). All data were filtered with a 128 Hz high-pass filter. In the LDTs, the experimental > control contrast was computed separately at each time point for every variant of the task (print, visual Braille, tactile Braille) for each subject. In the DD6, the experimental contrast was computed separately for task activation against the global baseline at each time point for each subject. Each contrast was additionally masked using a group-level brain mask from the fMRIPrep preprocessing pipeline.
On the group level, the GLMs were specified using SPM12’s flexible factorial models tailored separately to find answers to each research question. Results were thresholded at a voxel level with a Family-Wise Error (FWE) comparisons correction with a p-value of 0.05 and a cluster extent of 20 voxels. All anatomical structures were labelled with the Automated Anatomical Labelling (AAL) atlas (Rolls et al., 2020).
To find answers to the research questions introduced in this paper, a series of analyses has been carried out on several models:
To answer the first question (at which stage does the reading network become involved in visual and tactile Braille reading?), we introduced 2 main rmANOVA models for each Braille Lexical task (Visual and Tactile), with time (TP0 - TP5) and subject as factors. To control the effect of task repetition, we introduced 3 additional models: paired t-tests for each Braille task with pre-training time points (TP−1 and TP0) and subject as factors, as well as a rmANOVA model for the Print LDT, with time (TP0 - TP5) and subject as factors. Additionally, we extracted the contrast estimates for every time point from the single most active voxel in the 4 most active areas of the reading network in Tactile and Visual Braille LDTs (using experimental condition > control condition contrast). This allowed us to visually inspect the time courses throughout the study and compare the general trends in activation levels.
We aimed to answer our second question (what are the specific brain networks engaged in Tactile and Visual Braille reading?) by creating a single rmANOVA model with the Lexical task (Print, Visual Braille, and Tactile Braille [TP0–TP5 pooled together]) and subject as factors. To find regions active in Braille reading regardless of domain, we computed the conjunction of the main effects of the condition in Tactile and Visual Braille LDT. We extracted voxels not specific to Braille reading voxels by excluding any active ones in the Print LDT. To find Braille-activated regions specific to tactile reading, we looked at the main effect of condition in this Tactile LDT with voxels active in Visual Braille or Print LDT excluded. To find Braille-activated regions specific to visual reading, we looked at the main effect of condition in this LDT with voxels active in either Tactile Braille or Print LDT excluded.
A final model was introduced to answer the third question (can the involvement of the reading network be observed during implicit Braille reading?) by doing mixed ANOVA and analyzing the DD6 task with group (experimental, control) and time (TP0-TP5) interaction and subject as factors.
3 Behavioral results 3.1 Braille reading testsDuring our assessment of Braille reading proficiency, participants were evaluated across both visual and tactile domains at different time intervals. In the visual Braille letter reading assessment, a one-way rmANOVA revealed a significant main effect of time, F (6, 96) = 263.43; p < 0.001; etap2 = 0.94. All post-hoc comparisons were significant except for TP−1 and TP0, TP2 and TP3, and TP3 and TP5. Notably, performance improved consistently from TP1 to TP4 but declined at TP5 after a 3-month break (Table 2; Figure 6).

Table 2. Visual Braille letters reading speed: post-hoc comparisons between time points.
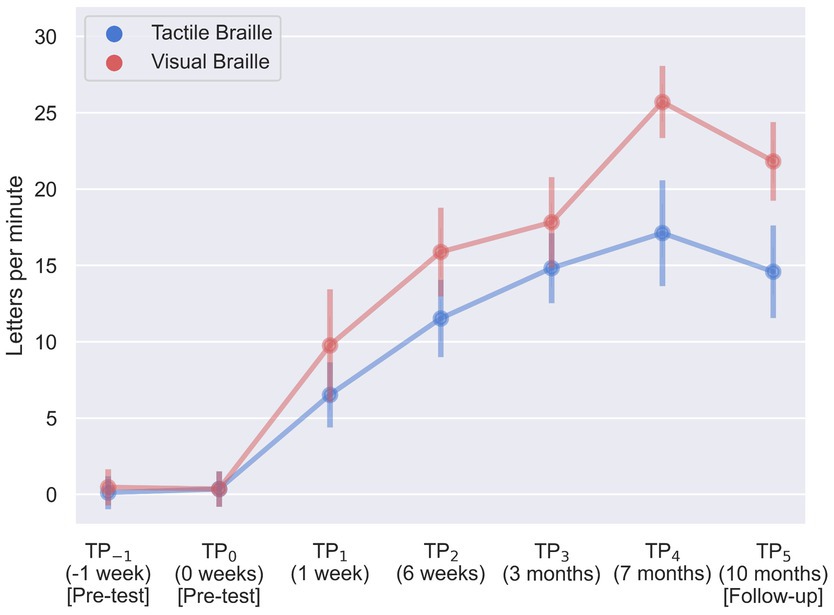
Figure 6. Visual and tactile Braille letters reading speed during training. Error bars represent standard deviations adjusted for within-subject designs (Cousineau, 2005); TP, time point.
In the tactile Braille letter reading assessment, a main effect of time was observed, F (6, 96) = 153.53; p < 0.001; etap2 = 0.91. All comparisons were significant, with the exceptions of TP−1 and TP0, TP2 and TP5, TP3 and TP4, TP3 and TP5, and TP4 and TP5 (Table 3; Figure 6).

Table 3. Tactile Braille letters reading speed: post-hoc comparisons between time points.
The visual Braille word reading analysis revealed a significant main effect of time, F (6, 96) = 115.43; p < 0.001; etap2 = 0.88. All comparisons were significant, except for TP−1 and TP0, TP1 and TP2, TP2 and TP5, TP3 and TP4, TP3 and TP5, and TP4 and TP5 (Table 4; Figure 7).

Table 4. Visual Braille words reading speed: post-hoc comparisons between time points.
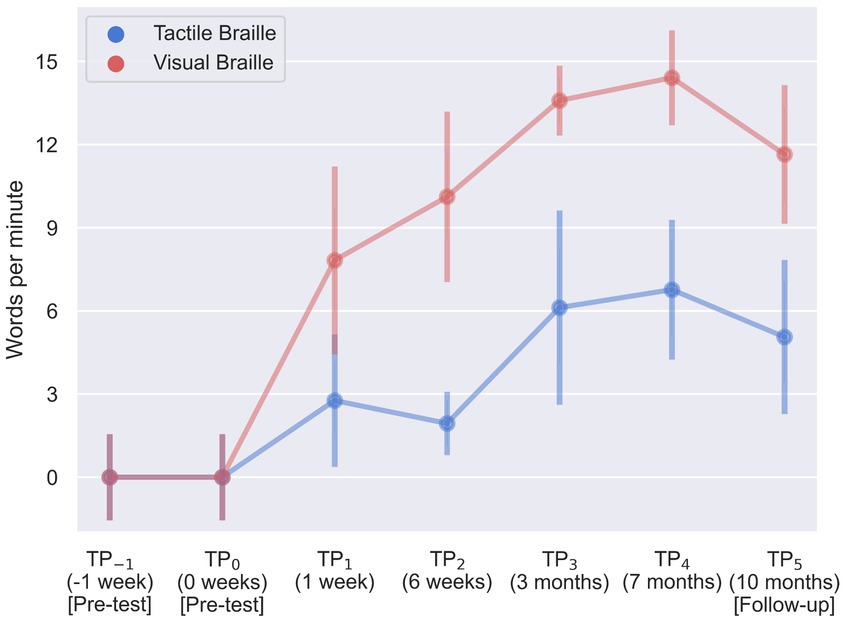
Figure 7. Visual and tactile Braille word reading speed during training. Error bars represent standard deviations adjusted for within-subject designs (Cousineau, 2005); TP, time point.
Lastly, results were significant in the tactile word reading domain with F (6, 96) = 23.61; p < 0.001; etap2 = 0.60. All post-hoc tests were significant, except for TP−1 and TP0, TP1 and TP2, TP1 and TP3, TP1 and TP5, TP3 and TP4, and TP3 and TP5 (Table 5; Figure 7).

Table 5. Tactile Braille words reading speed: post-hoc comparisons between time points.
3.2 Lexical decision taskWe employed a 7 (time) x 2 (condition) rmANOVA to analyze the behavioral data for each Lexical Decision Task.
For the Print LDT, a significant interaction between time and condition was observed [F (6, 96) = 3.70; p = 0.002]. Bonferroni pairwise comparison indicated that the experimental block correctness at TP2 was significantly lower than TP−1 and TP5 (Table 6; Figure 8). However, performance was at the ceiling level in all TPs, ranging from 95.88 to 98.53%. The control condition showed no significant time differences.

Table 6. Print Lexical Decision Task accuracy in the experimental condition: post-hoc comparisons between time points.
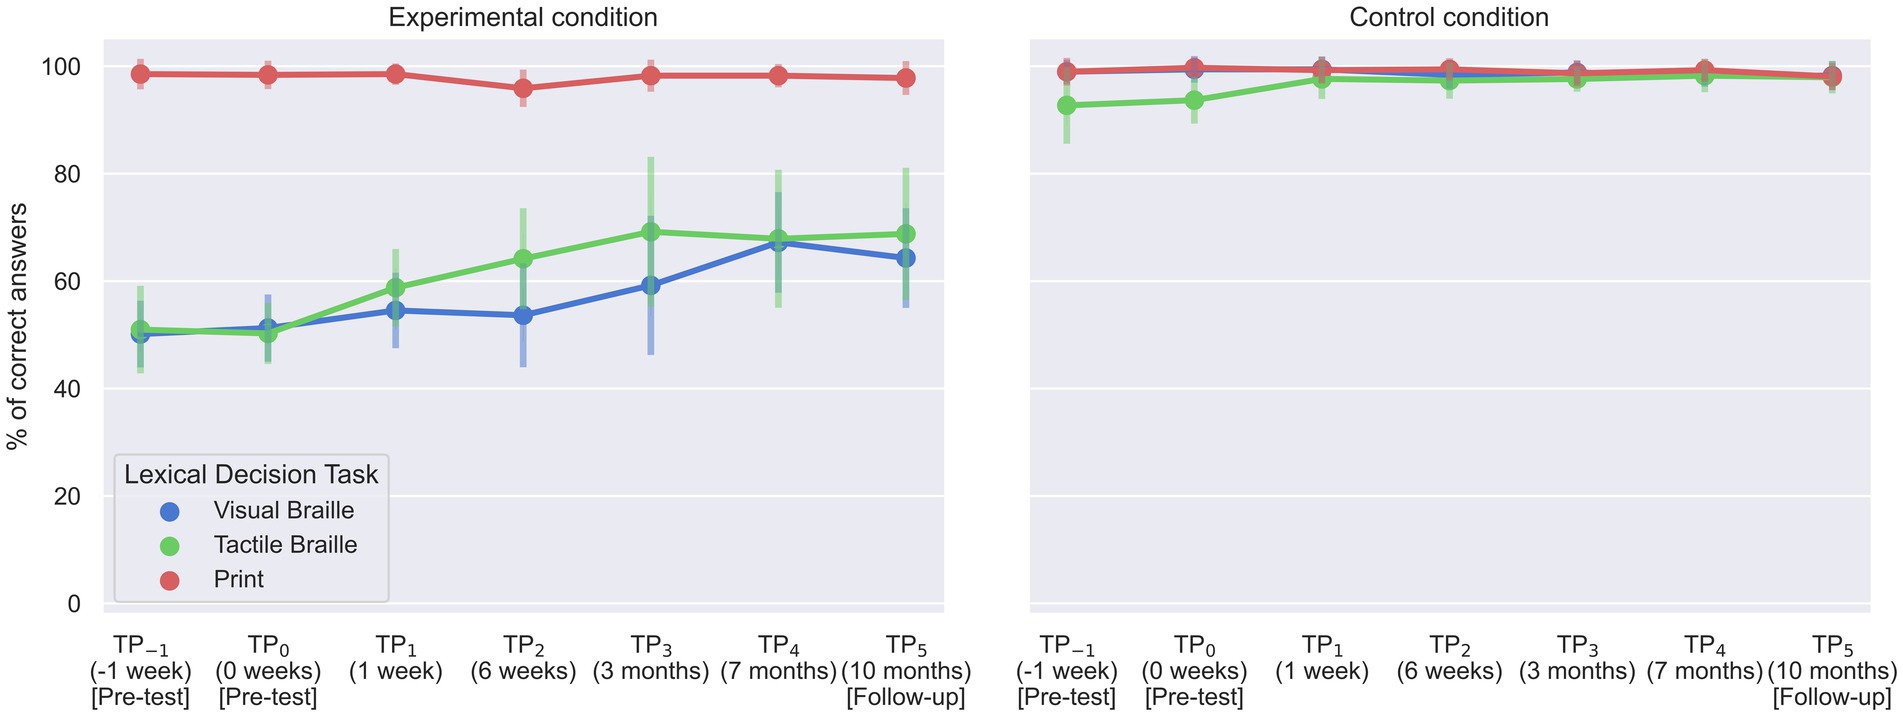
Figure 8. Accuracy of experimental group responses in Lexical Decision Tasks. Error bars represent standard deviations adjusted for within-subject designs (Cousineau, 2005); TP, time point.
For the Visual Braille LDT, the interaction was also significant [F (6, 96) = 9.45; p < 0.001]. The experimental task correctness was notably higher at TP4 than at TP−1, TP0, TP1, and TP2 and increased further at TP5 compared to TP−1 and TP0 (Table 7; Figure 8). Again, the control condition showed consistent performance across time points.

Table 7. Visual Braille Lexical Decision Task accuracy in the experimental condition: post-hoc comparisons between time points.
Finally, in the Tactile Braille LDT, the interaction effect was significant [F (2.65, 42.33) = 5.67; p = 0.003]. The experimental task showed decreased correctness at TP−1 compared to TP2, TP3, TP4, and TP5. Additionally, TP0 had lower correctness than TP1, TP2, TP3, TP4, and TP5. In contrast, the control condition presented higher correctness at TP4 than at TP0 (Tables 8, 9; Figure 8).

Table 8. Tactile Braille Lexical Decision Task accuracy in the experimental condition: post-hoc comparisons between time points.
留言 (0)