Bioelectrochemical systems (BESs) are emerging as a promising technology for wastewater treatment, offering a dual benefit of environmental cleanup and renewable energy generation. BESs are particularly effective at generating renewable energy, such as direct electricity, methane, and hydrogen, by converting the chemical energy of organic compounds into electrical energy using the catalytic activity of specific electroactive microorganisms (Cruz Viggi et al., 2019; Zheng et al., 2020; Dubuit et al., 2023; Kong et al., 2023). This approach not only supports long-term operation with minimal maintenance costs but also reduces the expenses associated with wastewater (WW) treatment (Wang et al., 2022).
Recently, BESs have demonstrated significant potential for applications beyond conventional WW treatment, particularly in the breakdown of persistent organic pollutants. Bioelectroremediation has become an area of growing interest, effectively addressing various pollutants in wastewater, including phenolic compounds (Ailijiang et al., 2021), antibiotics (Zhang et al., 2024), dyes (Saadaoui et al., 2023b), aromatic hydrocarbons (Hao et al., 2020) and pesticides (Saidi et al., 2022). The rising dependency on water in industrial processes has exacerbated water scarcity due to intense anthropogenic activity (Mancosu et al., 2015). In this context, BESs offer a promising strategy for not only recovering water resources but also converting toxic compounds into safe by-products, paving the way for sustainable environmental remediation.
However, untreated WW from human activities, which is often discharged into rivers and seas, remains a significant source of water quality degradation (Naik and Jujjavarapu, 2021). Among the various pollutants, pesticide residues represent a critical environmental challenge due to their widespread presence and toxicity (European Commission, 2019). Thiabendazole (TBZ) is a benzimidazole fungicide that is frequently detected in fruits packaging WW (FPWW) as it is commonly used during postharvest treatment to eradicate fungi infestations. Up to 2,000 ppm of TBZ solutions are used in the dipping procedure, leading to residual TBZ levels in fruits that can reach up to 3.2 mg kg−1 (Portilla-Sangabriel et al., 2022). TBZ is transferred into the water during washing, creating wastewater with high TBZ concentrations. TBZ has been detected in surface water worldwide, with concentrations ranging from 0.9 to 330 ng L−1 across regions including Africa, China, Europe, and the United States (Pérez et al., 2013; Odendaal et al., 2015; Fang et al., 2019). Therefore, several methods have been developed to clean these effluents. Advanced oxidation processes (AOPs) are the fastest-growing technique for treating industrial WW with a significant challenge for industrial-scale application due to their high operating cost (Babu Ponnusami et al., 2023). As examples of AOPs processes, photocatalytic nanofiltration reactor (Theodorakopoulos et al., 2023), photocatalytic process, operated in heterogeneous systems (Ranjbari et al., 2022) integrated into two different processes to enhance the treatment efficiency. However, many challenges occur once they are implemented. Currently, some treatment technologies are at an operating industrial scale, including the As-Samra WW Treatment Plant in Jordan (Al-Mashaqbeh et al., 2019) which examined the occurrence and removal efficiency of pharmaceuticals and personal care products using a combined membrane bioreactor reverse osmosis/nanofiltration systems; however, the authors reported a negative removal efficiency rate for TBZ. Another study demonstrating the efficient removal of 99% of TBZ using a solar photo-Fenton treatment (Carra et al., 2015) in a raceway pond reactor in an agro-food industry enriched with 100 μg L−1 of the fungicide, although they did not mention the possibility of generating hydroxyl radicals, the amount of energy consumed, and the operating expense required for this treatment. Biological processes for TBZ degradation have also been explored. For example, Perruchon et al. (2017) isolated a bacterial consortium able to degrade TBZ, and bioaugmentation approaches have been applied to enhance this process (Papadopoulou et al., 2018). In addition, combined treatment processes are shown to be a promising alternative to treat WW. Combining biological processes with AOPs has shown promise for achieving sustainable degradation of toxic pollutants while reducing costs and chemical consumption (Nidheesh et al., 2022).
Previously, we demonstrated combining electrochemical techniques with biological processes for treating synthetic FPWW (SFPWW) containing TBZ (Saidi et al., 2022). The study highlighted the potential of BESs inoculated with halotolerant bacteria under weak electrostimulation for TBZ remediation in an aqueous solution. This research underscored the utility of Tunisian hypersaline sediments (THSs) for developing bioanodes tailored for persistent pollutant biodegradation. Despite these promising results, further studies are needed to enhance the efficiency of TBZ degradation and detoxification.
We focused on optimizing the bioelectroremediation process to address this knowledge gap by employing biostimulation. This is intended to boost the growth and metabolism of microorganisms in regard to TBZ. Biostimulation is a method that involves enhancing the activity of indigenous microorganisms to increase their ability to break down pollutants in a contaminated area for remediation purposes. Several studies have demonstrated the positive impact of using biostimulation for the bioremediation of many contaminants, such as diesel compounds (Meyer et al., 2018), chlorinated hydrocarbon (Dutta et al., 2022) and pesticides (Raffa and Chiampo, 2021). We hypothesize that biostimulation can improve BES performance for TBZ degradation by enhancing microbial activity and community structure.
This study aimed to evaluate the impact of biostimulation on the THS microbial consortium for enhancing TBZ degradation in BESs and biological controls (BIOs) using SFPWW. Taxonomic analysis was performed to assess microbial community shifts following TBZ exposure, and analytical techniques were used to evaluate TBZ degradation and detoxification. This research provides insights into optimizing BESs for treating TBZ-contaminated wastewater, advancing the field of bioelectroremediation.
2 Materials and methods 2.1 ChemicalsAn analytical standard of TBZ (≥99% purity, Sigma–Aldrich) was used for analytical purposes, and a suitable bioreagent of TBZ (T5535, Sigma–Aldrich) was also used for the experiments. Dichloromethane (DCM stabilized with ~20 ppm for amylene) for TBZ extraction was purchased from AppliChem (75–09-2).
2.2 Sample collection and physicochemical analysisTHS used as a source of halophilic microorganisms were collected from a hypersaline lake, Chott El-Djerid (CJ) located in the south of Tunisia (N: 33° 57.272′ E: 008° 24.393′) in September 2023. Samples were mixed, secured in sterile bags, and stored at +4°C until experiments were run. The physicochemical analyses of conductivity, pH, total organic carbon, and PO43−, SO42−, Na+, K+, Ca2+, Mg2+, Fe2+, and Cl− the content of the sediments sample were carried out using conventional methods, in a specialized environmental analysis laboratory, Mediterranean Center for Environmental and Industrial Analysis (CMA AZUR LAB).
2.3 Biostimulation strategy of Chott El-Djerid sediment (CJS)A bulk of sediment samples were used without biostimulation, which has no prior hint of TBZ exposure serving as a reference point for comparison (CJS-0). Then, a series of three stimulations were conducted, each involving the addition of different concentrations of a TBZ, spaced 15 days apart between treatments, as indicated below. TBZ solutions were prepared by diluting the stock solution in deionized water according to the following formula:
TBZippm=TBZmgkg−1]×msed(kgVLwhere TBZi is the initial concentration of TBZ solution, TBZ is the concentration of thiabendazole in sediment (mg kg−1), msed is the mass of sediment that has been treated in kg, and V is the volume (in L) of the TBZ-prepared solution.
The first biostimulation step was to stimulate the microbial community within sediments by introducing an initial concentration of 10 mg kg−1 for CJS-1. In the second phase of biostimulation, 100 mg kg−1 was added for CJS-2. Finally, in the third stimulation phase, TBZ concentration was increased by incorporating 300 mg kg−1 for CJS-3. Figure 1 shows the various biostimulation phases.
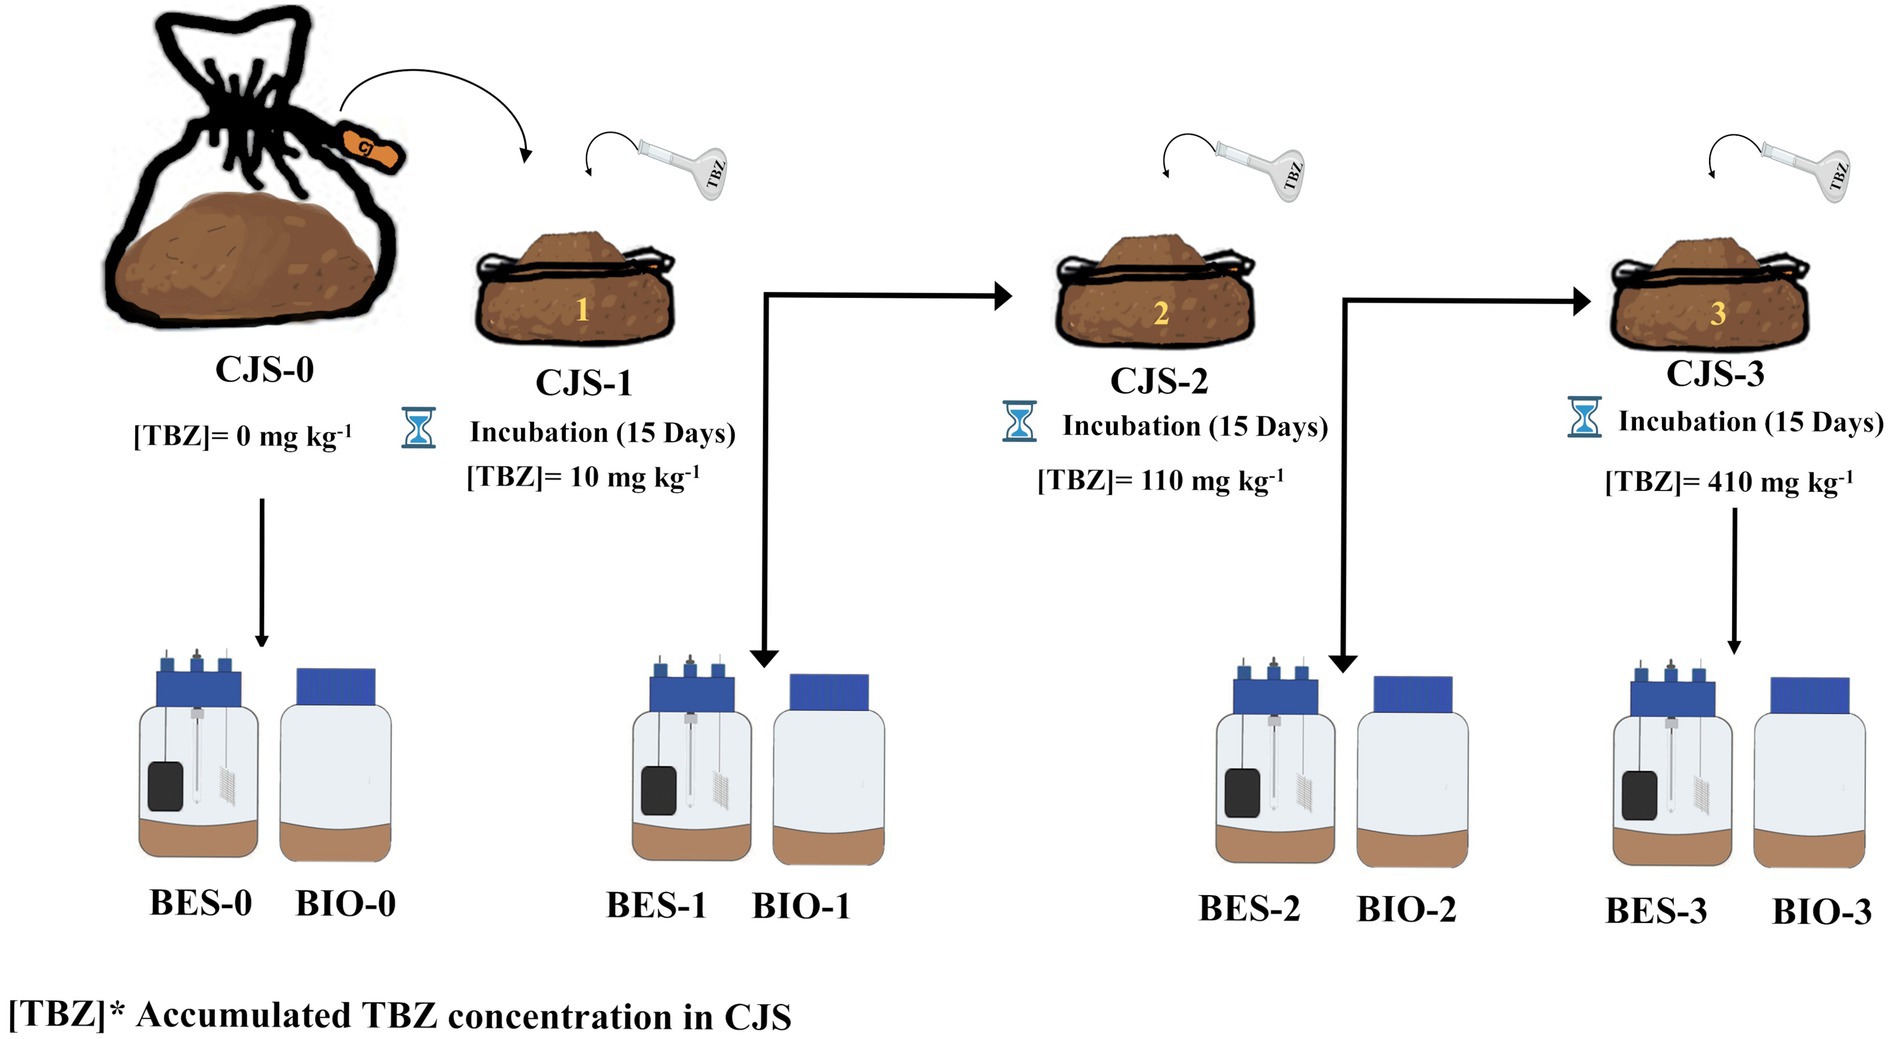
Figure 1. Schematic illustration for biostimulation strategy of Chott El-Djerid sediment (CJS).
2.4 Bioelectrochemical experimentsThe combined effects of the biological and the electrochemical stimulation of CJS were studied in single-compartment BES (Duran Schott glass 550 mL) set up with a three-electrode system. The working electrode (WE) was made of carbon felt with a geometric area of 36 cm2 (6 cm × 6 cm), the platinum counter electrode (CE) was positioned opposite each other, and the saturated calomel reference electrode (SCE) was placed as near as possible to the WE. The WE was polarized at +0.1 V vs. SCE using a multichannel potentiostat (Bio-Logic SA) operated by the EC lab software, and the current was recorded every 20 min.
All the experiments were systematically carried out in triplicate. The reactors were maintained at 25 ± 1°C, the pH was 7 ± 0.1. Each reactor had 20% of CJS either non-biostimulated or biostimulated at different levels, along with 80% of SFPWW. SFPWW is a modified synthetic medium which contains the following substances in g L−1: 0.1 KCl, 0.6 NaH2PO4, 1.5 NH4Cl, 2.5 NaHCO3, 0.1 MgCl2, 0.01 CaCl2, and a trace mineral mix (10 mL L−1, ATCC MD-TMS) (Bridier et al., 2015). Approximately 30 ppm of glucose (Glu) was added as a co-substrate and 150 ppm of TBZ as the substrate.
Biocontrol experiments (without electrodes) were carried out in parallel with bioelectrochemical experiments under the same conditions. Table 1 summarizes the various BESs, and BIOs carried out in this study. A total of 24 reactors were used to study eight different conditions: BES inoculated with CJS at stimulation levels of 10, 100, and 300 mg kg−1 in reactors named BES-0, BES-1, BES-2, and BES-3 with electrodes and BIO-0, BIO-1, BIO-2, and BIO-3 without electrodes, respectively.
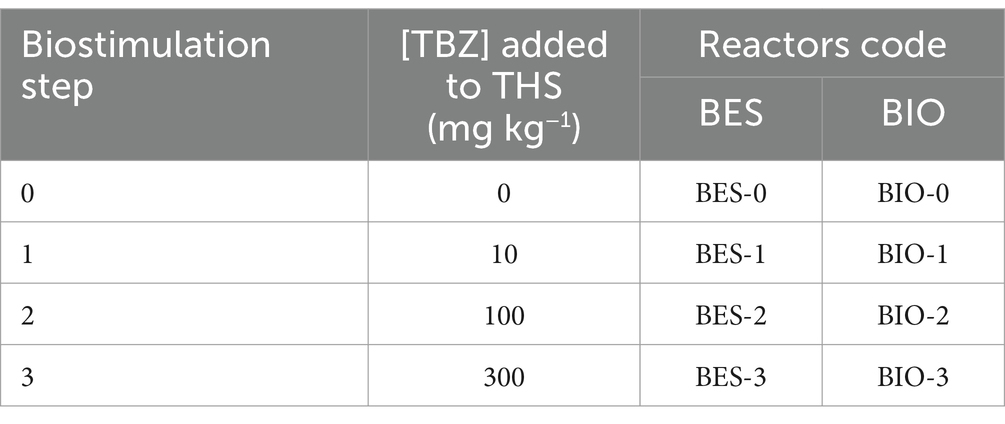
Table 1. Bioelectrochemical and biological experiments conducted in this study.
2.5 Anodic biofilm pretreatment and architecture studyAfter bioelectrochemical TBZ degradation experiments in different BES, chronoamperometry was stopped, and relative bioanodes were investigated using scanning electron microscopy (SEM) to visualize the surface structure and Confocal laser scanning microscopy (CLSM) to analyze the total cells and the exopolymeric matrix of the formed biofilm. For the SEM visualization, samples were fixed with 4% glutaraldehyde, washed, and dehydrated with different concentrations of acetone then left to dry. Prior to the examination, they were metalized with gold (Au) and then observed with Leo 435 VP-Carl Zeiss SMT. For the CLSM analysis, samples were stained with a combination of three fluorescent dyes following the protocol described by Martinez Ostormujof et al. (2023): Concavalin A tetramethylrhodamine conjugate (ConA-TMR, Thermofischer Scientific) at 0.1 g L−1 for α-polysaccharides, fluorescein isothiocyanate isomer I (FITC, Merck) at 0.05 g L−1 for proteins and 4′,6-diamidino-2-phenylindole dihydrochloride (DAPI, Merck) at 1.05 × 10⁻⁴ g L−1 for total cells. After completing 30 min spent in contact with the mixed solution, the carbon-felt electrodes were delicately rinsed with a physiological solution and then observed after 48 h. A Leica SP8-2017 microscope with 10× 0.30−1 objective (HC PC FLUOTAR) in dry immersion was used to visualize the samples. Images were acquired by LAS-X software (Leica Microsystems), two stacks of horizontal plane images (1,024 × 1,024 pixels) were captured for each sample, and the z-stacks were then registered to build three-dimensional (3D) images of the biofilm using ImageJ’s 3D script plugin (Schindelin et al., 2012).
2.6 Glucose and TBZ degradation analysis 2.6.1 TBZ UV–visible analysisTo evaluate the TBZ degradation rate, a calibration curve was established with standard solutions at concentrations of 0, 2, 5, 10, 15, and 20 ppm using Jenway 7315 ultraviolet–visible (UV–Vis) spectrophotometer in the range of 190–350 nm. The characteristic peak of TBZ observed at 298 nm, was used to determine the fungicide’s residual content in various reactors.
2.6.2 Gas chromatography analysisA gas chromatography (GC) system equipped with a flame ionization detector (FID) was used to consolidate UV–visible results. TBZ was extracted from liquid solution as follows: 3-ml aliquot of each sample was placed in a 10-ml glass centrifuge tube to which 3 mL of DCM was added. The mixture was stirred in a vortex mixer for 1 min, then 2 g of MgSO4 and 0.5 g of NaCl were added. After vortexing for 5 min, the extract was centrifuged at 4,000 rpm for 10 min to remove the top layer. Approximately 2 mL of the organic layer extract was transferred into a clean-up tube containing 0.5 g of MgSO4, vortexed then centrifuged at 4,000 rpm for 1 min. Finally, 300 μL of the extract was purified through a 0.22 μm filter membrane and analyzed using a Thermo Scientific Trace 1310 GC-FID. Capillary column type CB-CP WAX 52 (25 m × 0.25 mm; film thickness 0.2 μm) using helium as the carrier gas. The GC-FID operating conditions were modified as discussed by Kai et al. (2023) as follows: injector temperature, 280°C; detector temperature, 300°C; oven temperature program—initial temperature 80°C held for 0 min and ramp temperature 10°C min−1 to 275°C held for 14 min. The method validation was carried out by linearity, which was evaluated by the correlation coefficient (R2) of the matrix-matched calibration curves of the TBZ standard. The accuracy and precision were conducted by recovery experiments at 2, 5, 30, 80, and 120 ppm with triplicates. Based on the results, good linearity was obtained with a determination coefficient value of 0.999.
2.6.3 FTIR spectrometry analysisTBZ solutions were analyzed before and after the BES degradation study as a way to detect any modifications in the functional groups of the fungicide. Fourier transform infrared spectroscopy (FT-IR) spectra were carried out in the mid-IR region of 450–4,000 cm−1 using a PerkinElmer (FTIR 1720-X) spectrometer with 46 scans and 5 cm−1 resolution.
2.6.4 COD and glucose measurementTo measure chemical oxygen demand (COD), samples were obtained from SFPWW before and after experiments, treated with chloride elimination kit LCW925 (Hach Lange) to remove chloride ions, and the COD was measured using an LCK 514 kit (Hach Lange, range 100–2,000 mg O2 L−1) after a 0.5 dilution or an LCI 500 kit (Hach Lange, range 0–150 mg O2 L−1). The COD removal rate (RRCOD) was calculated as shown in the following formula:
RRCOD=1−CODeffluentCODinfluent×100A high-performance liquid chromatography (HPLC) (Thermo Scientific Vanquish, France) instrument equipped with a refractive index detector and an HPX-87H AMINEX column was used for glucose concentration analysis. The mobile phase consisted of 10 mmol of sulfuric acid solution, at a flow rate of 0.6 mL min−1 and maintained at 40°C, with an injection volume of 20 μL (Mouguech et al., 2024).
2.7 Bacterial diversity analysisTotal DNA was extracted from different non-biostimulated and biostimulated sediments, anolytes, and BIO reactors using PureLink Microbiome DNA Purification Kit (Invitrogen), and from bioanodes with a DNeasy Power Biofilm Kit-QIAGEN. The DNA samples’ qualities and concentrations were checked with a microvolume spectrophotometer (FastGene NanoView Photometer) with an absorbance ratio A260nm280nm. Sequencing of the 16S ribosomal RNA (rRNA) gene of the V4–V5 variable region was performed by MR DNA (Shallowater, TX, United States) on a MiSeq platform following the manufacturer’s guidelines. Data sequences were processed using the MR DNA analysis pipeline. The operational taxonomic unit (out) taxonomic classification was achieved by comparing the sequences using the Basic Local Alignment Search Tool for nucleotide sequences (BLASTn) against a curated database derived from the National Center for Biotechnology Information (NCBI).
2.8 Statistical analysisAll experiments were performed in triplicates. The results are presented as mean ± standard deviation (mean ± SD). To determine the statistical significance of the observed differences between experimental groups, statistical analysis was performed with one-way analysis of variance (ANOVA), with a significance threshold set at p < 0.05.
3 Results 3.1 Physicochemical properties of CJSThe chemical composition and physical characteristics of CJS are given in Table 2. Sediment analysis revealed a conductivity value of 74.1 mS cm−1 which is considered high compared to the average seawater conductivity and much higher than that of SFPWW. This elevated conductivity reflects the inoculated sediment’s high salinity, which favors ion flow in the reactor, promoting the extracellular electron transfer from the electroactive biofilm, thus enhancing BES performance. Sediments pH was 7.8 and contained an assortment of ions mainly composed of Ca2+, Mg2+, and K+ with concentrations of 97.8, 32.4, and 71.6 (g kg−1 dry matter (DM)), respectively, that are essential for various cellular function such as promoting the growth or metabolic activities of microorganisms as well as their respiratory activities which can work as electron acceptors.
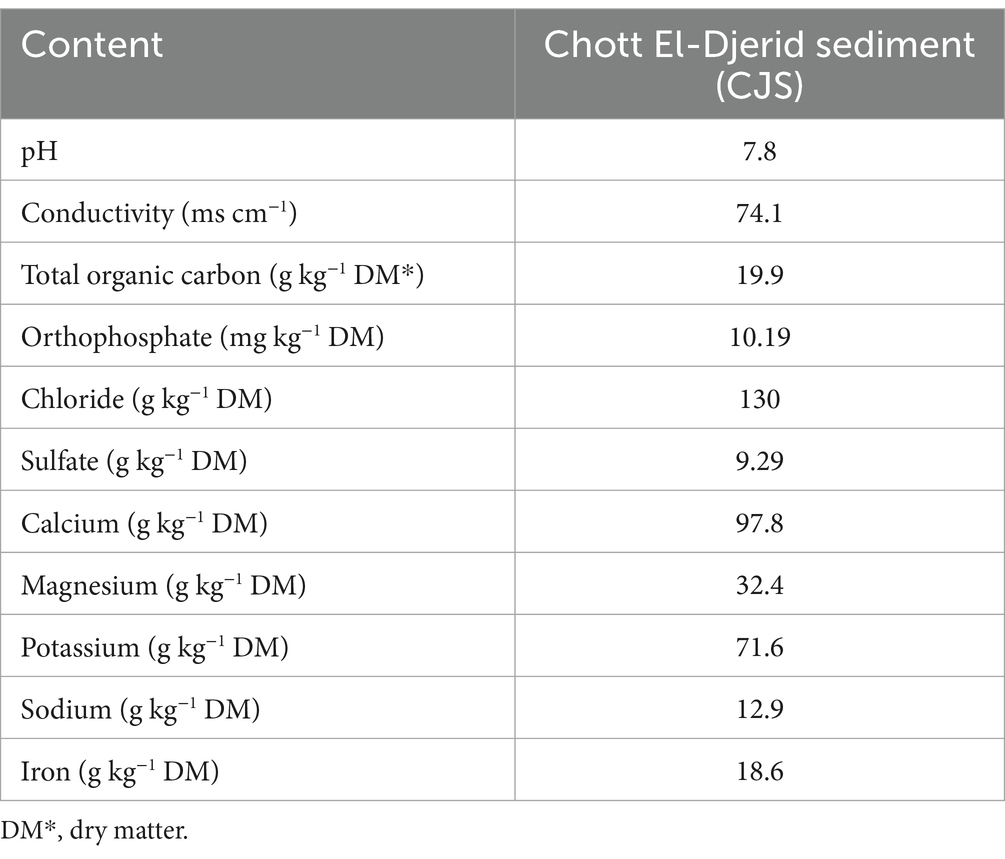
Table 2. Basic physicochemical properties of CJ sediments.
3.2 Electrochemical activity of bioanodesThe non-biostimulated CJS-0 and the biostimulated CJS at different levels of TBZ; CJS-1, CJS-2, and CJS-3, were tested to generate bioanodes in SFPWW. As indicated above, the four sediments were used as inocula to allow biofilm growth on the surface of carbon felt WE. The three replicates of each BES studied simultaneously were under constant polarization of 0.1 V vs. SCE. The current densities recorded for 35 days are displayed in Figure 2. Figure 2A shows the average current density of each BES. Replicates of each experience demonstrate a uniform alignment of the evolution of current densities, indicating consistent experimental conditions (Figures 2B–E). However, slight variations in the current value produced were observed between trials. The maximum currents obtained for BES-0, BES-1, BES-2, and BES-3 were 0.60, 0.39, 3.22, and 2.00 mA m−2, respectively, with standard deviation reflecting some variability in current output (±0.11, ±0.07, ±0.58, and ± 0.17). Maximal current densities, cumulated charges, coulombic efficiencies, and degradation half-life of TBZ, COD, and TBZ removals determined from different experiments are summarized in Table 3. After a few days of WE polarization, all reactors’ oxidation currents began to increase in all reactors, and the maximum current densities between 0.39 and 3.22 mA m−2 were observed in the first 10 days for all BESs. BES-0 has shown an increase in current reaching a sharp peak after 3 days to attend 0.6 mA m−2 corresponding to maximum current density (Figure 2B), followed by a progressive decrease in current production to give a stable value approximately 0.45 mA m−2 and a fall to 0.03 mA m−2 after 25 days. With the first biostimulation, the chronoamperometry curve from BES-1 demonstrates very low current densities. A detailed evaluation of the BES-2 chronoamperometry (Figure 2D) revealed variations in current density. During the first 5 days, the system produced electricity, reaching a maximum current production with a peak of 3.22 mA m−2, which then stabilized, showing a wave with a maximum current of 1.10 ± 0.25 mA m−2 on the ninth day. Following the 20th day, there was a considerable drop in current production, which could be explained by the lower availability of electron donors since glucose had been wholly degraded and TBZ concentration in BES-2 was above 32 ppm. On the third biostimulation, BES-3 (Figure 2E) yielded two peaks of current of different intensities, the second peak reaching 2.00 ± 0.17 mA m−2, resulting in a 3-fold increase over BES-0.
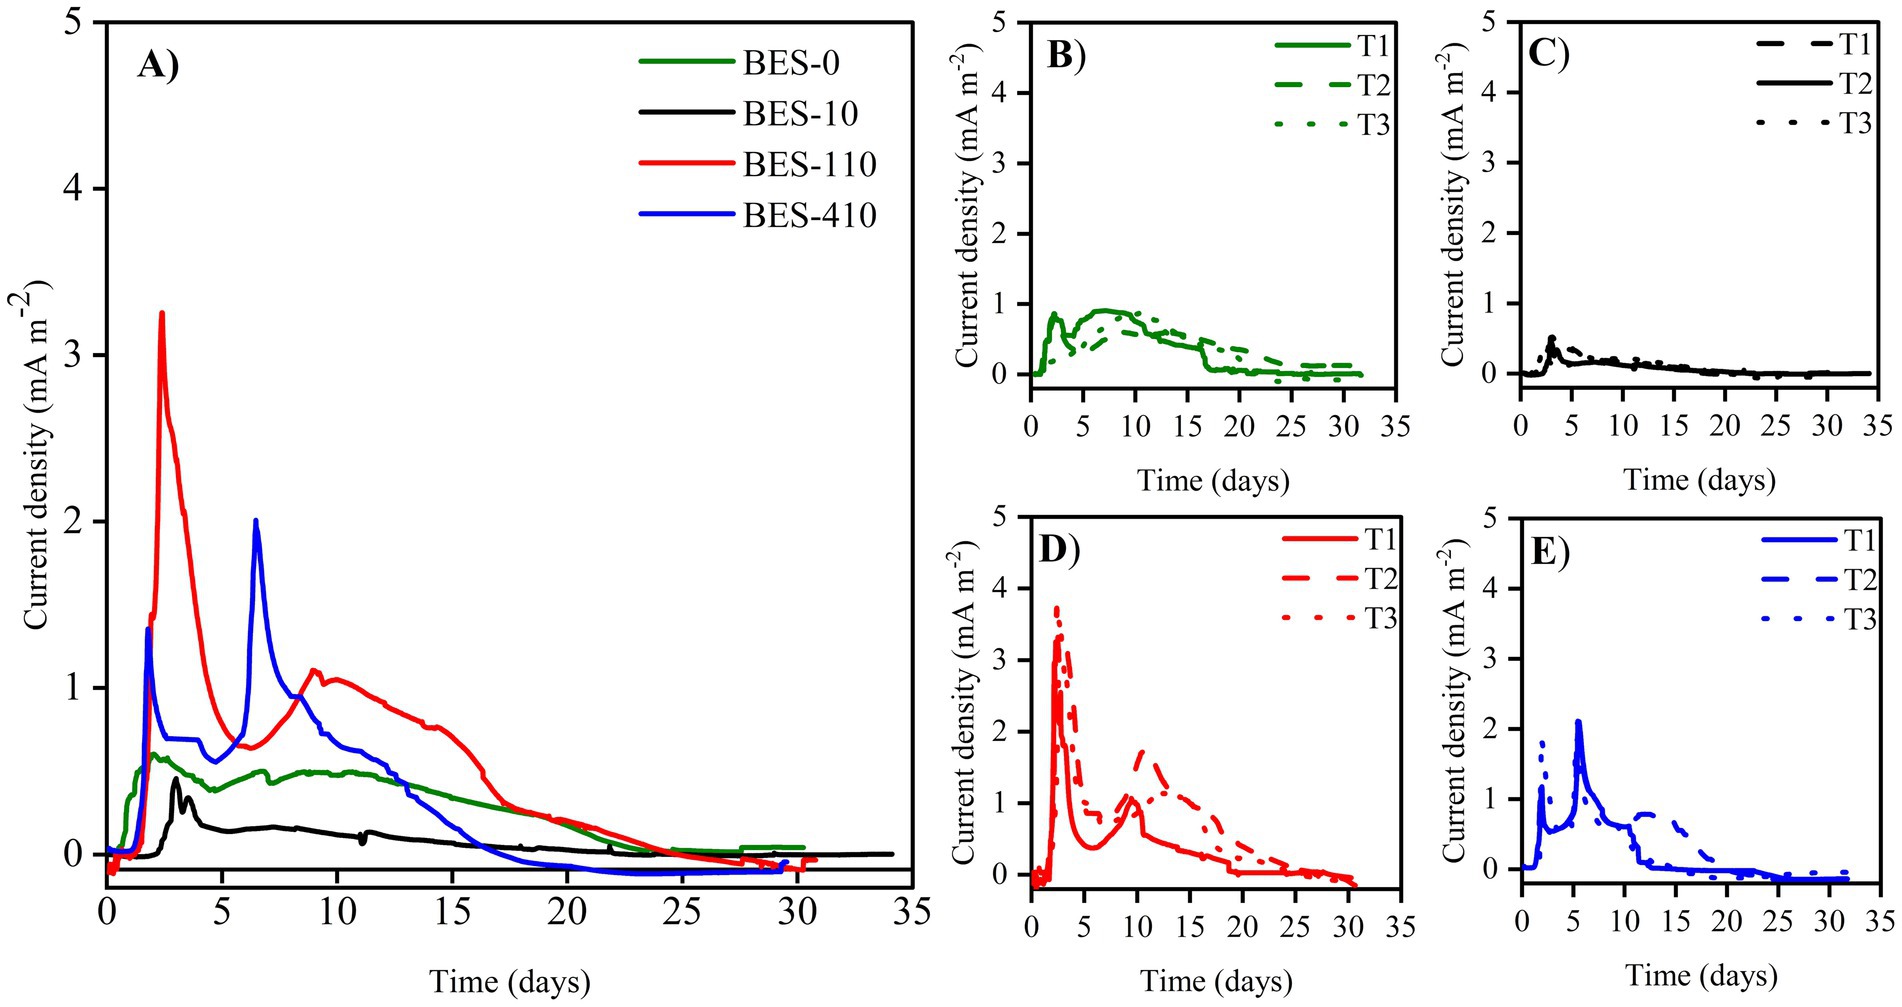
Figure 2. Current densities evolution vs. time of (A) different bioelectrochemical systems colonized with Chott El-Djerid sediment (CJS), (B) BES-0 inoculated with the non-biostimulated CJS-0, (C) BES-1 inoculated with CJS-1, (D) BES-2 inoculated with CJS-2, and (E) BES-3 inoculated with CJS-3, under the constant potential of 0.1 V vs. SCE, fed with 150 and 30 ppm of TBZ and glucose, respectively.

Table 3. Electrochemical and degradation performance of Chott El-Dejrid sediments (CJSs) under different conditions.
3.3 Morphological analysis of anodic biofilmsSEM micrographs and CLSM images of the carbon felt bioanodes recovered from different BESs were analyzed at the end of experiments (Figure 3). Both microscopic images confirmed biofilm development on carbon-felt electrodes. The SEM images showed a few micrometers of thickness biofilms with two different morphologies, the oval-shaped cells—which dominate—and the rod-shaped cells. A closer look (magnification, 15,000×) revealed that the membrane structure of the connected cells on the carbon-felt electrode was surrounded by the biofilm’s extracellular matrix. To characterize the detailed structure of anode surface, CLSM images were captured. 3D images of bioanodes from the four BESs (Figure 3B) illustrated biofilm structure; bacteria labeled with DAPI display blue fluorescence with varying extracellular components, rich in proteins (green fluorescence) and polysaccharides (red fluorescence). BES-0 bioanode structure (Figure 3B) appears the exact amounts of proteins and polysaccharides with a lower density of biofilm. Regarding BES-1 and BES-2 (Figure 3B), bioanodes demonstrated a dense and regular biofilm constructed with two layers, the first corresponding to polysaccharides located close to the adherent bacteria and the second layer with a larger volume of proteins. However, after the final biostimulation stage, that is, BES-3 (Figure 3), a noticeable change in the structure of the biofilm was observed, which now consisted mainly of polysaccharides, indicating a shift toward a more carbohydrate-rich composition.
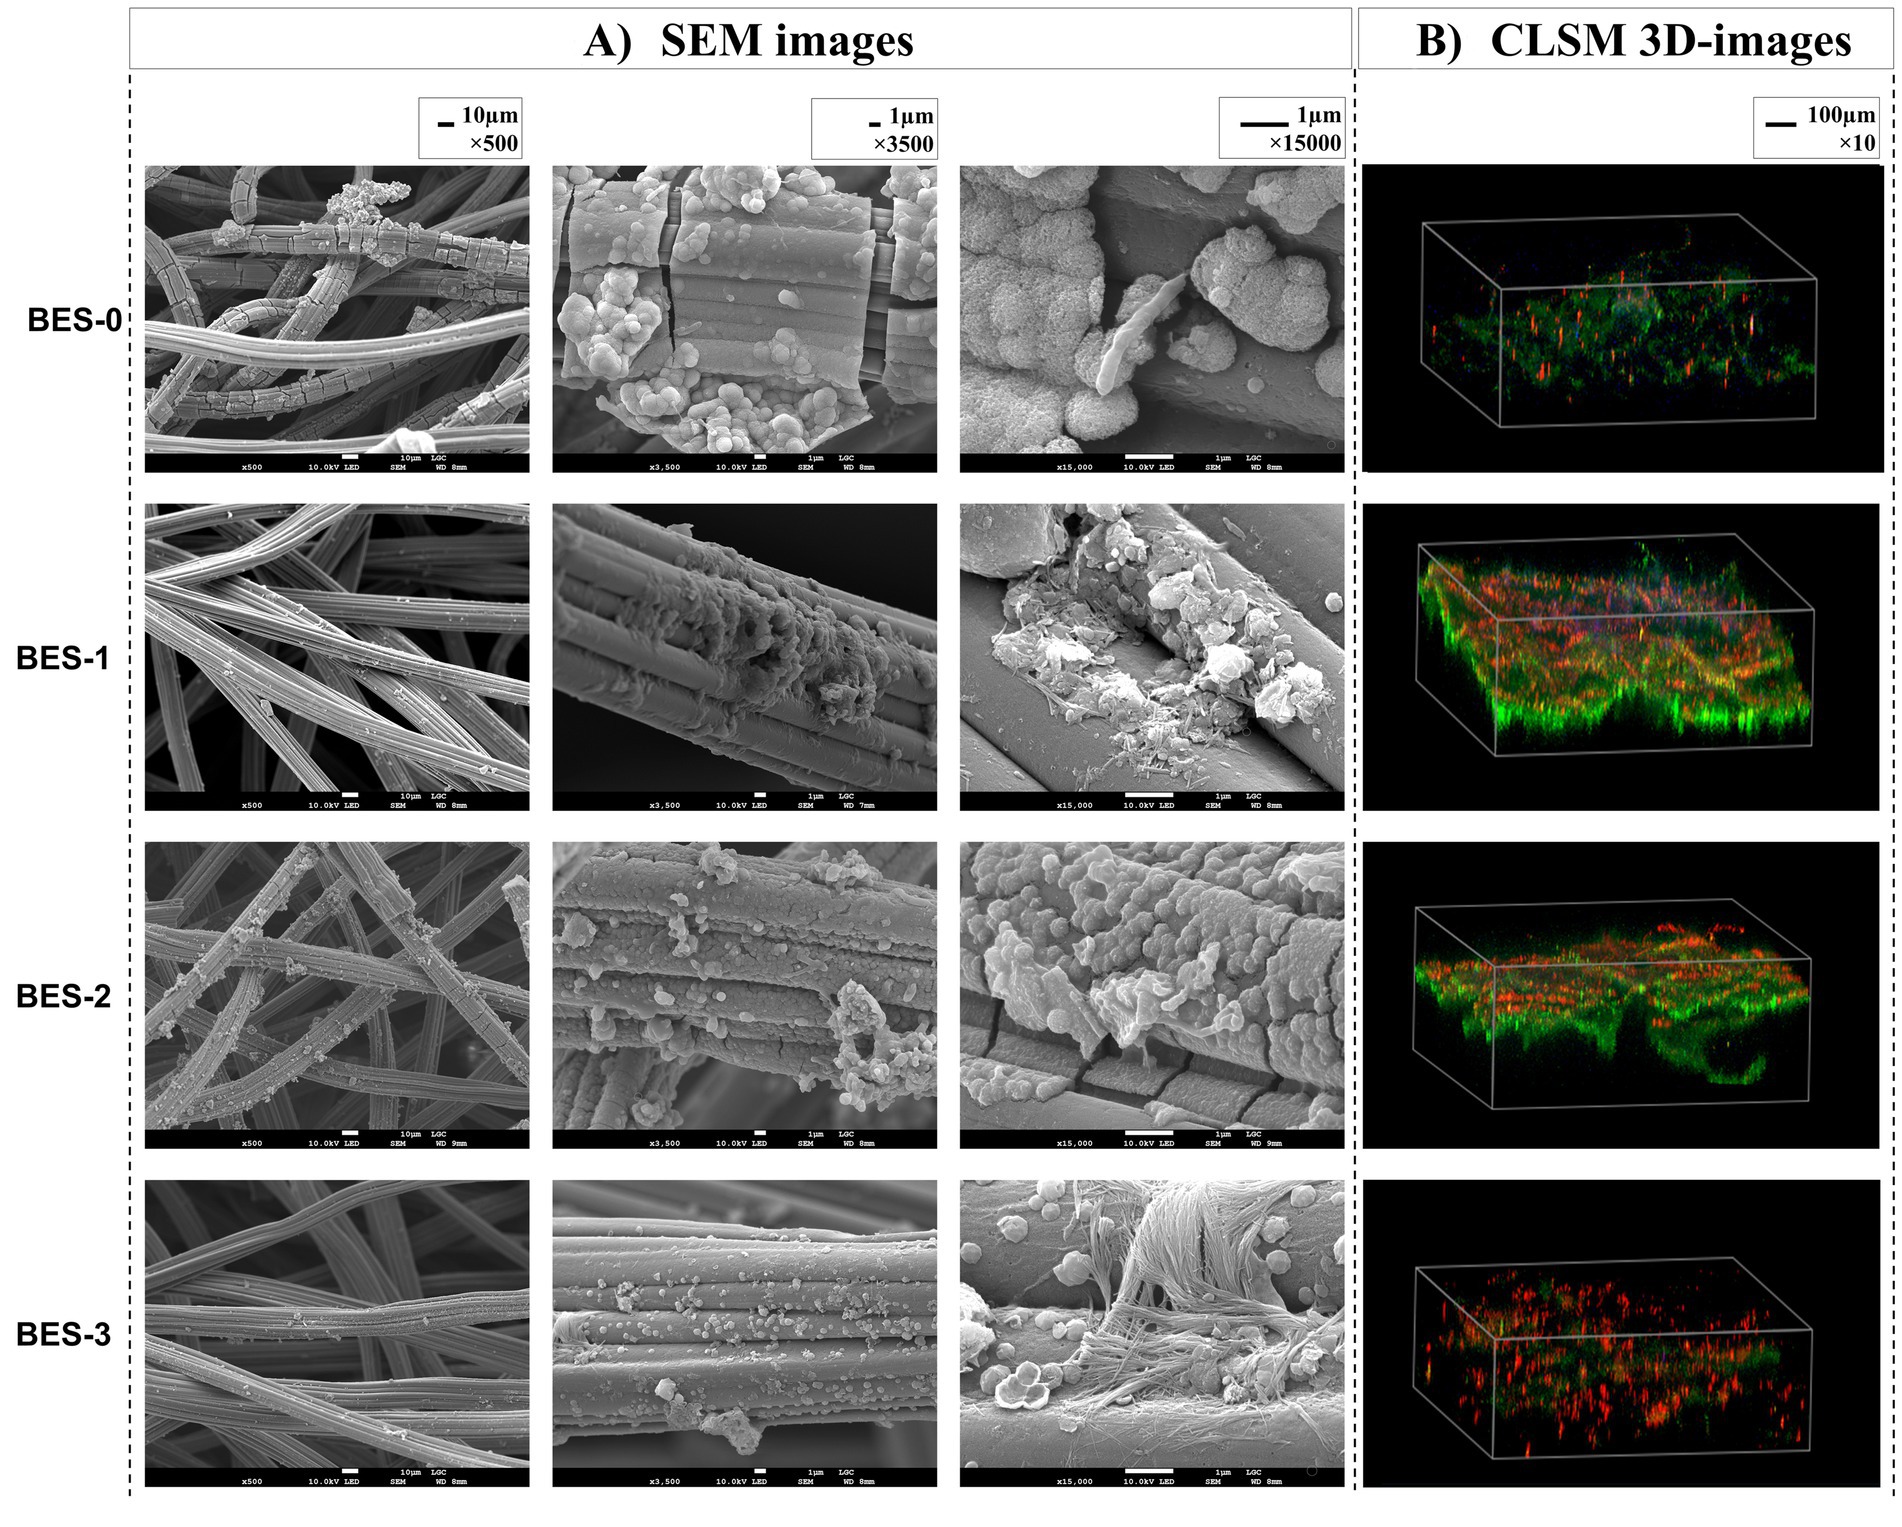
Figure 3. SEM images (A) and CLSM 3D images (B) of carbon felt bioanodes formed in the different BES.
3.4 Glucose and TBZ degradation rateThe initial glucose concentration (30 ppm) added to each BES and biological reactor was completely degraded after 4 days of carbon-felt WE polarization. HPLC analysis (data not shown) revealed a trace of glucose (<0.5 ppm) on days 2 and 3, and no trace from day 4 onward.
To evaluate the impact of biostimulation and BES treatment on TBZ degradation, the dynamics of TBZ concentration changes were assessed. Figure 4 displays the TBZ removal rate over time in each of the BES and BIO reactors. In addition to the concentration added to the reactors (150 ppm of TBZ), a remaining quantity of TBZ used in CJS pretreatment was present in the reactors. As a consequence, the initial concentration in each reactor was 150 ppm in BES-0 and BIO-0, 150.20 ppm in BES-1 and BIO-1, 153.20 ppm in BES-2 and BIO-2, and 156.60 ppm in BES-3 and BIO-3 (Table 2). Gas chromatography was utilized to verify the UV–Vis data, which revealed the same degradation rate and confirmed the elimination of TBZ in all reactors. From day 5, TBZ concentration was surveyed, showing degradation rates of 3, 16, 13, 16, 41, 47, 29, and 39% in BIO-0, BES-0, BIO-1, BES-1, BIO-2, BES-2, BIO-3, and BES-3, respectively, (Figure 4). BES reactors consistently exhibited greater degradation efficiency compared to BIO reactors. In BES-0, we achieved a TBZ degradation rate approximately 5 times greater than in the BIO-0 compared to BIO-0 after day 5 without using biostimulation pretreatment for CJS. After biostimulation of the CJS, BES, and BIO reactors showed an increased TBZ degradation efficiency in a shorter time. This could be explained by the emergence of a microbial community tolerant to degrade TBZ more efficiently. BES and BIO reactors inoculated with biostimulated sediments had degraded by above 50% within the first 12 days of experiments, proving the effectiveness of biostimulation in enhancing TBZ removal following the third series of biostimulation. Nevertheless, we noticed a significant reduction in TBZ removal rate after 22 days in the reactors inoculated with biostimulated CJS. TBZ concentrations were much lower (less than 20%) at this stage, resulting in slower transport processes. Consequently, its availability in the reactors could become a limiting factor.
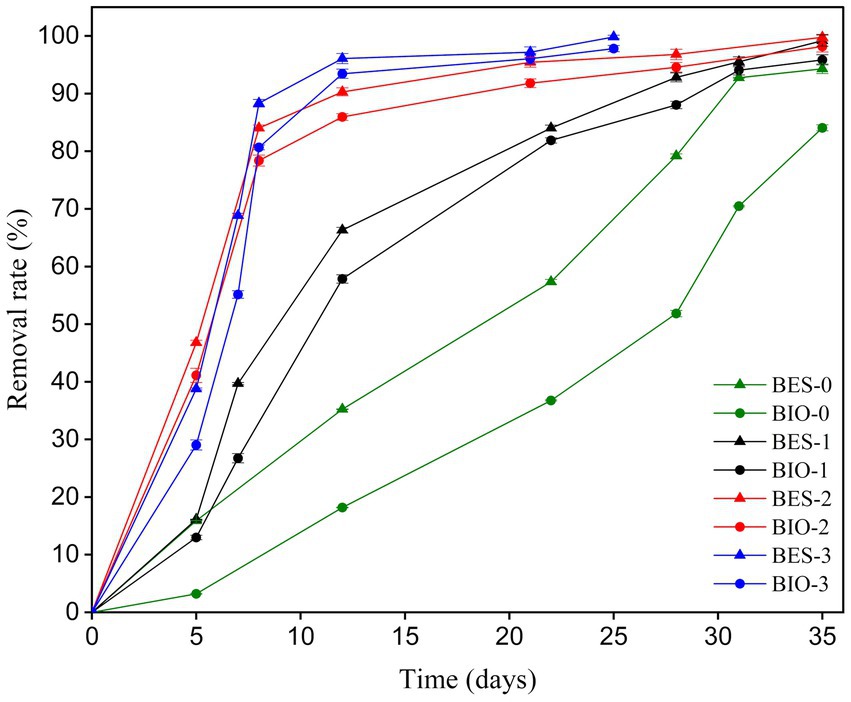
Figure 4. TBZ removal rate profiles, determined by GC-FID analysis in all BES and BIO reactors.
3.5 TBZ structure modification in BESFTIR was used to investigate the functional groups of the degraded TBZ after the BES experiment all along with the undegraded fungicide (Figure 5). The FTIR examination of TBZ revealed distinct peaks for aromatic rings (C=C), aliphatic group (-CH3), and functional groups (-NH, -CS, and C=N) illustrated from 2,900 to 450 cm−1. The band observed at 779 cm−1 corresponding to the stretching vibration of the thioether group (-S-) attached to the thiazole ring of TBZ had disappeared after the BES treatment experiment in all reactors. FTIR spectrum also indicates a decrease in peak intensities of the two bands observed at 950 and 1,009 cm−1 assigned to C-C stretching vibrations and CH bending vibrations in the benzene ring, respectively. This finding supports the cleavage of TBZ bonds during the experiments. The region from 1,050 to 1,540 cm−1 represented in the undegraded TBZ spectra results from C-N stretching of the imidazole ring, benzene ring breathing, and weaker contribution from the asymmetric C-C stretching vibrations of the imidazole-thiazole bond and the benzene ring appeared decreased in the degraded TBZ spectra related to TBZ transformation in the reactors. In addition, peaks spanned in the range of 1,600 and 1740 cm−1 that define the interaction vibrations in the imidazole ring containing two nitrogen atoms were not the same before and after TBZ degradation experiments. Moreover, the peak at 1640 cm−1 became broader after BES experiments. The generation of intermediate metabolites could explain this. Furthermore, serval bands detected in the region between 2,850 and 2,990 cm−1 characterize tertiary amines that disappeared following BES experiments and gave the appearance of a single peak at 2,981 cm−1, confirming the breakdown of the molecule. Overall, FTIR spectra provide significant variations in the functional groups following TBZ degradation experiments and support chemical changes in the molecule either by the formation or by the disappearance of specific chemical bonds.
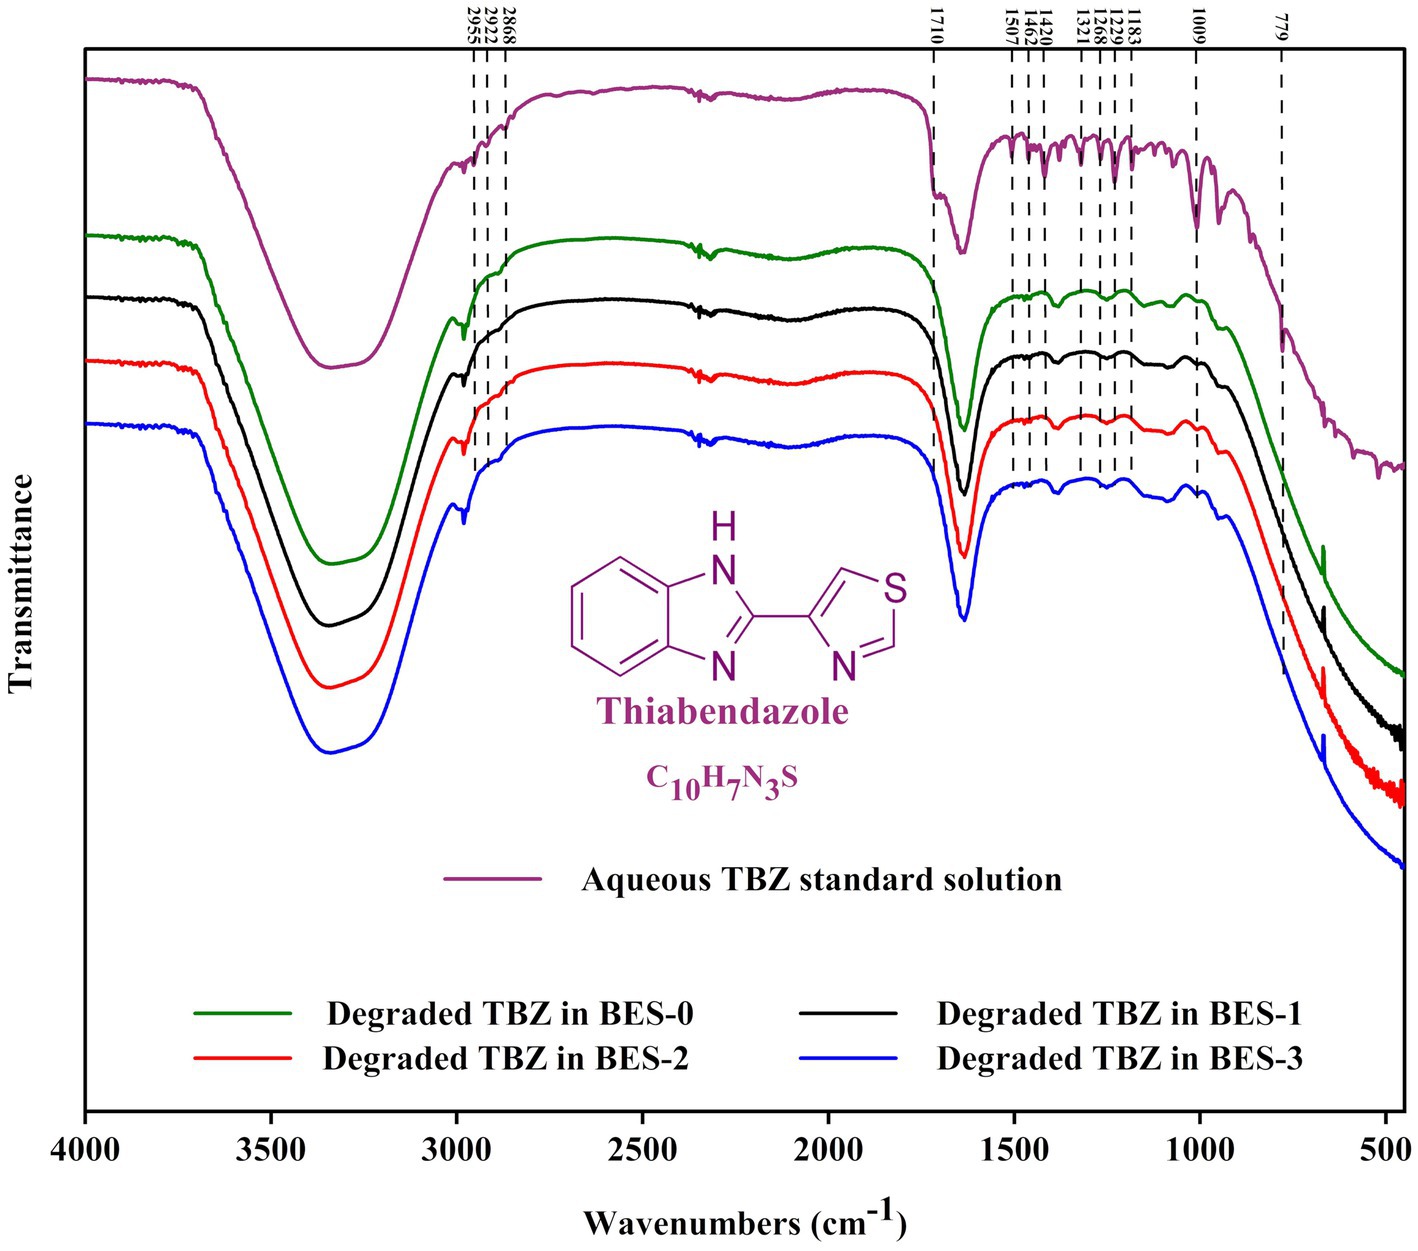
Figure 5. Fourier transform infrared (FTIR) spectrum of undegraded TBZ and degraded TBZ in the bioelectrochemical experiments using different CJS inocula.
3.6 Comparison of the bacterial communities from CJS, bioanodes, anolytes, and BIOThe analysis of the bacterial taxonomy that shows the composition and richness of the bacterial community obtained from: sediments (CJS-0, CJS-1, CJS-2, and CJS-3), bioanodes (BA-0, BA-1, BA-2, and BA-3), anolytes (AN-0, AN-1, AN-2, and AN-3), and biocontroles reactors (BIO-0, BIO-1, BIO-2, and BIO-3) are represented in Figures 6, 7. The bacterial phyla including Acidobacteria (1.64–2.45%), Actinobacteria (1.55–9.51%), Actinomycetota (1.50–22.37%), Bacillota (also known as Firmicutes) (3.73–99.72%), Bacteroidetes (0.65–18.27%), Euryarchaeota (0.83–55.04%), Planctomycetes (3.96%), Proteobacteria (0.55–92.28%), and Pseudomonadota (5.84–41%). Only phyla with a relative abundance above 2% in at least one sample are represented (Figure 6A). Bacillota and Proteobacteria account for more than 80% of the leading nine major bacterial phyla detected in the BES samples (bioanodes and anolytes). However, Proteobacteria constitutes a minority in BIO, with a relative abundance of less than 7%, whereas Bacillota predominates with a relative abundance of more than 50%. In the BIO samples, the Pseudomonadota and Actinomycetota phyla are only found in the biosamples. However, proteobacteria are in a minority in the BIO sample, with a relative abundance of less than 7%, whereas Bacillota predominates with a relative abundance of more than 50%. In the BIO samples, the Pseudomonadota and Actinomycetota phyla are only found in the biosamples. Sequences belonging to Euryarchaeota were detected in CJS-2 (55%) but only observed in AN-2 and AN-3, with a percentage < 2%. Sequences related to Bacteroidetes observed in all CJS, were found in anolytes (AN-1, AN-2, and AN-3) and BIO (BIO-0, BIO-2, and BIO-3).
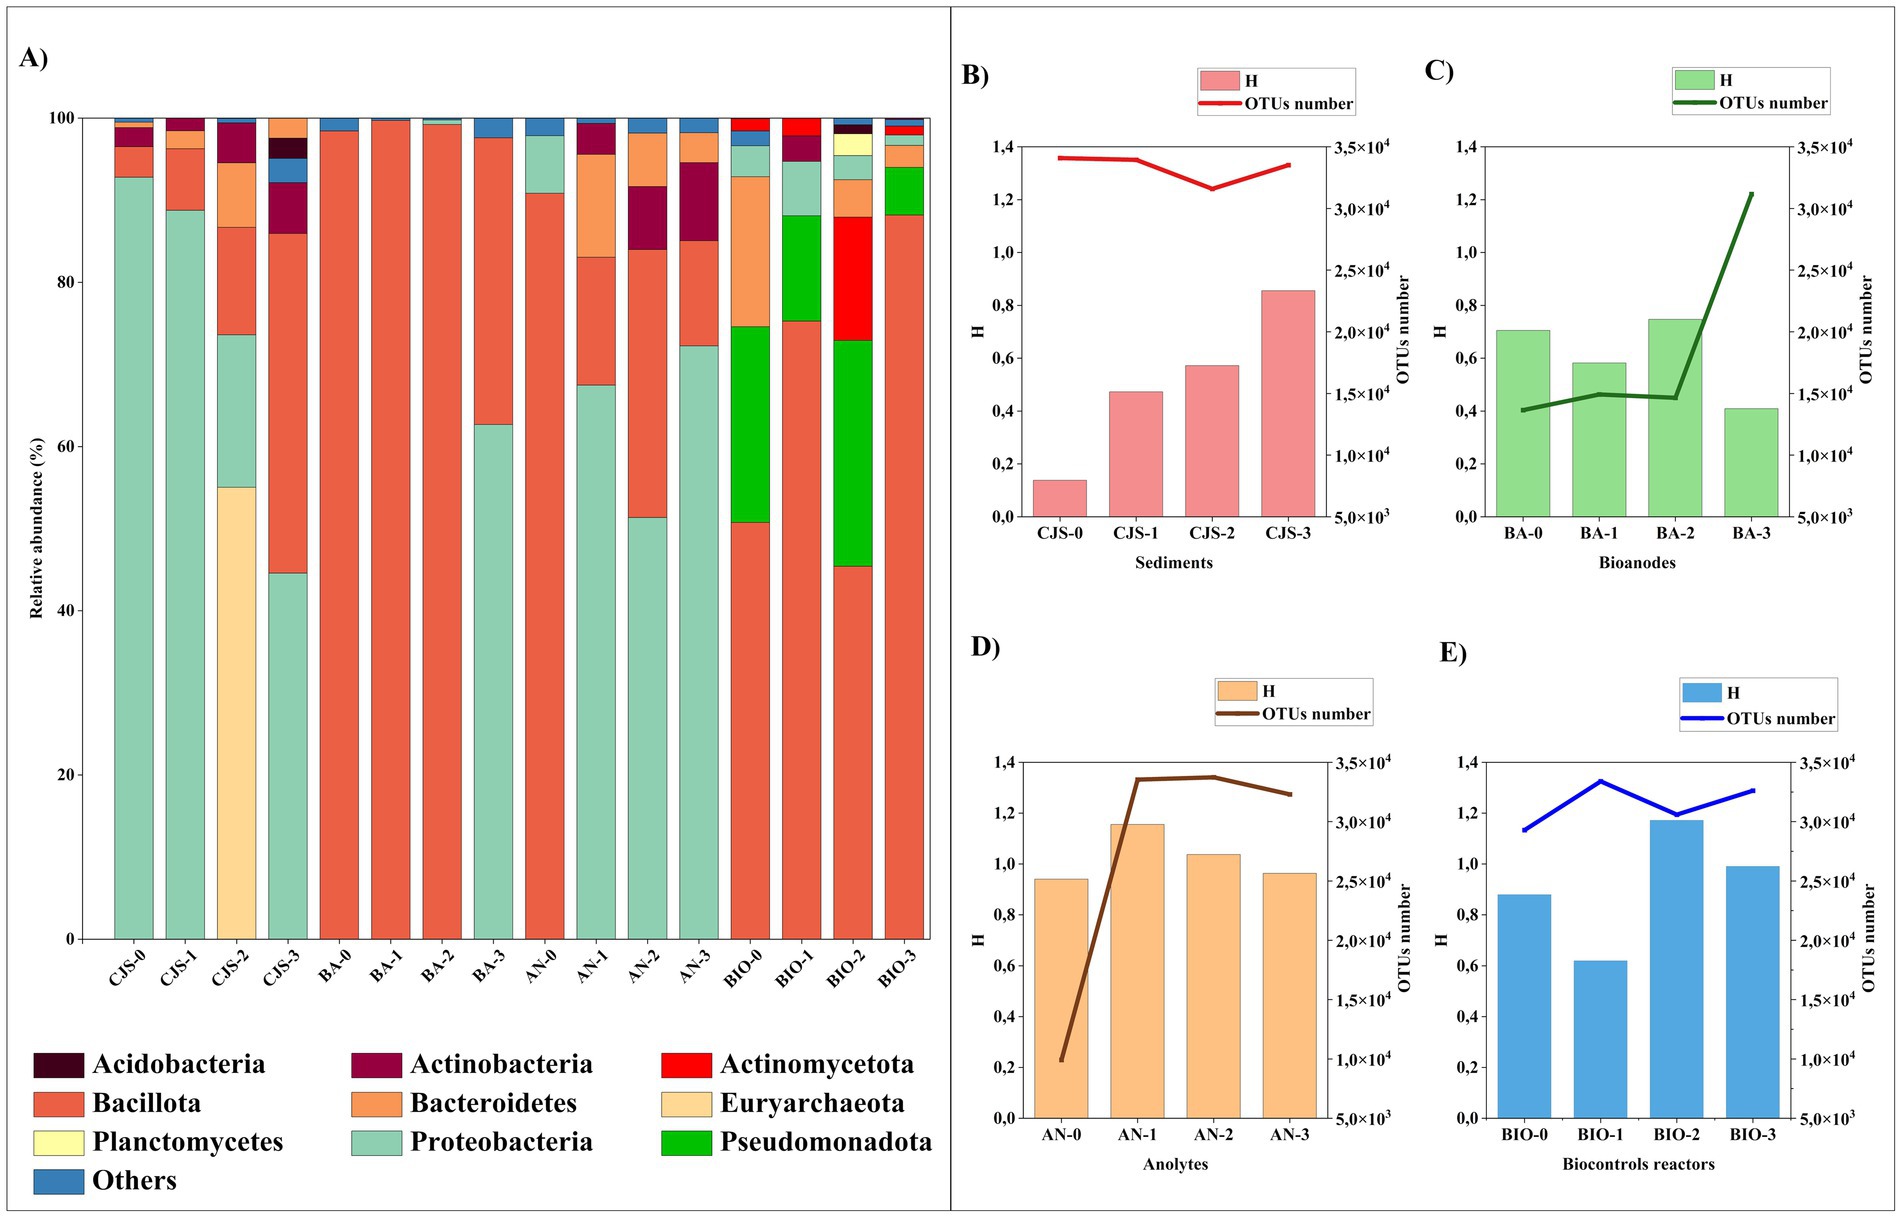
Figure 6. Microbial distribution at (A) phylum level of all samples that represented >2% in at least one sample, diversity index of microbial community Shannon (H) and the total number of OTUs for; (B) sediments (CJS-0, CJS-1, CJS-2, and CJS-3); (C) Bioanodes (BA-0, BA-1, BA-2, and BA-3); (D) Anolytes (AN-0, AN-1, AN-2, and AN-3) and (E) biocontroles (BIO-0, BIO-1, BIO-2, and BIO-3).
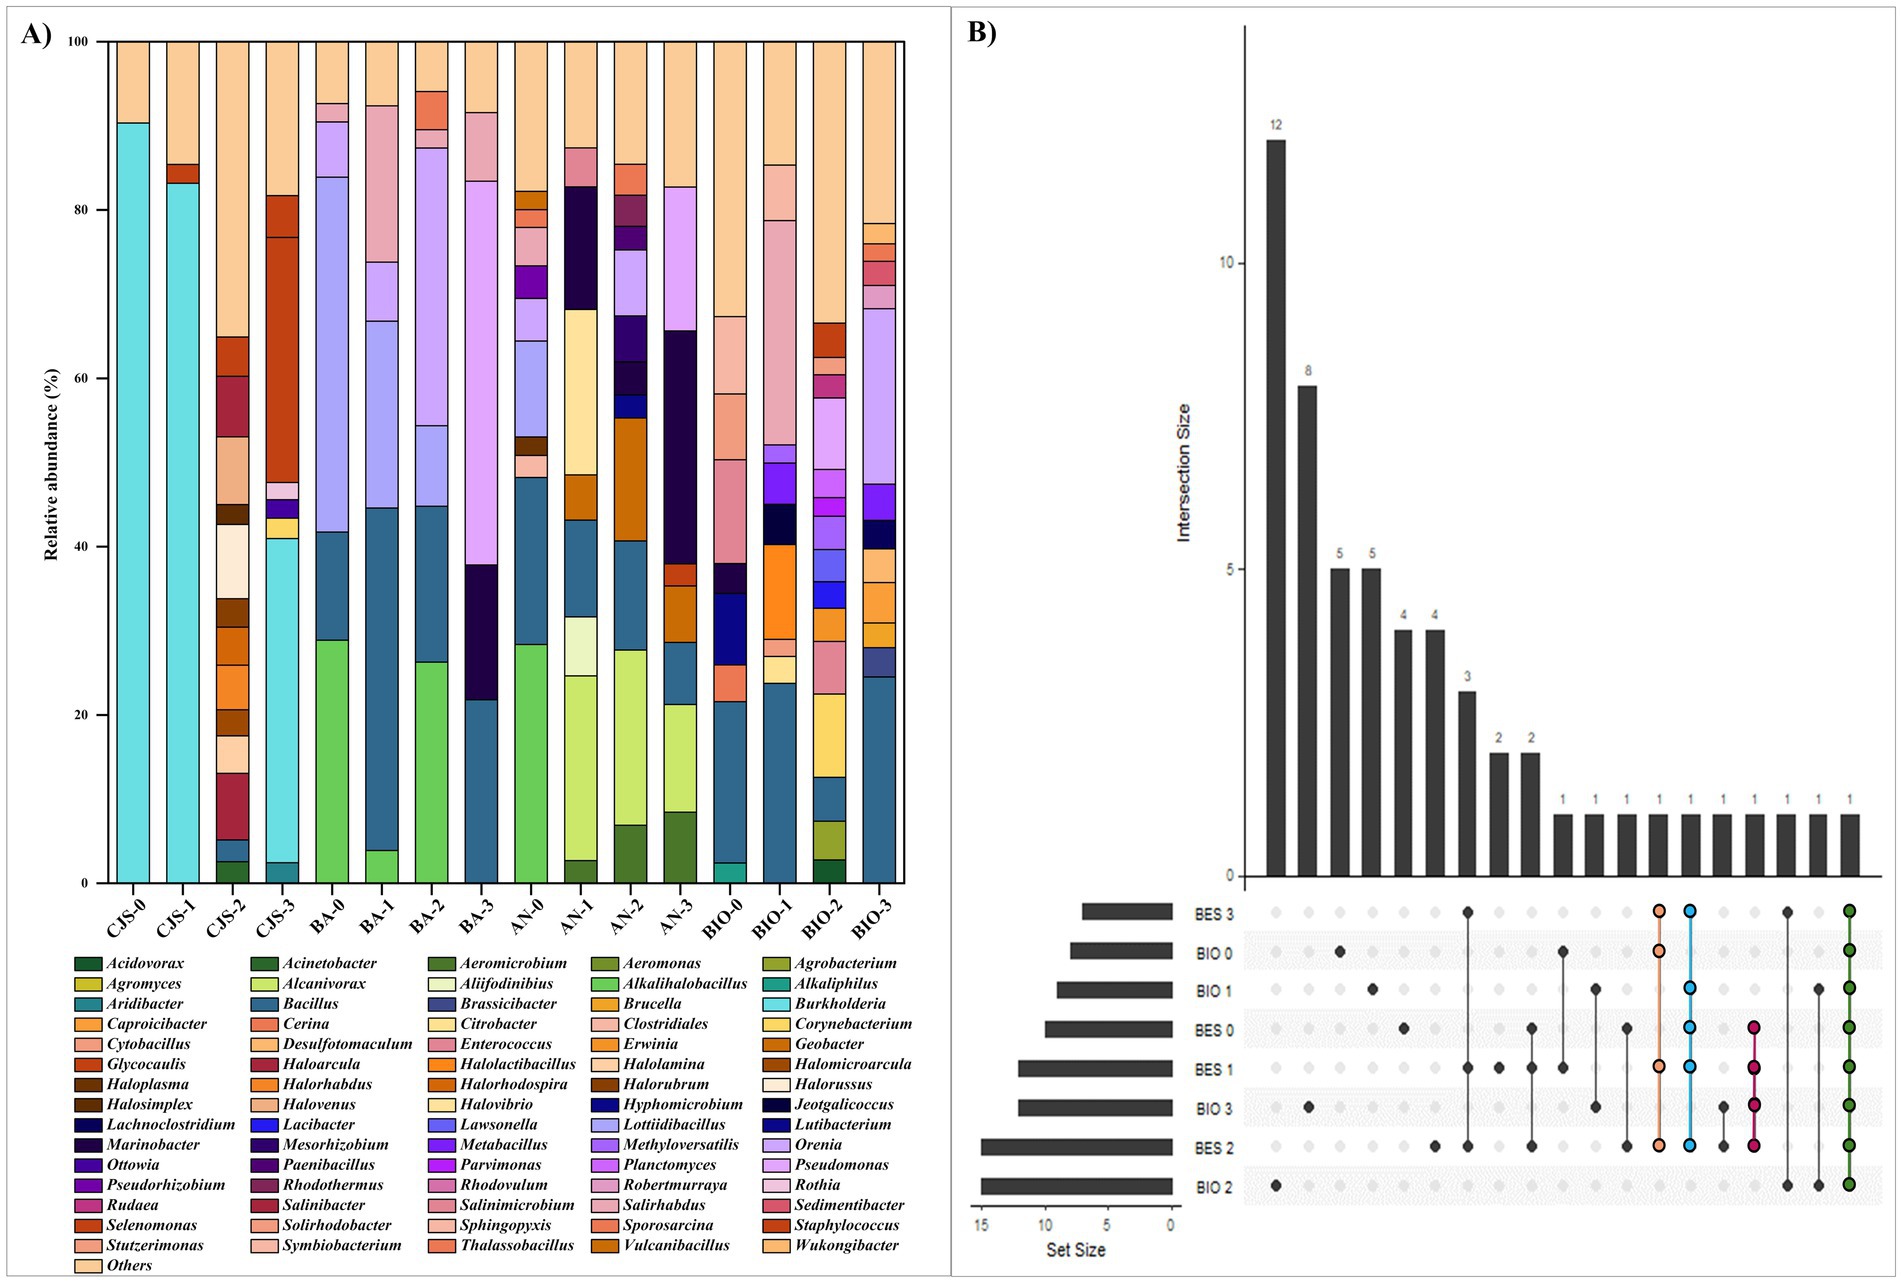
Figure 7. (A) Relative abundance of the main bacterial genus (those are more than 2%) and (B) UpSet plot illustrating the number of shared genera in all reactors.
A genera-level analysis indicated a total of 381 diverse genera, with only genera having a relative abundance greater than 2%, as shown in Figure 7A. Bacterial genera included Alkalihalobacillus (3.89–28.89%) Bacillus (2.54–40.70%), Lottiidibacillus (9.58–42.16%), Orenia (5.07–32.98%), Salirhabdus (2.17–26.64%), Thalassobacillus (2.10–4.54%), Pseudomonas (8.50–45.60%), Marinobacter (3.24–24.54%), Salinimicrobium (3.79–12.32%), Staphylococcus (2.23–4.97%), and Sporosarcina (2.08–3.05%). Biostimulation with increasing doses of TBZ induced changes in the sediment microbial community, as shown in Figure 6B. Community richness [Shannon index (H)] increased from 0.13 for CJS-0 to 0.85 for CJS-3, while the number of OTUs remained stable. This indicates that species richness does not change, but the distribution of abundance becomes more balanced. In addition, a reduction in the dominance of the main population in CJS-0 and an increase in the equity between the present genus was observed in the relative abundance of the bacterial genus in CJS-3 (Figure 7A). The abundance of Burkholderia sp. decreased from 90% in CJS-0 to 7.75% in CJS-2, giving rise to enrichment populations specific to TBZ degradation, consisting of the following phyla: Bacteroidetes, Euryarchaeota, and Bacillota. The number of OTUs in bioanodes BA-0, BA-1, BA-2, and BA-3 are 0.70, 0.58, 0.74, and 0.40, respectively (Figure 6C), and in anolytes are 0.94, 1.15, 1.03, and 0.96, respectively (Figure 6D). There is constantly fluctuating despite a constant increase in the number of OTUs in BES samples (bioanodes and anolytes), which means that even with the appearance of new species, the distribution of abundances becomes unbalanced due to the dominance of some species while others remain uncommon. Figure 7A, confirming the decrease in Alkalihalobacillus abundance from 28% in BA-0 and AN-0 to a total absence in BA-3 and AN-0, gives the appearance of different types of bacteria that did not affect the OTUs number in those groups. The response of BIO to biostimulation (Figure 6E) is similar to the BES response. However, when the Shannon index decreases, the number of OTUs increases. It means that, while there are more genera, their relative abundance is highly unequal, with a few taxa dominating the rest. BES and BIO reactors were compared in the form of an UpSet plot to illustrate the shared genera in all reactors (Figure 7B). The core analysis revealed that the only core genera in all reactors were Bacillus (green dots). Out of these, Marinobacter and Salirhabdus were identified in 4 and Orenia in three different reactors. 4, 2, 4, 5, 5, 12, and 8 genera were presented exclusively in BES-0, BES-1, BES-2, BIO-0, BIO-1, BIO-2, and BIO-3 reactors, respectively. Moreover, BES-3 shares at least one genus with the other BES and BIO reactors which were composed of Aeromicrobium, Alcanivorax, Bacillus, Geobacter, Glycocaulis, Marinobacter, Pseudomonas, and Salirhabdus.
4 DiscussionIn this study, we first examined the characteristics of CJS, recognizing the importance of the inoculum source for BES performance. CJS conductivity was 74.1 mS cm−1, which is higher than the average seawater conductivity of 50 mS cm−1 (Ashokan et al., 2023) and notably larger than that of FPWW (2.9 ± 0.3 mS cm−1) (Rodrigues et al., 2022). The pH of CJS was 7.8, and in the reactors, the final pH stabilized at 7.0 ± 0.1 closely resembles that of real FPWW, which can reduce the adaptation period for the inoculum when transferred to actual FPWW, promoting optimal microbial function without the need for additional condition adjustments. Moreover, the chemical analysis of the sediments, focusing on the nutrient profile, including organic carbon, phosphates, and minerals, demonstrates the richness of CJS. This may enhance microbial growth, leading to improved performance in BES.
4.1 Impact of TBZ concentration and glucose on current production and TBZ removal efficiencyAs far as the measurement of current density using the same sediments sampling site (Chott El Dejrid), bioanodes generated with BES-0 had less success than those obtained in our prior research (Saidi et al., 2022). Indeed, the highest current densities recorded for bioanodes in this study were below 1 mA m−2 (BES-0) when a concentration of 150 ppm of TBZ was present, along with 30 ppm of glucose as co-substrate. In contrast, using 50 ppm of TBZ without adding the co-substrate, bioanodes in our previous study generated 3.66 mA m−2. However, after 7 days of polarization, the TBZ removal rate in BES-0 was less than 25%, corresponding to 37.50 ppm (Figure 6B). This is close to the concentration of TBZ degraded in 7 days in our earlier study, where there was a decrease of over 80% in TBZ concentration corresponding to 40 ppm. These discrepancies observed between these two experiments could be explained by the nature of carbon sources. Glucose is quickly consumed by microorganisms, and its presence may impact the microbial community dynamics. Due to its fermentable nature, glucose can be converted into volatile fatty acids, which are then utilized by microbes (Guo et al., 2022). This fermentation process leads to changes in bacterial metabolism, prompting glucose consumption and utilizing electrons produced to degrade TBZ while downregulating other enzymes responsible for directly consuming TBZ. Furthermore, Guo et al. (2022), identified that Acetobacterium was enriched on the electrode surface only in the presence of glucose. Although this bacterium was not involved in azo dye reduction, it is recognized as an acetogenic microbe capable of producing acetate through glucose oxidation. This highlights the differing impacts of using two distinct substrates as electron donors. While we achieved our primary goal of TBZ degradation, we could not increase current densities by adding a co-substrate. Nevertheless, the noticeable decrease in the current production can be related to the elevated concentrations of TBZ. It could inhibit the microbial activity to electron transfer, resulting in a lower current density. Shahi et al. (2020) observed a similar phenomenon while degrading a recalcitrant molecule, the Reactive Orange 16 Dye. They reported that at high dye concentrations, current production was inhibited, and COD removal decreased in the microbial fuel cell (MFC) once the dye concentration reached 500 ppm. More recently, a study carried out by Saadaoui et al. (2023b) showed that the BES performance was reduced as the dye concentration was increased for two different dyes used. These outcomes align with our results, where we successfully degraded TBZ at an initial concentration of 50 ppm (in our previous study). In the current study, certain microorganisms could be selectively inhibited while increasing the TBZ concentration in the reactor (150 ppm). This, in turn, can negatively impact BES performance and reduce the overall effectiveness of microbial activity leading to a decrease in current production.
4.2 Biostimulation effectsA significant change in current production occurs after the first 15 days of biostimulation in the presence of 10 mg of TBZ per kg of sediment. The current maximum output declined to 0.4 mA m−2, raising concerns about the impact of biostimulation on cell performance. Biostimulation may alter the microbial community’s composition and diversity, potentially favoring the proliferation of competing microorganisms that lack the metabolic capacity to contribute effectively to the current generation. This was demonstrated by an increase in the relative abundance of Aeromicrobium genera and the appearance of Glycocaulis genera in AN-3 (Figure 7A). Both of these are aerobic microbes known for their ability to degrade aromatic compounds, including mycotoxins (Hu et al., 2023) and hydrocarbons (Chen et al., 2024). However, they have not been identified as electroactive bacteria. After the initial biostimulation with a higher TBZ dose and using CJS-2 as inoculum, a notable drop in current production was noticed, followed by increased current densities (Figure 2D). The electrocatalytic improvement from BES-0 to BES-2 corresponded to an amplification factor of three, reaching a maximum current density of 3.22 ± 0.58 mA·m−2. Considering the boost in intensity observed using inoculum from the second biostimulation sediment (CJS-2), we can note that microorganisms require time to acclimate to the unexpected stimuli provided while undergoing physiological changes to adapt to the new environment. This biostimulation period enables microorganisms to increase their enzymatic activity for TBZ degradation by genetic recombination and natural selection to favor species that contribute to forming a microbial community capable of breaking down TBZ (Wani et al., 2022). After the third stage of biostimulation, BES-3 produced three peaks of current with different intensities, achieving a peak with a maximum current density of 2.00 ± 0.17 mA m−2, which was twice the amplification seen in BES-0. Even though the BES-3 output with CJS-3 as the inoculum was higher than the non-biostimulated sediment CJ-0, it remained lower than the CJS-2 biostimulation. This might be attributed to the reduced ability of microorganisms to produce current due to the changes in the microbial community structure, including shifts in the proportions and diversity of existing microorganisms after the third biostimulation cycle, potentially favoring species that cannot produce current. Alternatively, some modifications in the metabolic activities of the microbial consortium to resist the fungicide could impact their ability to generate current.
4.3 Metabolic shift and its influence on electron transfer and TBZ degradationElectroactive bacteria can adapt their metabolic pathways based on environmental conditions. Facing the high concentrations of TBZ, these microorganisms could shift their metabolism from electrogenic processes to fermentative metabolism. This shift leads to a decrease in electron transfer activity and an increase in energy consumption, as the bacteria boost their metabolic activity for TBZ degradation and to combat the excessive and toxic concentrations of TBZ. Consequently, the balance of NADH/NAD+ changes throughout this metabolic shift, which can significantly affect the bacteria’s ability to use organic compounds as the final electron acceptors (Moscoviz et al., 2016). In addition, an increase in the redox couple NADH/NAD+ helps to promote fermentation. Although this alteration may reduce the overall efficiency of BES for energy generation, allows bacteria to resist excessive TBZ concentrations. Therefore, it is essential to clarify these metabolic dynamics to optimize BES and enhance the productivity of the microbial communities dedicated to TBZ degradation. Despite the variation in current production from different BESs using biostimulated CJS, the improvement in TBZ degradation is quite remarkable, 39.68, 84.03, and 88.33% for BES-1, BES-2, and BES-3, respectively, after 7 days of polarization. This increased rate of TBZ degradation could be explained by the enrichment of BES with multiple bacteria, including fermentative bacteria, which do not adhere to the anodes and consume TBZ in the anolyte. Also, it may be possible that these types of bacteria utilize the electrons produced by electrogenic bacteria from glucose metabolism to facilitate the fungicide degradation. In addition, a total degradation of glucose was observed within 4 days in all reactors, which could theoretically give 308°C. However, the accumulated charge in all BESs ranged from 0.88 to 5.69\u00B0C, which is lower than the expected value based on glucose molecules. Such results could be due to the lack of effective transfer of electrons in BES or the deviation of produced electrons to other biochemical processes, that electron-receiving bacteria could use for the reduction of TBZ. Microorganisms may use glucose for alternative metabolic pathways, such as fermentation or anaerobic respiration, reducing the number of electrons available for electricity generation at the BES anode. This interaction among the microbial community, specifically between electrogenic and electrotrophic bacteria, allows synergistic interplay via extracellular electron transfer, to enhance the degradation of pollutants. Song et al. (2019) used BES inoculated with industrial sludge to degrade p-chloronitrobenzene and enhanced the degradation process through a bioaugmentation approach. They added Pseudomonas sp. as a biocatalyst, which allowed them to improve pollutant removal to 100%. This demonstrates that the degradation efficiency of pollutants can be enhanced via by introducing specific microorganisms. Hence, the involvement of exoelectrogenic bacteria is crucial, as they act as electron donors, facilitating the biodegradation process. This demonstrates that introducing specific microorganisms can enhance the degradation efficiency of pollutants. It is crucial to note that CJSs have demonstrated their potential performance in BES to design efficient bioanodes from various substrates (Askri et al., 2019, 2020; Saadaoui et al., 2023a, 2023b). While current production depended is on the substrate nature, effective removal of the pollutant was achieved (Saidi et al., 2022). These outcomes point out that CJS may be a valuable asset for developing effective, ecofriendly pollutant removal methods using BES.
Biofilms formed on the WE electrodes’ surface are characterized by an amorphous structure that corresponding to an enveloping matrix consisting mostly of extracellular polymeric substances and proteins released by microorganisms to promote their adhesion to the material’s surfaces. Such structures are associated with the mechanisms of electron transfer in energy-producing processes in BES (Agudelo-Escobar et al., 2022). However, a sparse biofilm structure was observed where the microbial adhesion occurred only between the fibers of carbon felt, suggesting a few numbers of bacteria adhered on the anode. This weak attachment could contribute to a lower electron transfer to the working electrode surface (Zhang et al., 2019), leading to the obtained low current production in chronoamperometry’s results discussed above. Furthermore, the small current amount generated with electroactive biofilms could be related to the elevated resistance to charge transfer occurring at the anode,
留言 (0)