High-intensity interval training (HIIT) has been studied extensively for its effects on endurance performance and the physiology of healthy adult individuals. There have been sufficient studies to warrant six meta-analyses showing substantial effects on V˙O2max (Gist et al., 2014; Sloth et al., 2013; Bacon et al., 2013; Weston et al., 2014; Milanovic et al., 2015), mean power in time trials (Carr et al., 2011), or peak power in 30-s Wingate tests (Weston et al., 2014). While most of these meta-analyses have not explored subgroup analysis or other moderator effects (Gist et al., 2014; Sloth et al., 2013; Bacon et al., 2013; Carr et al., 2011), two have indicated that the more trained an individual, the smaller the improvement in V˙O2max (Weston et al., 2014; Milanovic et al., 2015), and in one of these studies, there was a substantial but unclear effect of HIIT on low-level athletes (Weston et al., 2014). No previous meta-analysis has focused on the effect of HIIT on elite athletes, who may be training close to an optimum level and, therefore, might gain less extra benefit from HIIT. Furthermore, HIIT encompasses different types that impose varying degrees of stress on the different systems mediating performance (Billat, 2001), but previous meta-analyses have focused primarily on V˙O2max without investigating the modifying effects of different types of HIIT on this and other performance measures.
To evaluate the effects of different types of HIIT, we categorized HIIT into six different types [Figure 1, based on the toolbox in the study by Stöggl et al. (2024)], ranging from most aerobic to most anaerobic. Aerobic intervals are performed with submaximal effort, while anaerobic intervals are performed at maximum effort and last up to 75 s (Gastin, 2001). Aerobic intervals are further categorized into traditional long intervals with durations of 2–10 min (Seiler et al., 2013; Spencer et al., 1996; Sandbakk et al., 2013) and intermittent short intervals with durations of 15–60 s (Helgerud et al., 2007; Stöggl et al., 2023). For anaerobic intervals, we included an intermediate level: speed endurance training (SET) and sprint interval training (SIT). For SET, intervals last between 10 and 75 s (Iaia and Bangsbo, 2010; Mohr et al., 2007); for SIT, sprints last between 2 and 10 s to ensure reaching maximal acceleration, speed, or power (Girard et al., 2011; Iaia et al., 2009; Bishop et al., 2011). SET can be differentiated into two types of HIIT: speed endurance maintenance training (SEMT) and speed endurance production training (SEPT), with the latter having ∼2 times longer recovery periods than the former (Iaia and Bangsbo, 2010). Sprint intervals can be divided into repeated sprint interval training (RSIT) and sprint interval training (SIT), again differentiated by the duration of recovery periods (Iaia and Bangsbo, 2010).
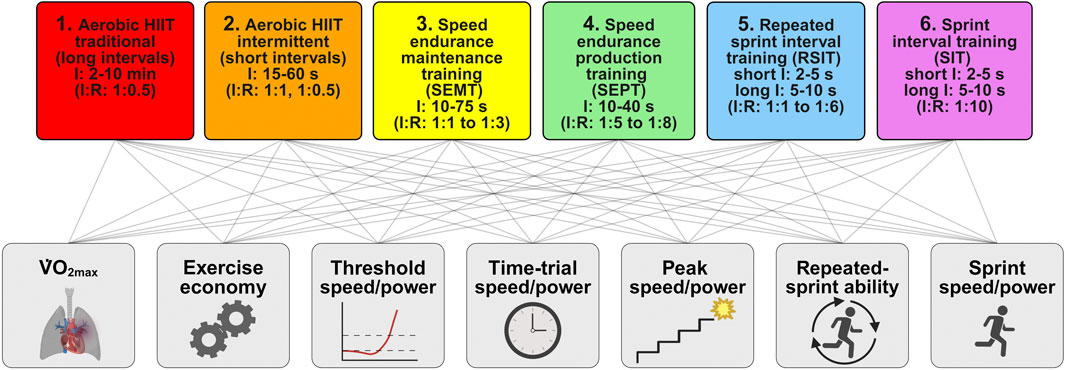
Figure 1. Schema for the classification of types of high-intensity interval training and their presumed effects on the measures and predictors of performance. The types of HIIT (upper row) and performance (lower row) are ordered from most aerobic on the left to most anaerobic on the right. Connecting lines of these rows show the possibility that all types of HIIT affect all the measures and predictors of endurance performance. I, interval duration; I:R, interval to recovery ratio; V˙O2max, maximum oxygen uptake (created using BioRender.com).
In their quest to optimize the training of competitive athletes, researchers have investigated the effects of several types of HIIT on various measures of performance: sprints and repeated sprints for team-sport athletes and time trials for athletes competing as individuals in a range of sports. Predictors of endurance performance have also been investigated: V˙O2max, peak speed or power in an incremental test, time to exhaustion in a constant-power or constant-speed test, aerobic/anaerobic threshold speed or power, and exercise economy. There have been only two studies of the effect of HIIT on time to exhaustion on elite athletes (Smith et al., 2003; Breil et al., 2010); in any case, effects on time to exhaustion should be converted to effects on power output to permit practical application to competitive athletes, and the conversion is problematic (Hinckson and Hopkins, 2005). However, there have been enough studies to permit the meta-analysis of the effects of HIIT on each of the other measures and predictors of performance. These measures and predictors are shown in Figure 1, ordered approximately to reflect the presumed greater effects of aerobic HIIT on aerobic measures and greater effects of anaerobic HIIT on anaerobic measures (to the left and right of the figure, respectively). The possibility that all types of HIIT affect all the measures is shown by the lines connecting HIIT with the measures. Our meta-analyses represent pioneering work in HIIT research in three respects: they are the first meta-analyses focusing on highly trained elite athletes; they include the modifying effects of different types of HIIT; and the effects on performance have been assessed with seven measures linked in varying degrees with aerobic power, anaerobic power, the neuromuscular system, and efficiency.
2 Methods2.1 Study registration and eligibility criteriaWe pre-registered our meta-analysis at PROSPERO (ID number: CRD42021236384) and followed the PRISMA guidelines (Page et al., 2021). In the analysis, separate effects were estimated for HIIT and for conventional training as control, then combined to estimate the net effect of HIIT; we, therefore, also included studies of HIIT without control groups because the controlled trials effectively provided controls for these studies (Weston et al., 2014). Studies were eligible for inclusion if the outcome was some measure of endurance or sprint performance in highly trained endurance athletes [runners (Smith et al., 2003; Stöggl and Sperlich, 2014; Menz et al., 2015; Salazar-Martinez et al., 2018), cyclists (Stöggl and Sperlich, 2014; Menz et al., 2015; Salazar-Martinez et al., 2018; Clark et al., 2014; Hanstock et al., 2020; Laursen et al., 2002; Skovereng et al., 2018; Stenqvist et al., 2020; Sylta et al., 2016; Rønnestad and Vikmoen, 2019; Stepto et al., 1999), duathletes or triathletes (Smith et al., 2003; Stöggl and Sperlich, 2014; Menz et al., 2015; Salazar-Martinez et al., 2018; Hanstock et al., 2020; Laursen and Jenkins, 2002), cross-country skiers (Sandbakk et al., 2013; Stöggl and Sperlich, 2014; Johansen et al., 2021; Sandbakk et al., 2011), and rowers (Stevens et al., 2015)], with mean baseline V˙O2max values ≥60 mL kg–1·min–1 for men (Sandbakk et al., 2013; Smith et al., 2003; Stöggl and Sperlich, 2014; Menz et al., 2015; Salazar-Martinez et al., 2018; Clark et al., 2014; Hanstock et al., 2020; Laursen et al., 2002; Skovereng et al., 2018; Stenqvist et al., 2020; Sylta et al., 2016; Rønnestad and Vikmoen, 2019; Stepto et al., 1999; Johansen et al., 2021; Sandbakk et al., 2011; Stevens et al., 2015) and ≥55 mL kg–1·min–1 for women (Sandbakk et al., 2013; Stöggl and Sperlich, 2014; Menz et al., 2015; Sandbakk et al., 2011), or in healthy other elite athletes [first league, national team, or international level in ball (Wells et al., 2014; Helgerud et al., 2001; Akdoğan et al., 2021; Iaia et al., 2015; Purkhus et al., 2016; Soares-Caldeira et al., 2014; Thomassen et al., 2010; Venturelli et al., 2008; Chtara et al., 2017; Hermassi et al., 2018; Selmi et al., 2018; Delextrat et al., 2018; Dupont et al., 2004), racket (Liu et al., 2021), canoe sports (Sheykhlouvand et al., 2018a; Sheykhlouvand et al., 2018b; Sheykhlouvand et al., 2016; Yang et al., 2017), and alpine skiers (Breil et al., 2010)]. We included one study on the upper-body exercise of male endurance athletes with V˙O2max values of ∼55 mL kg–1·min–1 as their running V˙O2max values met our inclusion criteria (Johansen et al., 2021). We accepted endurance athletes from different disciplines but did not include a mixture of endurance and other types of athletes within a single study. Studies in which training and testing were unrelated to the specific sport under investigation were excluded (Seo et al., 2019; Ojeda-Aravena et al., 2021; Herrera-Valenzuela et al., 2021; Thom et al., 2020; Sarkar et al., 2021). There was no eligibility for age, sports, training periodization, sample size, or international ranking of a national sports team. For two research groups that each presented the same outcomes for the same training and athletes in separate studies, the more recent study was excluded (Stöggl and Bjorklund, 2017; Laursen et al., 2005). Two different training studies of partially the same athletes were included as separate studies (Menz et al., 2015; Salazar-Martinez et al., 2018). The inclusion criteria for the HIIT interventions were at least two training sessions per week for at least a week and at least five sessions. Measures of V˙O2max estimated from time trials were excluded. HIIT studies that included other types of interventions (e.g., ingestion of stimulants or other supplements, change in the environmental condition, or the use of modalities like compression garments) were excluded. HIIT exercise intensities had to be ≥90% of the maximal heart rate (Sandbakk et al., 2013; Breil et al., 2010; Stöggl and Sperlich, 2014; Menz et al., 2015; Johansen et al., 2021; Sandbakk et al., 2011; Helgerud et al., 2001; Seo et al., 2019), ≥90% of V˙O2max (Smith et al., 2003; Salazar-Martinez et al., 2018; Sheykhlouvand et al., 2018b; Sheykhlouvand et al., 2016; Yang et al., 2017), or classified as “all-out” efforts for speed (Clark et al., 2014; Hanstock et al., 2020; Wells et al., 2014; Akdoğan et al., 2021; Iaia et al., 2015; Purkhus et al., 2016; Soares-Caldeira et al., 2014; Thomassen et al., 2010; Venturelli et al., 2008; Chtara et al., 2017; Hermassi et al., 2018; Selmi et al., 2018; Delextrat et al., 2018; Dupont et al., 2004) or power (Laursen et al., 2002; Skovereng et al., 2018; Stenqvist et al., 2020; Sylta et al., 2016; Rønnestad and Vikmoen, 2019; Stepto et al., 1999; Stevens et al., 2015; Sheykhlouvand et al., 2018a). The outcomes for several groups in multi-arm studies were excluded due to low exercise intensity (Supplementary Tables S3–S9). We accepted peer-reviewed articles published in English or German.
2.2 Literature search and data synthesisThe workflow is presented in Figure 2. On 18 February 2021, the electronic bibliographic databases PubMed, Scopus, SPORTDiscus, and Web of Science were scanned for relevant studies. The search string, conducted in the title, abstract, and keywords, is presented in Supplementary Appendix. The search results were imported into EndNote 20.1 (Clarivate Analytics, Philadelphia, PA, United States) for deduplication before being exported to Rayyan QCRI software (https://rayyan.qcri.org). After another deduplication, all authors independently screened the articles based on the title and abstract, and we identified 547 papers that met the inclusion criteria. Seven additional studies identified through references cited in eligible articles were checked for inclusion. Subsequently, these full-text articles were screened, and discrepancies in 28 studies were resolved by two authors (HPW and JB).
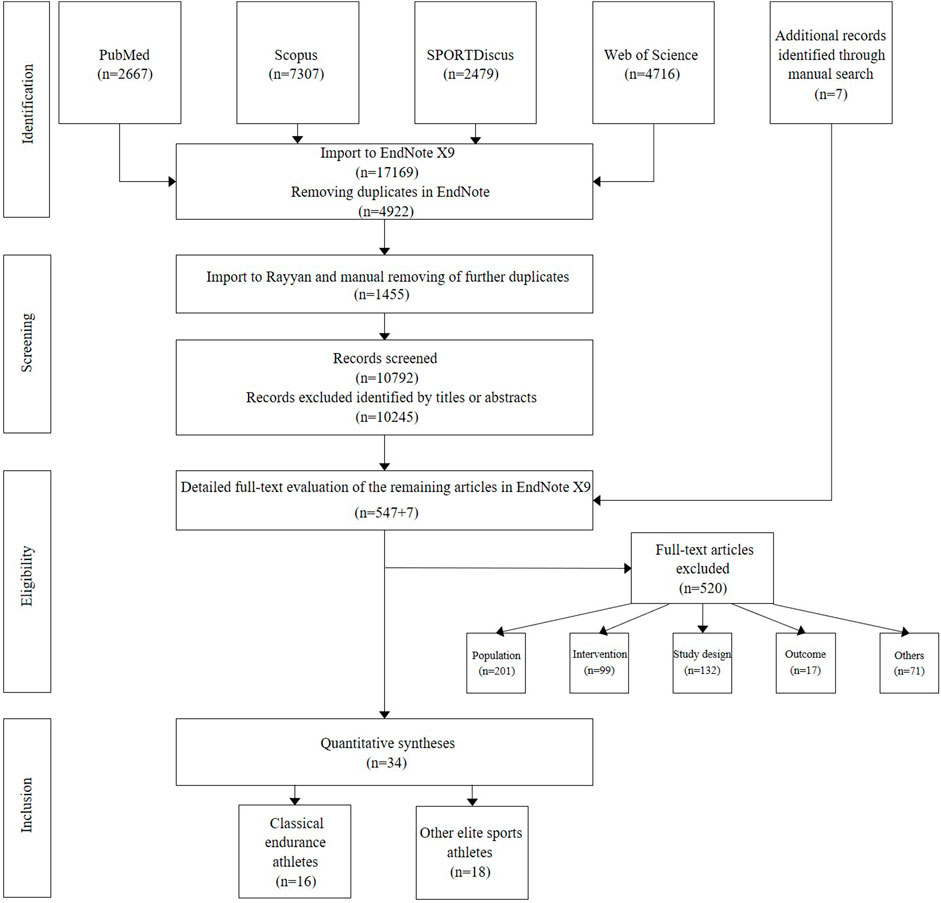
Figure 2. PRISMA flow diagram detailing the search included and excluded studies. A total of 34 files fulfilled the eligibility criteria (see references in Supplementary Appendix).
2.3 Study qualityTwo authors (HPW and JB) independently rated the included studies on a quality scale proposed by Galna et al. (2009) (Supplementary Tables S1, S2). Interrater discrepancies were resolved by consensus, and no studies were excluded due to low scores.
2.4 Data extractionThree authors (JB, TS, and HPW) collected subject characteristics and quantitative data from pre- and post-tests. Two authors (WGH and HPW) searched for inferential statistics to obtain standard errors of each study estimate, decided on potential moderators, and conducted all statistical analyses and data presentations using Statistical Analysis System (SAS OnDemand for Academics, version 9.4, SAS Institute, Cary, NC). Raw data, when available (Stöggl and Sperlich, 2014; Clark et al., 2014) or digitizable (Breil et al., 2010; Skovereng et al., 2018; Rønnestad and Vikmoen, 2019; Sandbakk et al., 2011; Stevens et al., 2015; Purkhus et al., 2016; Thomassen et al., 2010) (DigitizeIt, 38108 Braunschweig, Germany, or WebPlotDigitizer Pacifica, CA, United States), were re-analyzed using the statistical model in the study using SPSS Statistics V.27.0 (IBM Corporation, Chicago, Illinois, United States). Some study estimates and uncertainties were digitized from figures (Sandbakk et al., 2013; Smith et al., 2003; Hanstock et al., 2020; Laursen et al., 2002; Stepto et al., 1999; Sandbakk et al., 2011; Iaia et al., 2015; Liu et al., 2021; Sheykhlouvand et al., 2016; Yang et al., 2017); the accuracy of data extraction was verified by re-digitization (HPW) and conspicuousness checks (WGH and HPW). Otherwise, HPW asked corresponding and/or co-authors for the required values (Smith et al., 2003; Menz et al., 2015; Salazar-Martinez et al., 2018; Hanstock et al., 2020; Stenqvist et al., 2020; Rønnestad and Vikmoen, 2019; Sandbakk et al., 2011; Stevens et al., 2015; Helgerud et al., 2001; Akdoğan et al., 2021; Chtara et al., 2017; Hermassi et al., 2018; Delextrat et al., 2018; Liu et al., 2021; Seo et al., 2019). Sufficient data for some variables were obtained (Menz et al., 2015; Salazar-Martinez et al., 2018; Hanstock et al., 2020; Skovereng et al., 2018; Stenqvist et al., 2020; Rønnestad and Vikmoen, 2019; Akdoğan et al., 2021; Liu et al., 2021), but responses were not received from some authors (Smith et al., 2003; Stevens et al., 2015; Helgerud et al., 2001; Chtara et al., 2017; Hermassi et al., 2018; Delextrat et al., 2018), while other authors had either deleted their data due to national regulations (Sandbakk et al., 2013; Sandbakk et al., 2011) or could not send the required information for all requests (Akdoğan et al., 2021; Liu et al., 2021).
Endurance and sprint performance measures were categorized into sprint speed/power, repeated-sprint ability, time–trial speed/power, peak speed/power, aerobic/anaerobic threshold, V˙O2max, and exercise economy (Figure 1). Due to a scarcity of intervention studies on different types of athletes (classical endurance or other elite athletes and male or female participants), meta-analyses for some outcome measures were restricted to specific subgroups. For sprint speed/power, the meta-analysis was limited to non-endurance athletes and based on the mean speed of linear running between 10 m and 40 m. The longest sprint duration was 7.69 s for a 40-m sprint (Selmi et al., 2018). For the repeated-sprint-ability tests, the distances were between 20 m and 40 m, sometimes including a 180° turn halfway. The number of sprints was between 2 and 15, with a mean time of a single sprint of 6.0 ± 1.4 s and a total sprint time of 44 ± 17 s. The mean or total time was used for the percent effects of the interventions. Time-trial times were all for endurance athletes and lasted between 0.5 min and ∼1 h. The trials consisted of either fixed-distance (0.4 km–40 km) or fixed-time (40 min) running or cycling. Wingate tests on a cycle or rowing ergometer of 30 s or 60 s were also categorized as time trials.
Performance effects of the time trial were obtained via changes in the mean speed or power. For this, we converted the percent effects on cycling and rowing time or speed to percent effects on power by multiplying by 2.2 for cycling and 3.0 for rowing (Hopkins et al., 2001). For peak speed/power, we used the highest speed obtained during running incremental treadmill ramp tests or YoYo Intermittent Recovery running tests at Level 1 or 2 (YoYo IR1 and IR2) or the highest power during an incremental ramp ergometer cycle test. The aerobic and anaerobic threshold data were presented by the authors of the included studies as speed or power. When fractional utilization at the threshold was presented (Sandbakk et al., 2013; Smith et al., 2003; Sandbakk et al., 2011; Sheykhlouvand et al., 2018a), the values were converted to V˙O2 by multiplying by V˙O2max in the same test before the calculation of the percent change, its standard error, and confidence interval. For V˙O2max, absolute (L·min−1) or relative changes normalized to body mass (mL·kg−1·min−1) were accepted; if both were available, we used the relative changes. Exercise economy was estimated from V˙O2 during running, rowing, or cycling at a submaximal velocity between 8 and 13.5 km h−1 and 75 and 220 W. Oxygen cost was converted to exercise economy.
The mean effects of HIIT and usual control training were calculated as percent changes. The standard error of the changes was calculated for each subgroup using p-values, t-values, or confidence intervals. Where these statistics lacked, the standard error was imputed via the typical error of measurement as follows (Carr et al., 2011; Vandenbogaerde and Hopkins, 2011): available standard errors were converted to typical errors and averaged separately (via variances weighted by degrees of freedom) for experimental and control groups for the given outcome variable; these typical errors were assumed to apply to experimental and control groups in those studies lacking standard errors; all typical errors were then converted to standard errors by multiplying by √2 and dividing by √(group sample size) (HIIT spreadsheet). Confidence limits for each study estimate shown in forest plots (Figures 3–9) and Supplementary Tables S3–S9 were calculated by log-transforming the estimates and their standard errors and then back-transforming to percent values.
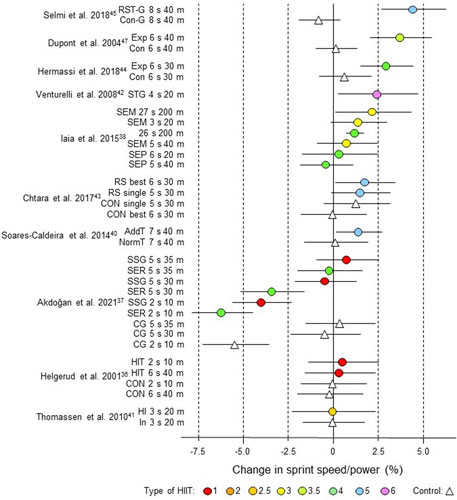
Figure 3. Forest plot of HIIT and control training effects on sprint speed/power for studies included in the meta-analysis. The data are study estimate scores representing percent changes in the HIIT (circles) and control (triangle) groups in descending order of the largest HIIT effect in each study. Error bars represent 90% confidence intervals. The type of HIIT is color- and number-coded, as shown in Figure 1. The abbreviations for the type of training are those of the original authors. RST-G, repeated-sprint training group; Con-G, control group; Exp, experimental group, Con, control group; STG, sprint-training group; SEM, speed endurance maintenance; SEP, speed endurance production; RS, repeated sprints; AddT; additional repeated-sprint training group; NormT, normal training group; SSG, small-sided games; SER; speed-endurance running; CG, control group; HIT, high-intensity training; HI, high intensity, IN, inactive.
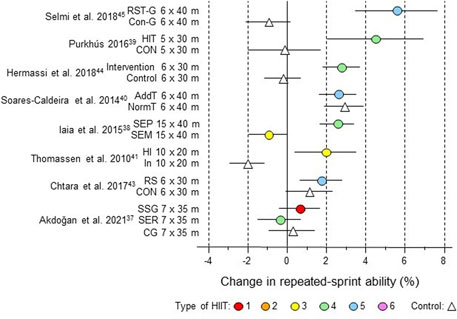
Figure 4. Forest plot of HIIT and control training effects on repeated-sprint ability for studies included in the meta-analysis. The data are study estimate scores representing percent changes in the HIIT (circles) and control (triangle) groups in descending order of the largest HIIT effect in each study. Error bars represent 90% confidence intervals. The type of HIIT is color- and number-coded, as shown in Figure 1. The abbreviations for the type of training are those of the original authors. RST, repeated-sprint training; Con-G, control group; HIT, high-intensity training; Con, control group; AddT; additional repeated-sprint training group; NormT, normal training group; SEM, speed endurance maintenance; SEP, speed endurance production; HI, high intensity, IN, inactive; RS, repeated sprints; SSG, small-sided games; SER, speed-endurance running; CG, control group.
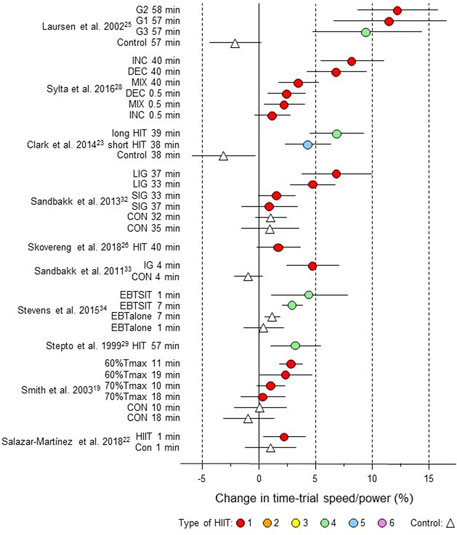
Figure 5. Forest plot of HIIT and control training effects on time-trial speed/power for studies included in the meta-analysis. The data are study estimate scores representing percent changes in the HIIT (circles) and control (triangle) groups in descending order of the largest HIIT effect in each study. Error bars represent 90% confidence intervals. The type of HIIT is color- and number-coded, as shown in Figure 1. The abbreviations for the type of training are those of the original authors. G1 to G3, group; INC, increasing HIT; DEC, decreasing HIIT; MIX; mixed HIT group; LIG, long-interval group; SIG, short-interval group; CON, control group; HIT, high-intensity training; IG, intervention group; EBTSIT, endurance-based sprint interval training; EBTalone, endurance-based training alone; Tmax, time for which V˙O2max can be maintained.
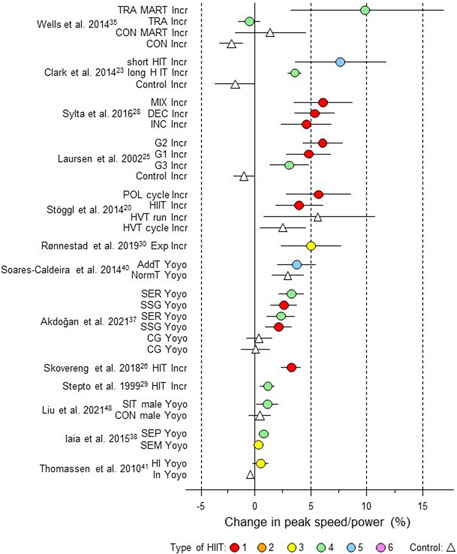
Figure 6. Forest plot of HIIT and control training effects on peak speed/power for studies included in the meta-analysis. The data are study estimate scores representing percent changes in the HIIT (circles) and control (triangle) groups in descending order of the largest HIIT effect in each study. Error bars represent 90% confidence intervals. The type of HIIT is color- and number-coded, as shown in Figure 1. The abbreviations for the type of training are those of the original authors. Incr, incremental; TRA MART Incr, training maximal aerobic running test incremental; TRA, training; HIT, high-intensity training; CON, control group; INC, increasing HIT; DEC, decreasing HIT; MIX; mixed HIT group; G1 to G3, group; POL, polarized; HVT, high-volume training; Exp, experimental; AddT; additional repeated-sprint training group; NormT, normal training group; SSG, small-sided game; SER; speed-endurance running; CG, control group; SIT, speed interval training; SEP, speed endurance production; SEM, speed endurance maintenance; HI, high intensity; IN, inactive.
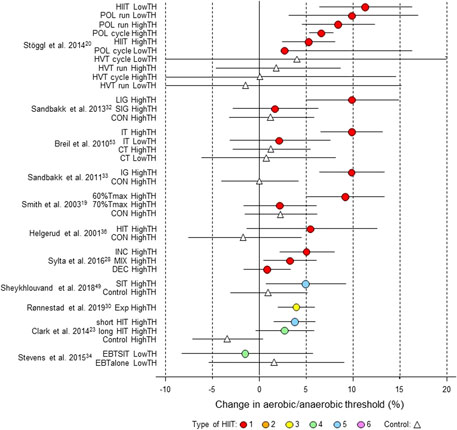
Figure 7. Forest plot of HIIT and control training effects on aerobic/anaerobic threshold for studies included in the meta-analysis. The data are study estimate scores representing percent changes in the HIIT (circles) and control (triangle) groups in descending order of the largest HIIT effect in each study. Error bars represent 90% confidence intervals. The type of HIIT is color- and number-coded, as shown in Figure 1. The abbreviations for the type of training are those of the original authors. TH, threshold; POL, polarized; LIG, long-interval group; SIG, short-interval group; IT, interval training; CT, control training; IG, intervention group; CON, control group; Tmax, time for which V˙O2max can be maintained; INC, increasing HIT; DEC, decreasing HIT; MIX; mixed HIT group; EBTSIT, endurance-based sprint interval training; EBTalone, endurance-based training alone.
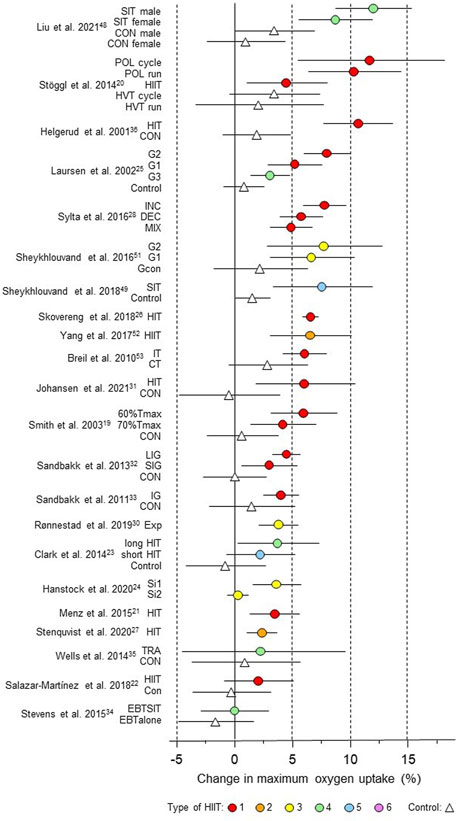
Figure 8. Forest plot of HIIT and control training effects on maximum oxygen uptake for studies included in the meta-analysis. The data are study estimate scores representing percent changes in the HIIT (circles) and control (triangle) groups in descending order of the largest HIIT effect in each study. Error bars represent 90% confidence intervals. The type of HIIT is color- and number-coded, as shown in Figure 1. The abbreviations for the type of training are those of the original authors. SIT, speed interval training; POL, polarized; HVT, high-volume training; HIT, high-intensity interval training; CON, control group; G1 to G3, group; INC, increasing HIT; DEC, decreasing HIT; MIX; mixed HIT group; IT, interval training; CT, control training; Tmax, time for which V˙O2max can be maintained; LIG, long-interval group; SIG, short-interval group; SI, short intervals; TRA, training; EBTSIT, endurance-based sprint interval training; EBTalone, endurance-based training alone.
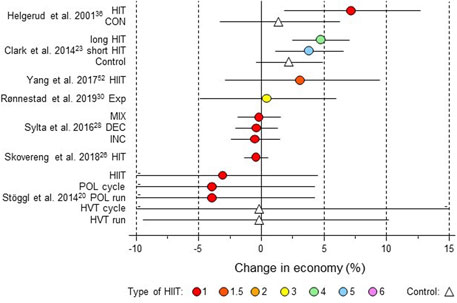
Figure 9. Forest plot of HIIT and control training effects on running or cycling economy for studies included in the meta-analysis. The data are study estimate scores representing percent changes in the HIIT (circles) and control (triangle) groups in descending order of the largest HIIT effect in each study. Error bars represent 90% confidence intervals. The type of HIIT is color- and number-coded, as shown in Figure 1. The abbreviations for the type of training are those of the original authors. HIT, high-intensity training; CON, control group; Exp, experimental group; INC, increasing HIT; DEC, decreasing HIT; MIX; mixed HIT group; POL, polarized; HVT, high-volume training.
2.5 ModeratorsTables 1–3 provide an overview of the sample size of the included studies and the moderators included in each meta-analysis. A few missing values of moderators were imputed, as shown in Supplementary Tables S1, S2. Nominal moderators were type of athlete (endurance or other), type of test (incremental or YoYo for peak speed/power), whether HIIT was performed as extra training or replacement, and phase of training, with values of 0, 0.5, or 1 for on-season, a mixture of on and off-season, and off-season. The type of HIIT was included as a numeric linear moderator [coded 1–6, thus from aerobic HIIT using classical intervals to SIT, as shown in Figure 1 and discussed in detail by Stöggl et al. (2024)]. Some studies performed a progressive HIIT training phase, for example, changing from HIIT type 1 of a long aerobic interval to HIIT type 2 of a short interval duration but higher intensity during the intervention period. For such studies, we included an average of two adjacent integers (e.g., 1.5). To account for the amount of training in each study, we used the weeks of training, which applied equally to the HIIT and control groups.
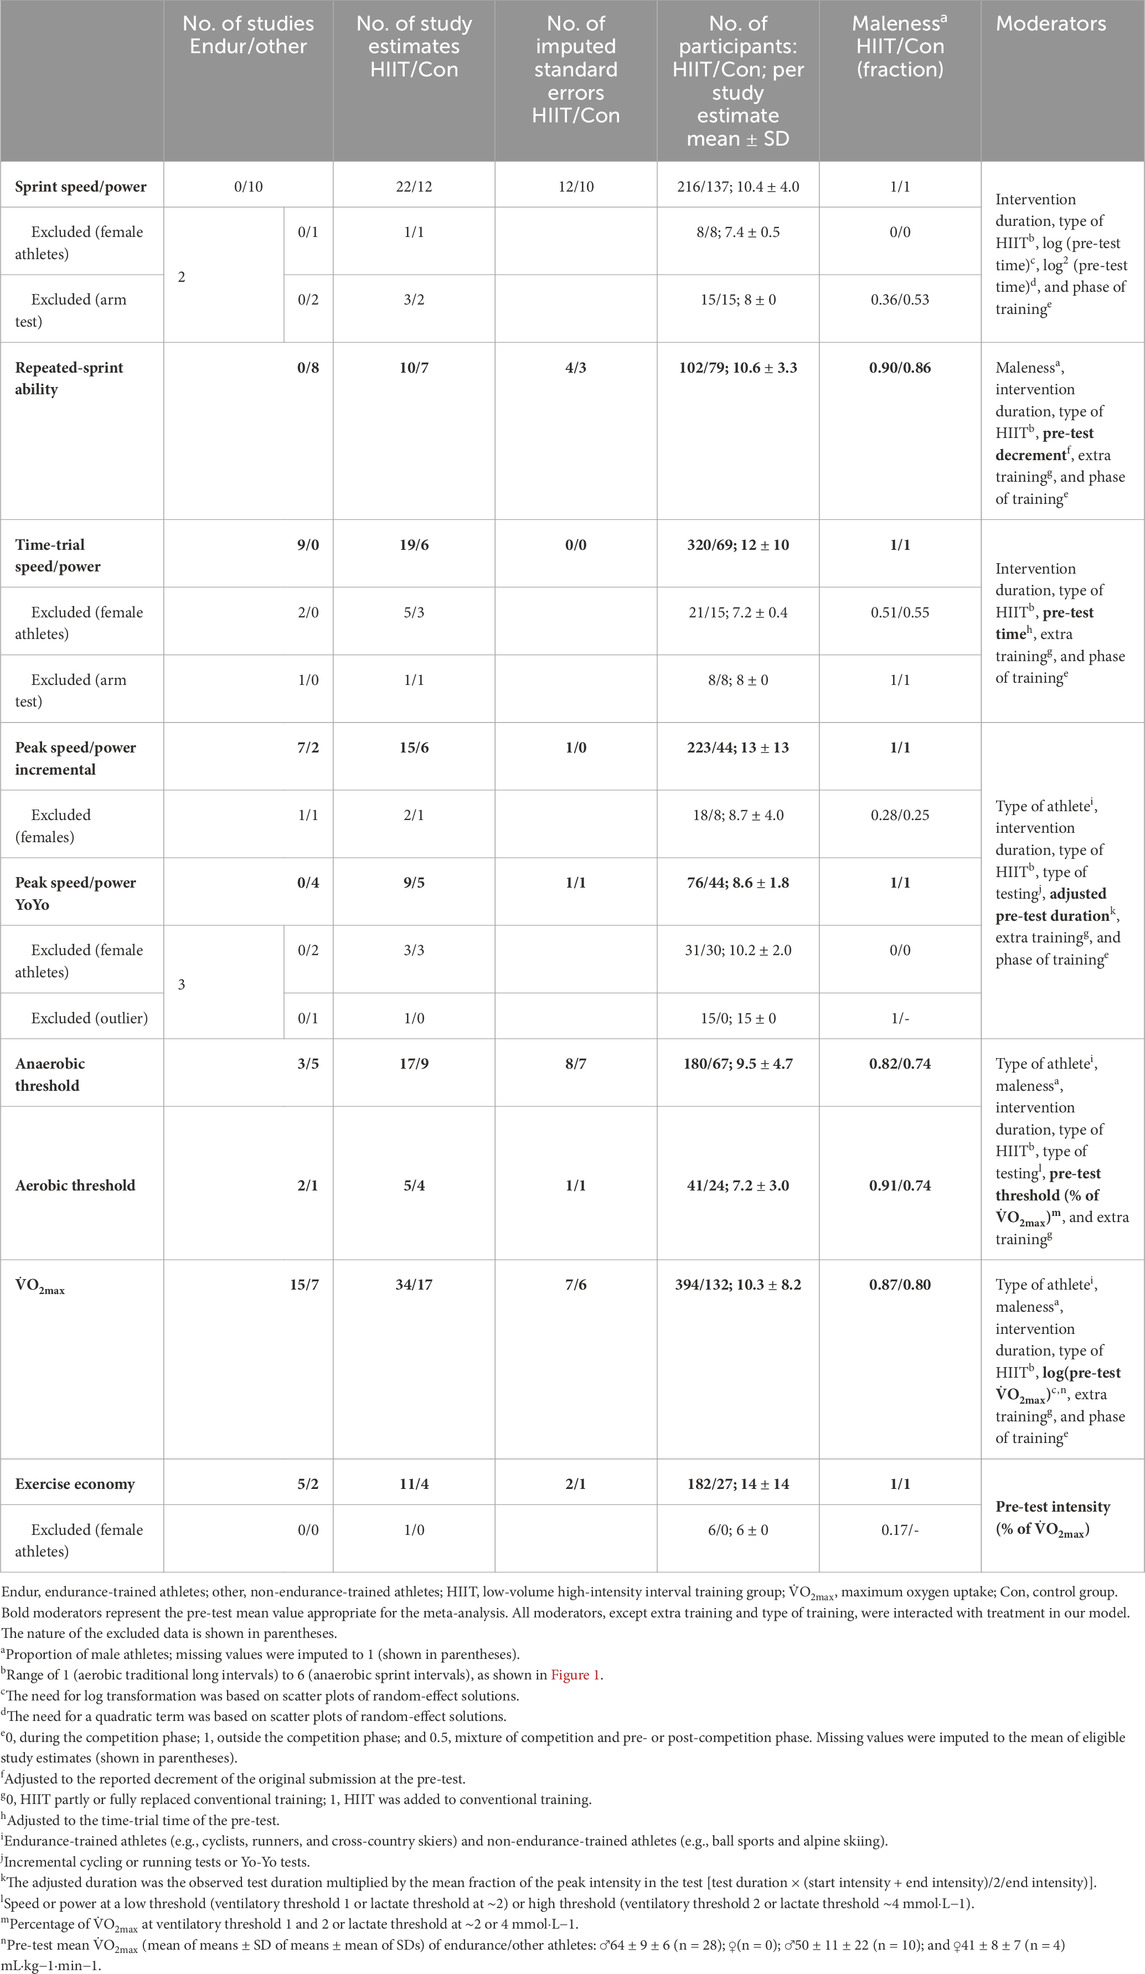
Table 1. Measures of the sample size of studies contributing to and excluded from the meta-analysis of each measure, with the list of moderators in the meta-analytic model.
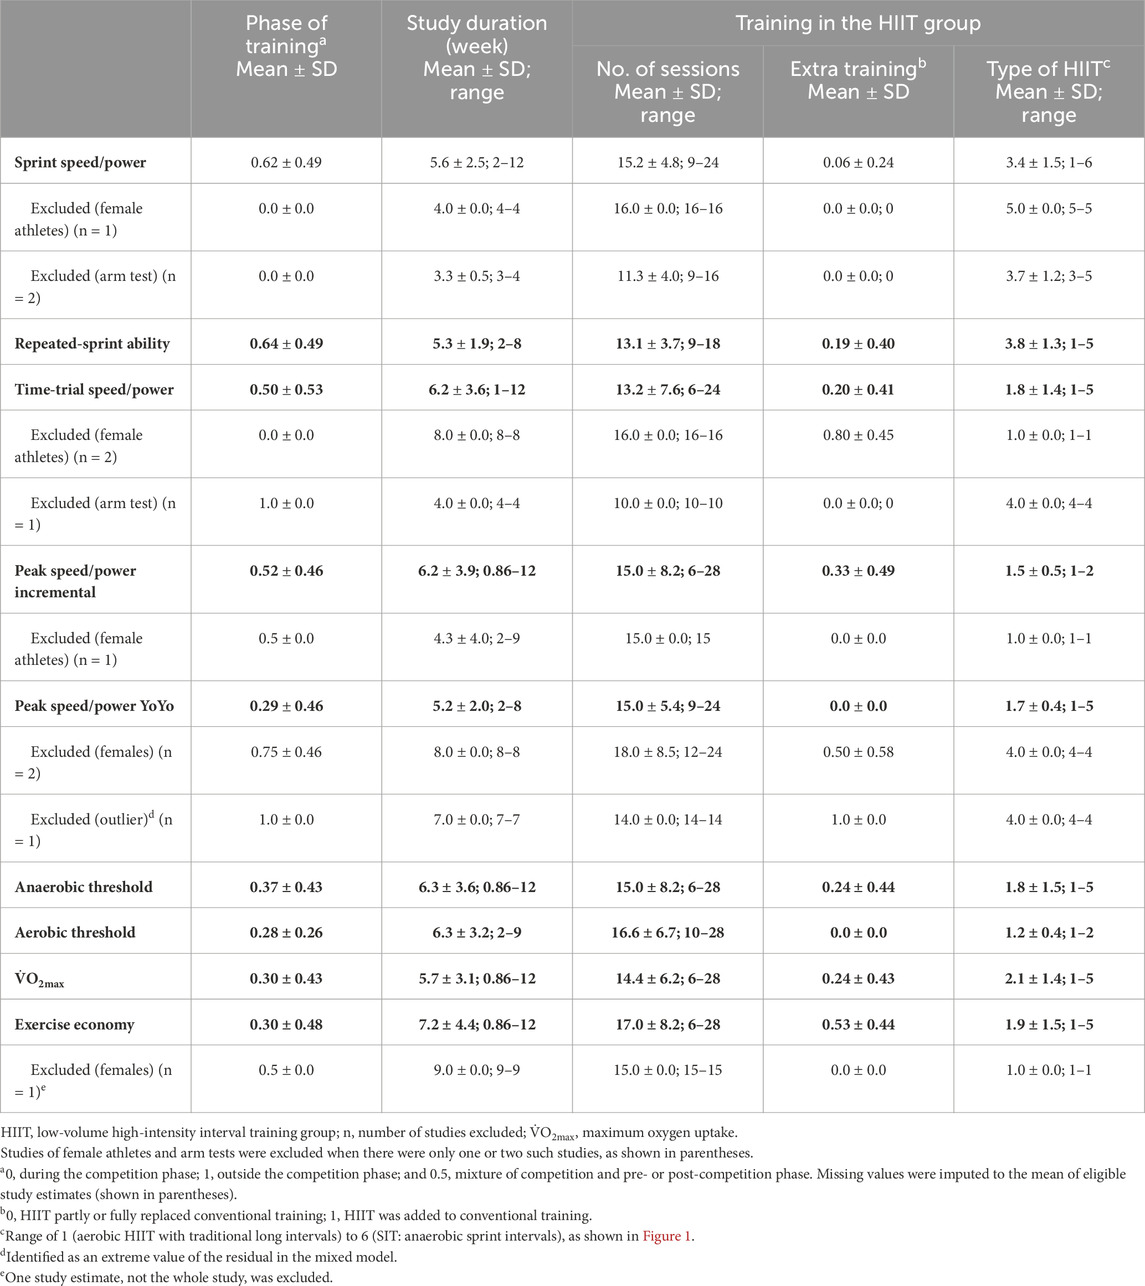
Table 2. Characteristics of training in the studies contributing to (in bold) and excluded from the meta-analysis of each measure.
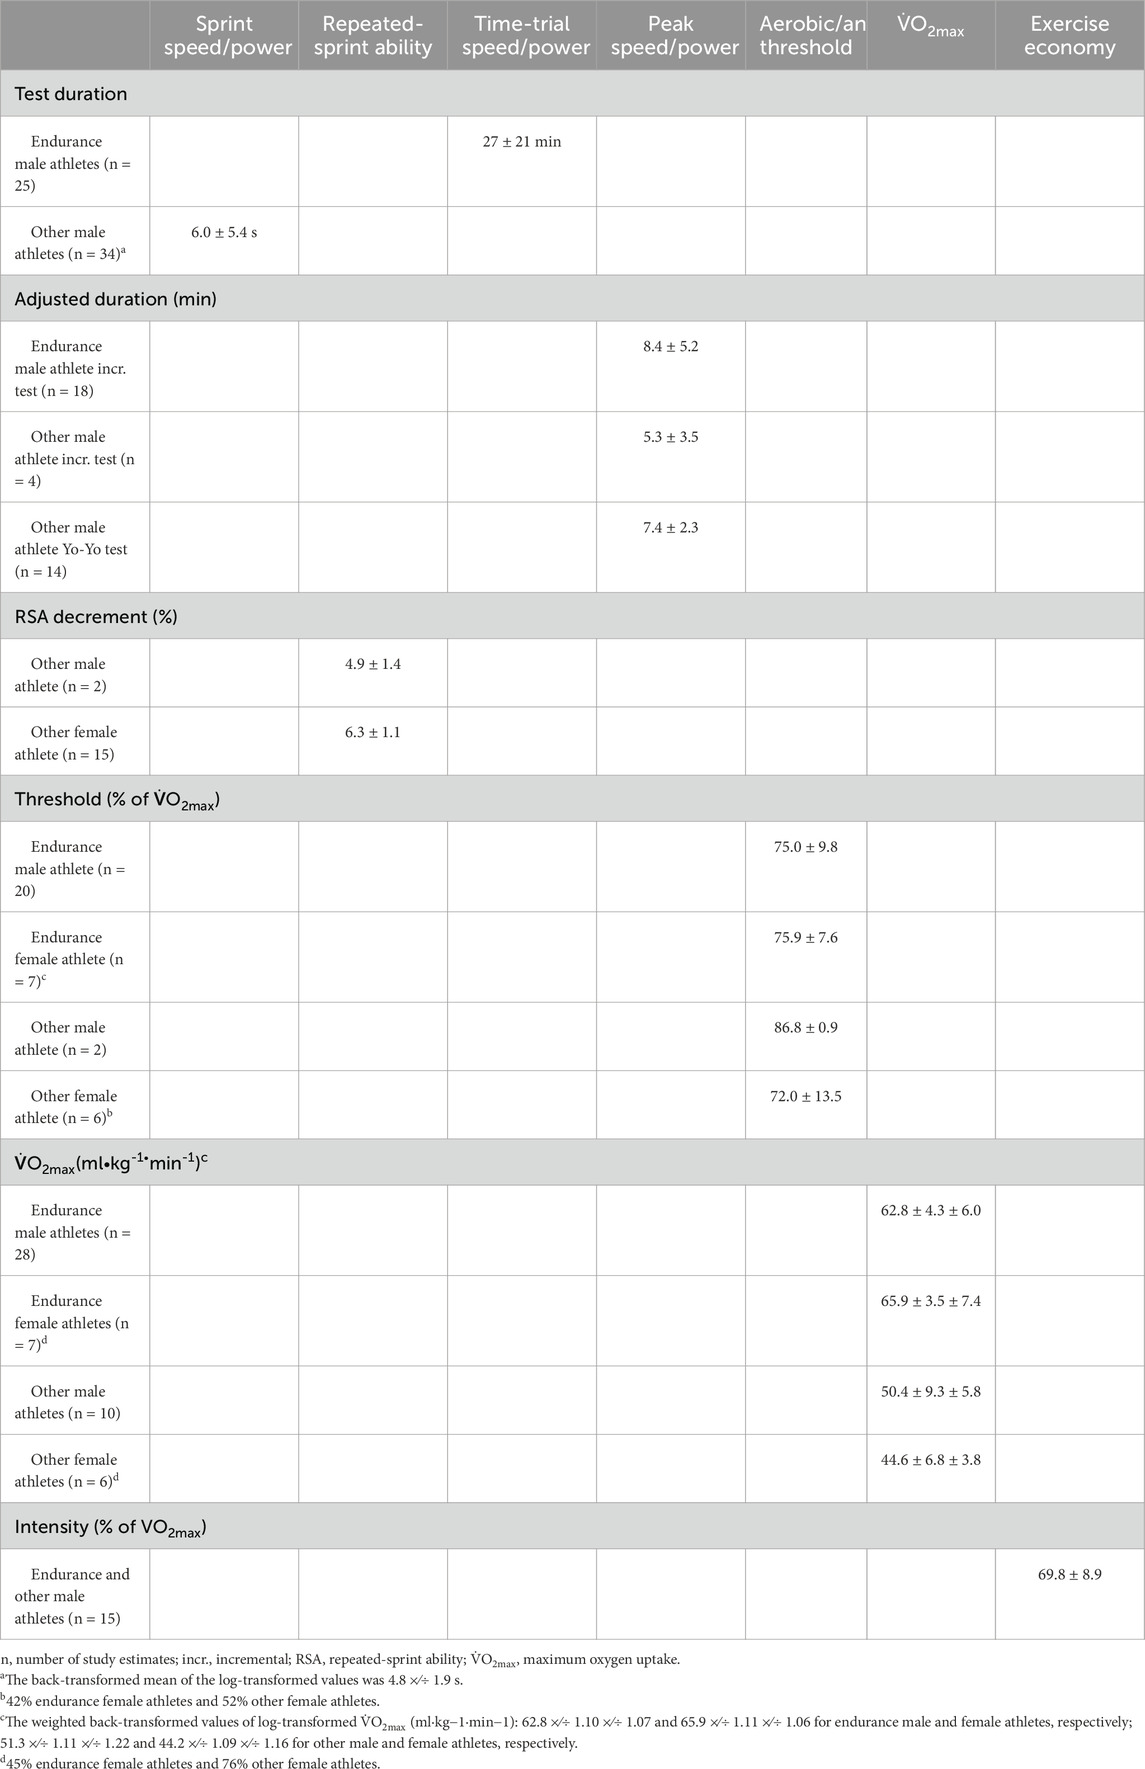
Table 3. Pre-test moderators for the different outcome measures of included studies. Data are the mean ± between-study SD (and ± mean of within-study SDs for V˙O2max).
Table 3 provides an overview of the pre-test moderators. Distinct physiological processes might determine sprint and time-trial performance of different distances and durations; therefore, we included pre-test time as a numeric linear moderator. For peak speed/power, adjusted test duration was included to account for the design of the incremental test, in which longer stages and smaller increments result in lower values (Morton, 1994; Luttikholt et al., 2006). To account for that, we adjusted the duration to that of a time trial in which the same amount of work was done using the formula: adjusted duration = (pre-test duration) × (pre-test mean speed/power)/(pre-test peak speed/power). For repeated-sprint ability, the reported percent decrement representing fatigue arising from the number and duration of sprints was included. For the aerobic/anaerobic threshold, the possible modifying effect of different threshold intensities was taken into account by including the pre-test threshold as a percent of V˙O2max. For V˙O2max, the inclusion of the pre-test mean accounted for possible ceiling effects on improvements. For exercise economy, the intensity at which economy was measured was V˙O2 expressed as a percent of V˙O2max; for some study estimates lacking V˙O2 (Skovereng et al., 2018; Sylta et al., 2016; Rønnestad and Vikmoen, 2019), it was estimated from the gross efficiency and workload by assuming the V˙O2 corresponding to a respiratory exchange ratio of 0.85 (Skovereng et al., 2018; Rønnestad and Vikmoen, 2019).
Apart from extra training and the type of HIIT, all moderators interacted with treatment. After initial explorations, a moderator that distinguishes between running and cycling performance was not included. The following interactions were investigated but were unclear and not included in the final models: type of HIIT with the duration of time trials on time-trial performance; type of HIIT with the duration of sprints on sprint performance; and type of HIIT with itself (a quadratic effect) on sprint performance. We investigated the number of HIIT sessions as an additional moderator, but it did not contribute usefully to the analysis owing to its strong correlations with weeks of training. There were insufficient study estimates to include sex as a moderator for sprint speed/power, time-trial speed/power, and peak speed/power. There were also insufficient study estimates to include arm tests for sprint speed/power or any moderators for exercise economy.
2.6 Data analysisRandom-effects meta-analysis models were realized using the mixed-model procedure (Proc Mixed). In each meta-analysis, the dependent variable was the log-transformed-extracted percentage change (100 × natural log[1 + percent change/100]). Sample estimates were weighted by the inverse square of their log-transformed standard errors, with the residual variance set to unity in the mixed model to perform the weighting (Rønnestad and Vikmoen, 2019; Yang, 2003). The fixed effects were treatment (HIIT or control) and the moderators described above. The random effects were study identity and sample-estimate identity within studies (with separate variances estimated for HIIT and control groups). The square root of the sum of study and sample-estimate variances provided an estimate of heterogeneity [the tau statistic (Higgins et al., 2024)] for HIIT and control treatments, representing differences between settings in predicted mean effects not due to sampling variation. The random effects were estimated, allowing only for positive variance, but standard errors of the variances were used to calculate appropriate lower and upper confidence limits, assuming a normal sampling distribution for the variances.
We examined scatter plots representing random-effect solution values versus standard errors of the study estimates to identify potential outliers and publication bias (Neville et al., 2022). One extreme outlier (Hermassi et al., 2018) was deleted in the peak speed/power analysis (shown in Supplementary Table S6). Potential publication bias was evident for peak speed/power (Figure 10A). However, running the analysis with the seven data points potentially contributing to publication bias (Figure 10B) did not result in substantial changes in the predicted effects. We retained these points to avoid loss of precision. To further address publication bias, we conducted simulations in SAS and RStudio to estimate any potential bias arising from the publication of only statistically significant effects on athlete endurance performance. Our analysis indicated that for the magnitudes of the effects observed, publication bias is expected to be negligible (Wiesinger et al., 2024a). Scatter plots of random-effect solution values versus linear predictors were examined for evidence that the use of simple linear moderators was adequate; the choice of log-transformation for some moderators (pre-test V˙O2max for V˙O2max and pre-test time for sprint speed/power) and the use of a quadratic term (test time for sprint speed/power) was motivated partly by these plots.
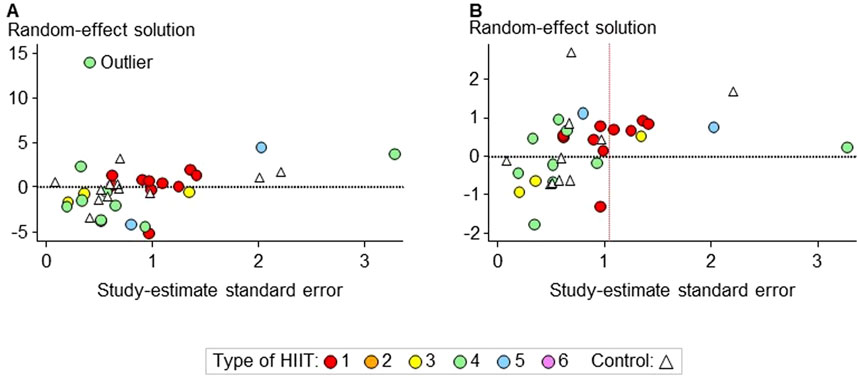
Figure 10. Scatterplot of the random-effect solution values versus the study estimate standard error before (A) and after (B) the exclusion of an extreme outlier in the meta-analysis of peak speed/power. The asymmetry in the scatterplot in (B), represented by only positive values on the right to the red vertical dashed line, indicates possible publication bias. However, the mean bias of these seven values is trivial (<1%), and re-running the meta-analysis without the corresponding study estimates did not result in substantial changes in the predicted effects.
The effects of HIIT and control training were predicted for representative values of moderators for each meta-analysis, assuming that HIIT was performed during the competition phase and as replacements for some conventional training (see Tables 4–10 for details). The effects of the nominal moderators (e.g., male vs. female athletes, endurance vs. other athletes, and incremental vs. YoYo) are reported as differences between levels. The numeric moderators are evaluated as the effect of approximately two standard deviations (the mean of the pre-test study SDs of subject characteristics, such as V˙O2max, or the SD of study characteristics, such as study duration).
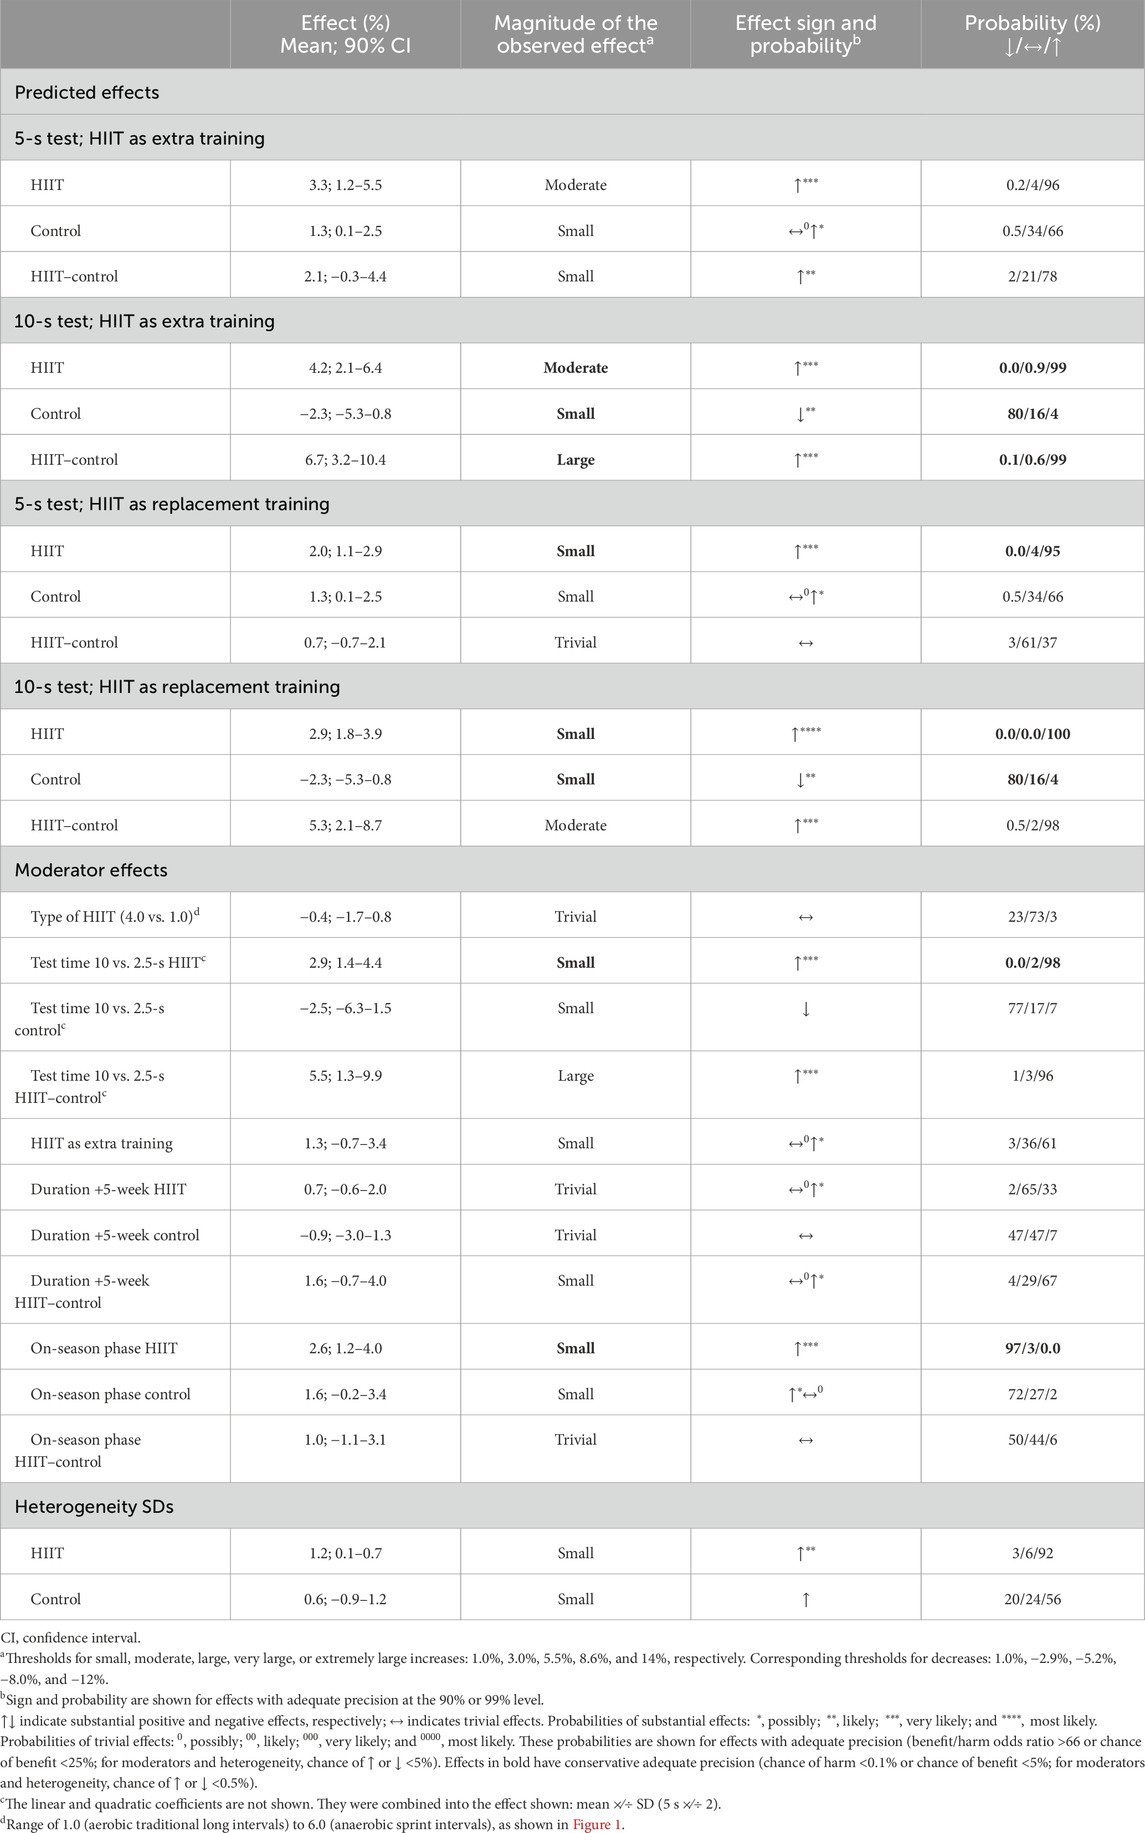
Table 4. Predicted effects, moderator effects, and heterogeneity SDs in the meta-analysis of sprint speed/power. Predicted effects are for 6 weeks of speed-endurance maintenance HIIT (aerobic rank = 3) and control training of other (non-endurance) male athletes in the on-season for 5- and 10-s leg tests and with HIIT performed as extra or replacement training.
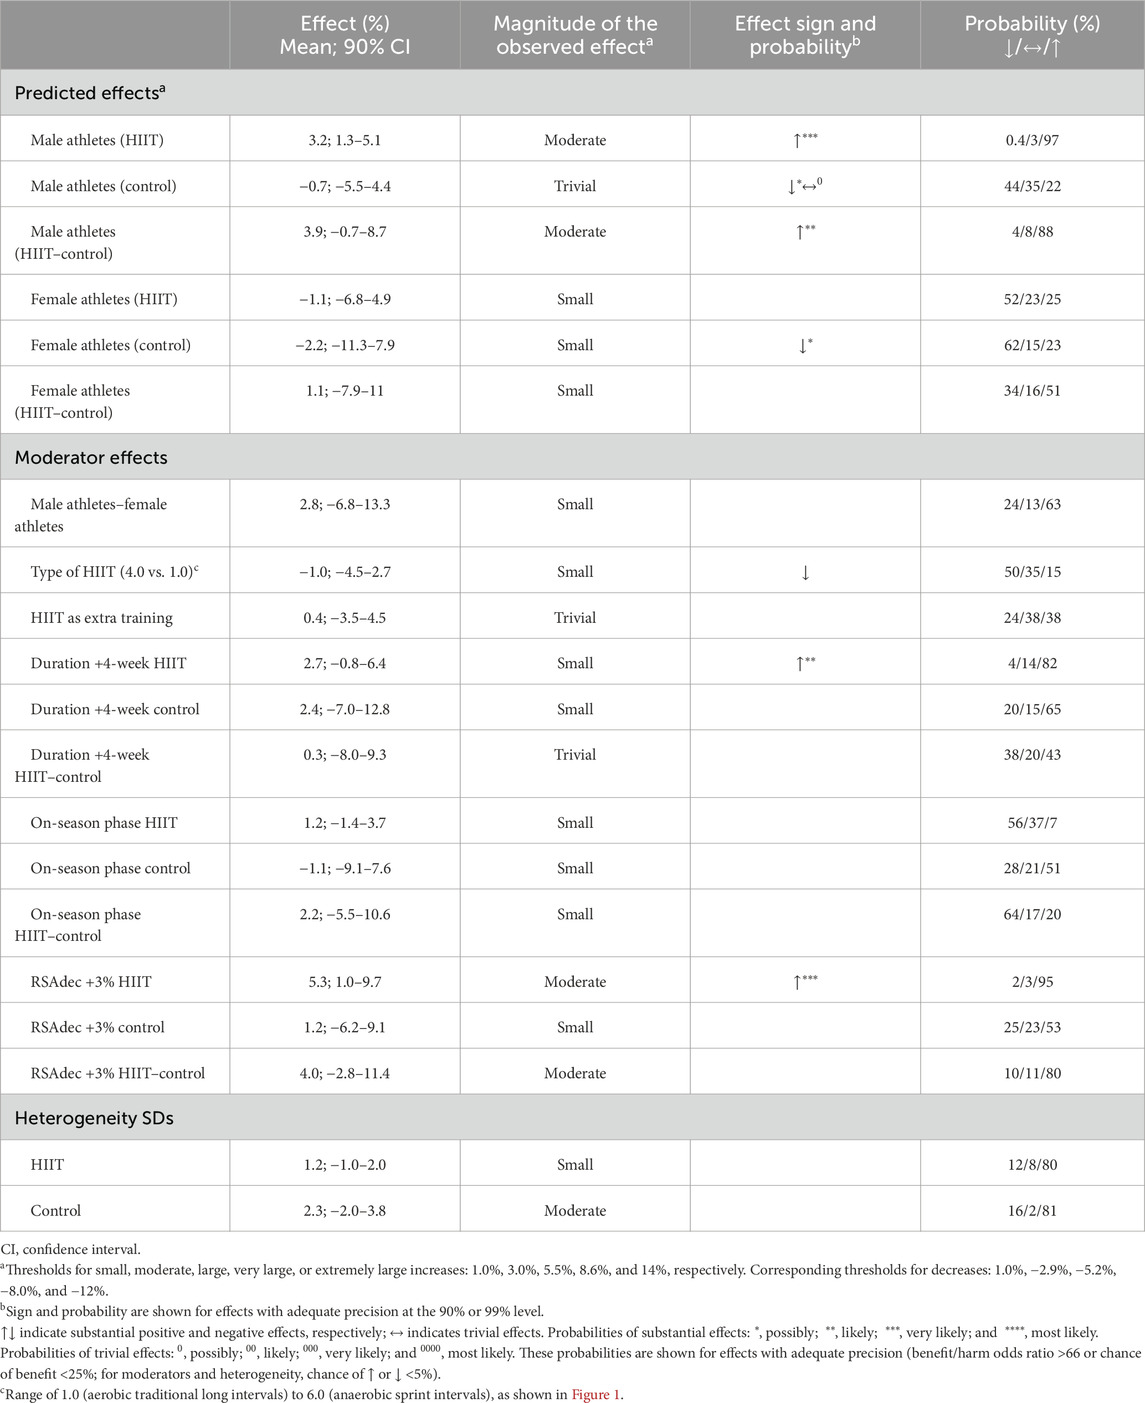
Table 5. Predicted effects, moderator effects, and heterogeneity SDs in the meta-analysis of re
留言 (0)