Diabetic kidney disease (DKD) is currently the leading cause of end-stage renal disease (ESRD) in the world and an important factor in increasing the risk of cardiovascular disease and all-cause mortality (Hussain et al., 2021; CDC, 2023). About 30%–40% of diabetic patients will develop kidney disease and approximately 50% of them will eventually progress to ESRD (Kato and Natarajan, 2019; Cheng et al., 2021). Once DKD reaches the end stage, renal function severely deteriorates, and treatment options are limited to kidney replacement therapies (Rao et al., 2019). It is reported that the annual expenditure for severe DKD patients is as high as $25,000, and even more for those combined with cardiovascular or cerebrovascular diseases (Wan et al., 2020). Moreover, DKD patients still have a threefold higher risk of all-cause mortality and a 16-year loss in life expectancy compared with the general population (Naaman and Bakris, 2023). DKD not only seriously threatens patients’ health, but also imposes a huge economic burden on society (Rodriguez et al., 2021; Vanholder et al., 2021). How to effectively control DKD has become an important public health issue.
The treatment measures for DKD mainly include lifestyle intervention, controlling risk factors and reducing urinary protein, which aims to delay the disease progression and decrease cardio-renal adverse events and mortality (Selby and Taal, 2020; Chinese Diabetes Society, 2021). Renin-angiotensin-aldosterone system (RAAS) inhibitors, such as angiotensin-converting enzyme inhibitors (ACEIs) or angiotensin II receptor blockers (ARBs), are recommended as the first-line drugs for early and mid-stage DKD due to their role in controlling blood pressure, lowering urinary protein, delaying renal function deterioration and reducing cardiovascular events risks (Chinese Diabetes Society, 2021; American Diabetes Association, 2024). In recent years, some novel hypoglycemic drugs, including sodium-glucose cotransporter-2 inhibitors and glucagon-like peptide-1 receptor agonists, have been found to improve cardiorenal outcomes, providing more options for the treatment of DKD (Heerspink et al., 2020; Wheeler et al., 2021; Herrington et al., 2023). Even though substantial efforts have been invested, the residual risk for disease progression persists (Yamazaki et al., 2021). The morbidity and mortality rates remain high, and the clinical prognosis is not optimistic (Thomas, 2019; Ricciardi and Gnudi, 2021). There is an urgent need to explore more suitable complementary therapies for treating DKD.
Ginkgo biloba L., one of the ancient living trees in the world, is native to China and has existed since the Carboniferous era for 345 million years (Shahrajabian et al., 2022). Recently, extracts derived from its dried leaves have gained much recognition and are commonly used in many countries as medicines or dietary supplements (Eisvand et al., 2020; Das et al., 2022). Ginkgo biloba L. leaves extract (GBE) contains more than one hundred chemical constituents such as flavonoids, terpene lactones, organic acids, amino acids and trace elements (Chinese Pharmacopoeia Commission, 2020; Liu et al., 2022). The standardized GBE is prepared according to the German EGb761 quality specification and contains 24% flavonoid glycosides and 6% terpene lactones (2.8%–3.4% ginkgolides A, B and C, and 2.6%–3.2% bilobalide), with ginkgolic acid content not exceeding 5 parts per million (Chinese Pharmacopoeia Commission, 2020; Kulić et al., 2022). GBE has demonstrated significant efficacy in treating cardiovascular, cerebrovascular, and neurological diseases by reducing oxidative stress, inhibiting inflammatory factors, regulating blood lipids, and antagonizing platelet activating factors (Singh et al., 2019; Tao et al., 2022).
The diverse components of GBE make it a multi-pathway and multi-targeted therapeutic feature, consistent with the treatment principles for DKD. Many clinical studies have commenced to assess the potential effects of GBE in treating DKD (Zhao et al., 2015; Sun, 2016; Li et al., 2020). However, there is still a lack of convincing evidence to support its use due to the inconsistent results among studies. This study collects the latest evidence and conducts a systematic review with a rigorous method, evaluating the efficacy and safety of GBE as a supplement to ACEI/ARB in treating DKD, and providing guidance for clinical application.
2 Materials and methods2.1 Study registrationThis study followed the guidelines outlined in the Preferred Reporting Items for Systematic Review and Meta-Analysis (PRISMA) guidelines (Page et al., 2021). The PRISMA checklist can be found in Supplementary Material S1. The protocol was registered in International Prospective Registry of Systematic Reviews (PROSPERO) as CRD42023455792.
2.2 Database searchesThe following databases were searched: PubMed, EMBASE, Cochrane Library, Web of Science (WOS), China National Knowledge Infrastructure (CNKI), Wan Fang Database, China Science and Technology Journal Database (VIP) and the China Biomedical Medicine database (CBM), from their inception until 21 July 2023. To identify clinical studies relevant to GBE and DKD, a comprehensive search strategy combining subject terms and text words was employed, mainly involving “Diabetic Nephropathies” “Diabetic Kidney Disease” “G. biloba extract” and “Ginkgo leaf extract”. Supplementary Material S2 shows the overall search strategies. To identify ongoing studies, the ClinicalTrials.gov database and CHiCTR were also searched. Furthermore, the references from related reviews and meta-analyses were screened to detect any possible missed literature during the online searches. The selection of literature was carried out based on pre-defined criteria.
2.3 Inclusion criteria2.3.1 Type of studiesRandomized controlled trials (RCTs) from any country or in any publication language.
2.3.2 Type of participantsAdults meeting any recognized diagnostic criteria for DKD were included, with both type 1 and type 2 diabetes being eligible.
2.3.3 Type of interventions and comparisonsStudies comparing GBE preparations combined with ACEI/ARB versus ACEI/ARB were included. No restrictions were placed on dosage form, dosage or duration. Other basic treatments in both groups were identical, which included dietary intervention, glycemic control, blood pressure management, lipid-lowering, maintaining electrolyte balance and other measures recommended by the guidelines.
2.3.4 Type of outcome measuresThe primary outcomes included kidney disease progression (starting renal replacement therapy, kidney disease-related death) and major adverse cardiovascular events (heart failure, myocardial infarction, cardiovascular death).
The secondary outcomes included: (1) renal function markers: urinary albumin excretion rate (UAER), serum creatinine (SCr), blood urea nitrogen (BUN), 24-h urinary total protein (24hUTP) and cystatin C (Cys-C); (2) glucose metabolism: fasting blood glucose (FBG), 2-h postprandial glucose (2hPG) and glycated hemoglobin (HbA1c); (3) lipid metabolism: total cholesterol (TC), triglyceride (TG) and low-density lipoprotein cholesterol (LDL-C); (4) blood pressure: diastolic blood pressure (DBP) and systolic blood pressure (SBP); (5) oxidative stress metrics: malondialdehyde (MDA), superoxide dismutase (SOD) and advanced oxidation protein product (AOPP); (6) inflammatory factors: high-sensitivity C-reactive protein (hs-CRP), interleukin-6 (IL-6) and tumor necrosis factor-α (TNF-α); (7) hemorheology indicators: hematocrit and fibrinogen.
The safety outcomes included any negative occurrences throughout the study, such as hypoglycemia, dry cough, elevated transaminases and allergies.
2.4 Exclusion criteria2.4.1 Type of studiesThe studies involving the following conditions were not included: (1) Non-RCTs; (2) Animal or cell experiments; (3) Meeting abstracts that did not provide relevant data; (4) Studies for which full text is not available; (5) For any duplicate studies, the earliest published one was selected.
2.4.2 Type of participantsPatients with the following disease states were excluded: (1) Patients with other kidney diseases, severe cardiovascular and cerebrovascular diseases, or malignant tumors; (2) Patients on dialysis were excluded; (3) Individuals experiencing acute metabolic disorders or infections.
2.4.3 Type of interventions and comparisonsThe following conditions were not considered: (1) Interventions involving non-pharmaceutical treatments, such as enemas, rehabilitation, nursing care or acupuncture; (2) Studies that used other herbal prescriptions or Chinese patent medicines that may affect the efficacy; (3) Literature with incomplete reporting on intervention characteristics, such as not reporting the dosage form, dose, frequency, name or duration of GBE or RAAS inhibitors.
2.4.4 Type of outcome measuresStudies with obvious errors, incomplete data, questionable authenticity, or lack of required indicators were excluded.
2.5 Study selection and data extractionThe EndNote X9 software was utilized to import the search results as a bibliography and create a database. After removing duplicate studies, two researchers (ZZH and TSY) independently screened the literature by reading titles and abstracts to exclude irrelevant literature. Next, the full texts of the remaining articles were reviewed to determine their inclusion. Any discrepancies were resolved through discussion with a third researcher (LSY). The pre-designed extraction table was used to extract data from included studies. If some required information was not provided, we contacted the author via email. The following key information was extracted for all studies: study ID, study period, sample size, gender, average age, Mogensen stage, treatment duration, interventions, outcomes, baseline levels, and country, and was cross-checked. Under the guidance of the Consensus statement on the Phytochemical Characterization of Medicinal Plant extracts (ConPhyMP) (Heinrich et al., 2022), we extracted and evaluated the information on GBE formulations to ensure study rigor and reliability. This evaluation included formulation name, source, botanical plant name, plant part used, harvest time, specifications, composition and concentrations, quality control, and chemical analysis. For the inconsistent unit expression of UAER in different studies, conversion was performed according to the following formula (Chavan et al., 2011):
UAER µg/min=UAER mg/24 hours×100024×60 2.6 Risk of bias assessmentThe Cochrane risk of bias tool was employed to evaluate the methodological quality of RCTs across seven domains: random sequence generation, allocation concealment, blinding of participants and personnel, blinding of outcome assessment, incomplete outcome data, selective reporting and other bias. The results were rated as “high risk”, “low risk” and “unclear risk” based on coverage for each domain, and were presented graphically. Two researchers (ZZH and TSY) independently conducted and cross-checked the assessments. If there was any disagreement, the third researcher (LSY) jointly discussed and determined the evaluation results.
2.7 Meta-analysisMeta-analysis was conducted by Review Manager 5.4 (https://training.cochrane.org/revman) and Stata 16.0 software (https://www.stata.com). The mean difference (MD), standardized mean difference (SMD), relative risk (RR) and 95% confidence interval (CI) were used to represent the effect sizes for binary variables and continuous variables respectively. The selection between MD and SMD depended on whether the metric was measured by the same method. Heterogeneity was evaluated using the χ2 test and the I2 test, and the appropriate effect model was selected based on the results. Specifically, when p > 0.10, I2<50%, a fixed effect model was employed to determine the combined effect size; otherwise, a random effect model was applied. According to the Cochrane Handbook, meta-regression is not recommended when fewer than ten studies are included (Cochrane Groups, 2023). Therefore, we conducted meta-regression and subgroup analysis for indicators with more than ten included studies to reduce the false-positive rate and ensure the reliability of results. These were done to investigate the reasons for heterogeneity and to identify factors influencing the efficacy. Sensitivity analysis was carried out to evaluate the robustness of the results by eliminating one study at a time. If the combined effect size did not change significantly, it indicated the results were relatively stable. To gauge publication bias, both funnel plot visualization and Egger’s test analysis were employed, ensuring a comprehensive examination of potential biases. The trim and fill method was employed to identify and correct potential publication bias. It was conducted by iteratively estimating the number of missing studies and recalculating the overall results. If the estimated value of the effect size did not change significantly, it indicated that the impact of publication bias was small and the results were relatively robust (Duval and Tweedie, 2000).
2.8 Subgroup analysis and meta-regressionThe analysis was conducted based on the following factors: average age (≤60 years old or >60 years old), GBE dosage form (injection or capsule), control preparation (ACEI or ARB) and sample size (<80 cases or ≥80 cases).
2.9 Evidence quality assessmentThe Grading of Recommendations Assessment, Development and Evaluation (GRADE) method is an internationally unified method for grading the evidence quality and recommendation strength. Two researchers (ZZH and TSY) independently assessed each outcome using GRADE, and disagreements were resolved through discussion with the third researcher (LSY). The evidence quality was graded as follows: high, moderate, low, and very low. Evidence based on RCTs was initially considered high quality and downgraded if there were risks in the following five domains: risk for bias, inconsistency, indirectness, imprecision and publication bias. GRADE Profiler software (https://www.gradepro.org) was utilized for this process.
3 Results3.1 Database search resultsA total of 1,653 articles was obtained by database searches. After eliminating duplicates, 1,057 articles were excluded. Among the remaining 596 articles, 458 were deemed ineligible based on title and abstract screening. Following a thorough examination of the full text on the remaining 138 articles, 97 were excluded based on predefined criteria. No further studies meeting the criteria were discovered through the review of relevant reviews and meta-analyses. Eventually, 41 articles were enrolled. The literature that did not meet the criteria after reviewing the full texts, along with the reasons for exclusion, can be found in Supplementary Material S3. A detailed flowchart for the screening process is presented in Figure 1.
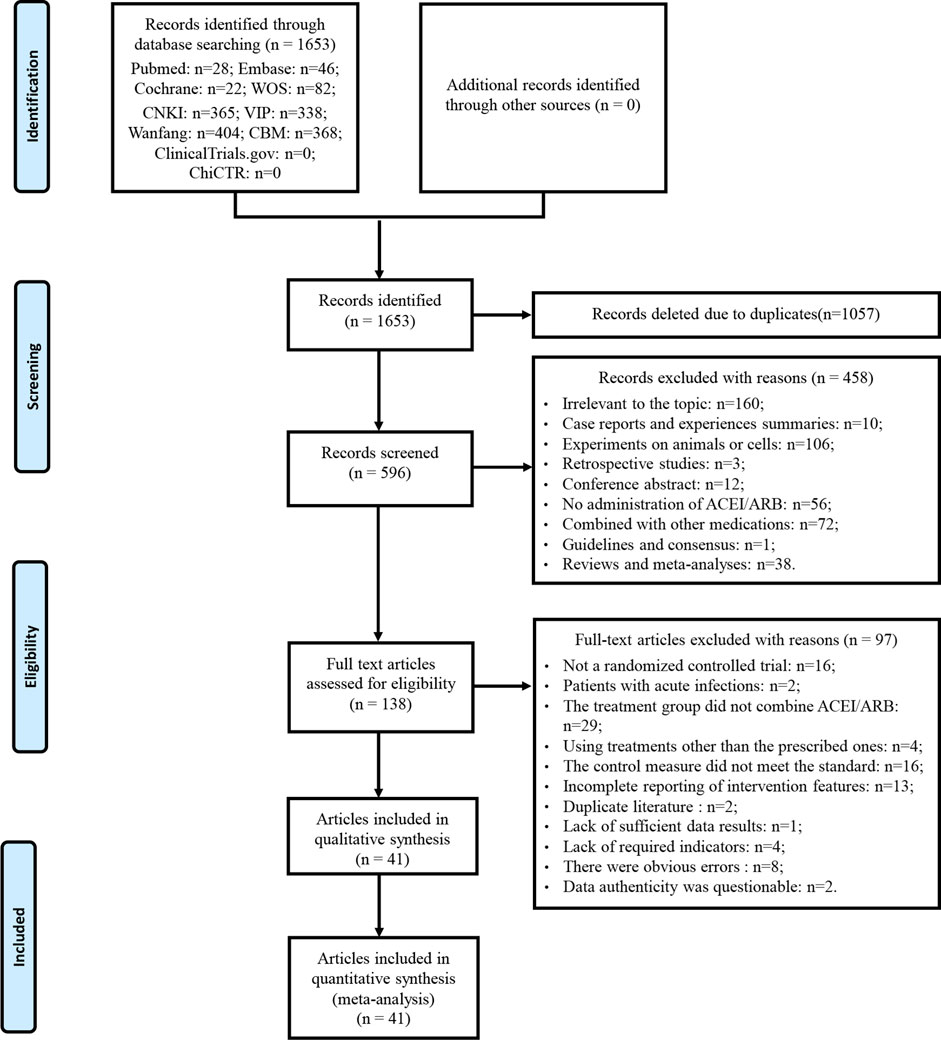
Figure 1. Flowchart of study selection and identification.
3.2 Characteristics of included studiesThis study involved 41 RCTs, all conducted in China and published between 2006 and 2022 (Table 1). A total of 3,269 DKD patients were enrolled, with 1,658 in the treatment group and 1,611 in the control group, about 54% of whom were male. Each included study had sample sizes varying from 24 to 236 cases, with average age ranging from 41.77 to 66.70 years and treatment durations ranging from 2 to 24 weeks. GBE was administered intravenously in the form of injections in 39 studies (Fu and Jia, 2006; Yang et al., 2007; Han, 2008; Liang, 2008; Xiao, 2008; Li, 2009; Pan et al., 2009; Sun et al., 2009; Zhang H. S. et al., 2009; Zhang X. G. et al., 2009; Chen et al., 2010; Chu, 2010; Li, 2010; Shi, 2010; Wang et al., 2010; Wu et al., 2010; Xu et al., 2010; Xi, 2011; Zou and Zhang, 2011; Huang, 2012; Wen et al., 2012; Xu et al., 2012; Zhen and Feng, 2012; Li, 2013; Mao et al., 2013; Tang et al., 2013; Zhang et al., 2013; Jiang et al., 2014; Li, 2014; Zhang et al., 2014; Guo and Xu, 2015; Zhang, 2015; Hu et al., 2016; Huang et al., 2017; Shen, 2017; Wu et al., 2017; Cheng et al., 2018; Zhu et al., 2020; Xing, 2022) and orally in the form of capsules or tablets in two studies (Mao et al., 2010; Hu, 2019). For the control preparations, 16 studies used ACEI (Yang et al., 2007; Han, 2008; Liang, 2008; Li, 2009; Sun et al., 2009; Zhang H. S. et al., 2009; Shi, 2010; Wu et al., 2010; Xi, 2011; Tang et al., 2013; Jiang et al., 2014; Zhang et al., 2014; Hu et al., 2016; Shen, 2017; Wu et al., 2017; Hu, 2019) and 25 studies used ARB (Fu and Jia, 2006; Xiao, 2008; Pan et al., 2009; Zhang X. G. et al., 2009; Chen et al., 2010; Chu, 2010; Li, 2010; Mao et al., 2010; Wang et al., 2010; Xu et al., 2010; Zou and Zhang, 2011; Huang, 2012; Wen et al., 2012; Xu et al., 2012; Zhen and Feng, 2012; Li, 2013; Mao et al., 2013; Zhang et al., 2013; Li, 2014; Guo and Xu, 2015; Zhang, 2015; Huang et al., 2017; Cheng et al., 2018; Zhu et al., 2020; Xing, 2022). According to the ConPhyMP statement, the GBE formulations used in the included studies were all “type A″ extracts. These formulations were registered and approved by the National Medical Products Administration (NMPA) of China and manufactured by reputable, publicly listed pharmaceutical companies within the country. The preparations were produced in accordance with the quality control standards specified in the Chinese Pharmacopoeia and those promulgated by NMPA. Detailed evaluation information on the GBE formulations was provided in Supplementary Material S4.

Table 1. The characteristics of the included studies.
3.3 Risk of bias assessmentAmong the included studies, nine studies used a random number table (Zhang H. S. et al., 2009; Chu, 2010; Tang et al., 2013; Zhang et al., 2013; Huang et al., 2017; Wu et al., 2017; Cheng et al., 2018; Zhu et al., 2020; Xing, 2022) and one study utilized a computer-generated random sequence (Li, 2014), which were considered to be low risk. Other studies did not specify the methods used, and these were rated as unclear risk. Additionally, none of the studies provided details regarding allocation concealment, resulting in an assessment of unclear risk in this aspect. None of the studies used placebo to blind participants and researchers; therefore, all were rated as high risk. All studies assessed objective indicators, so although none reported whether the outcome assessors were blinded, the assessment of results was not affected, and all were rated as low risk for detection bias. In one study (Mao et al., 2010), both groups exhibited similar amounts of missing data, with similar reasons for their absence, and the others showed no cases of incomplete data, contributing to a low-risk rating for all included studies. Since no studies were registered, we were unable to obtain the study protocols to determine whether there was selective reporting, so all were rated as unclear risk. No additional significant biases were identified and all studies were considered to be low risk for other biases (Figure 2).

Figure 2. Risk of bias assessment for included studies: (A) Risk of bias graph; (B) Risk of bias summary.
3.4 Primary outcomesNone of the included studies reported whether renal or cardiovascular disease progression events occurred during treatment or follow-up.
3.5 Secondary outcomes3.5.1 Effect on renal function markers3.5.1.1 UAERThirty studies involving 2,417 participants compared GBE plus ACEI/ARB with ACEI/ARB. A random effect model was utilized following the heterogeneity test (p < 0.01, I2 = 96%). The pooled result indicated that the addition of GBE to ACEI/ARB led to a statistically significant reduction in UAER compared to ACEI/ARB alone (MD = −22.99 μg/min, 95%CI: −27.66 to −18.31, p < 0.01) (Figure 3A). Meta-regression was conducted to investigate potential factors contributing to the observed heterogeneity. Generally, the average age (p = 0.56, Adj R2 = −2.87%), GBE dosage form (p = 0.80, Adj R2 = −5.21%), control preparation (p = 0.09, Adj R2 = 8.20%) and the sample size (p = 0.85, Adj R2 = −4.70%) could not explain the heterogeneity for UAER (Supplementary Material S5). Sensitivity analysis revealed consistent pooled effect sizes, indicating the robustness of the findings (Figure 4A; Supplementary Material S7).
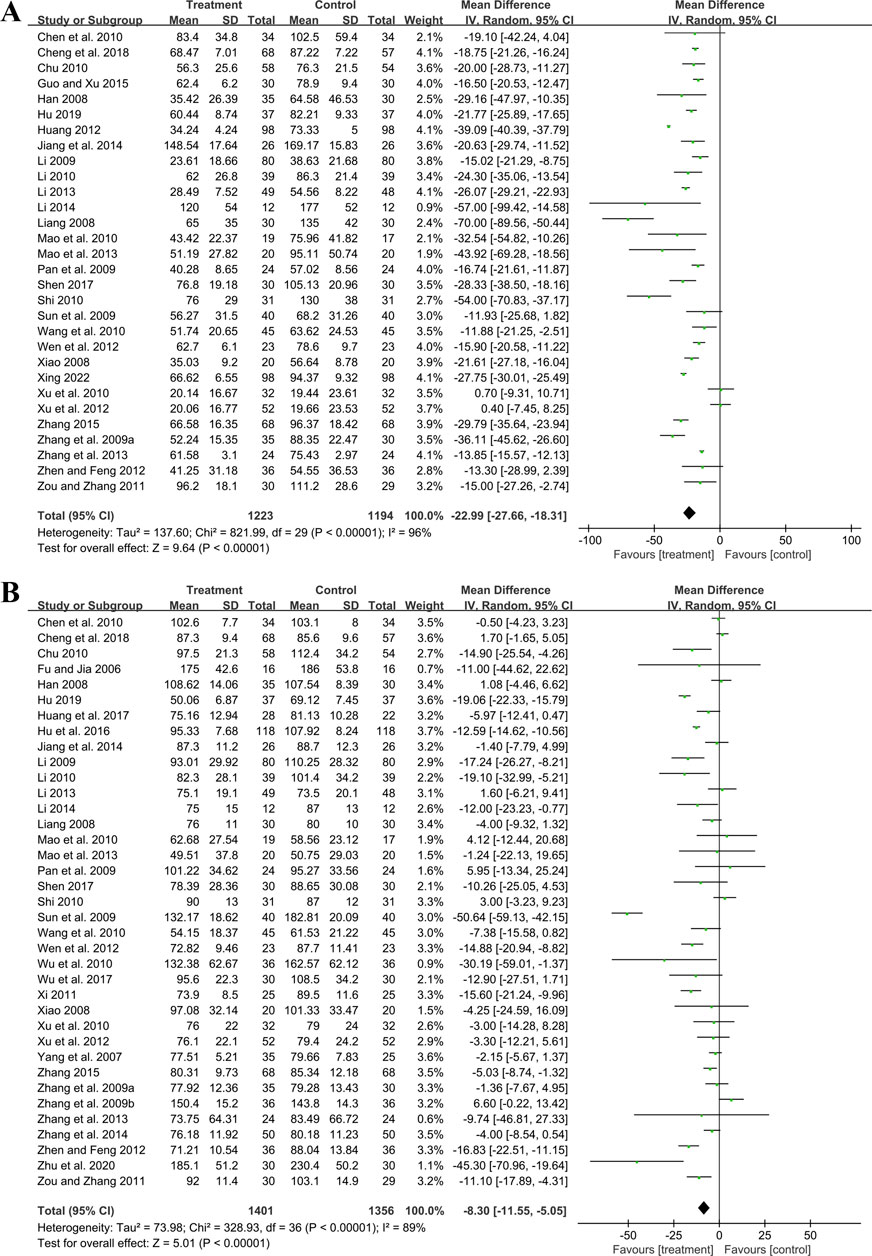
Figure 3. Forest plot of (A) UAER and (B) Scr.
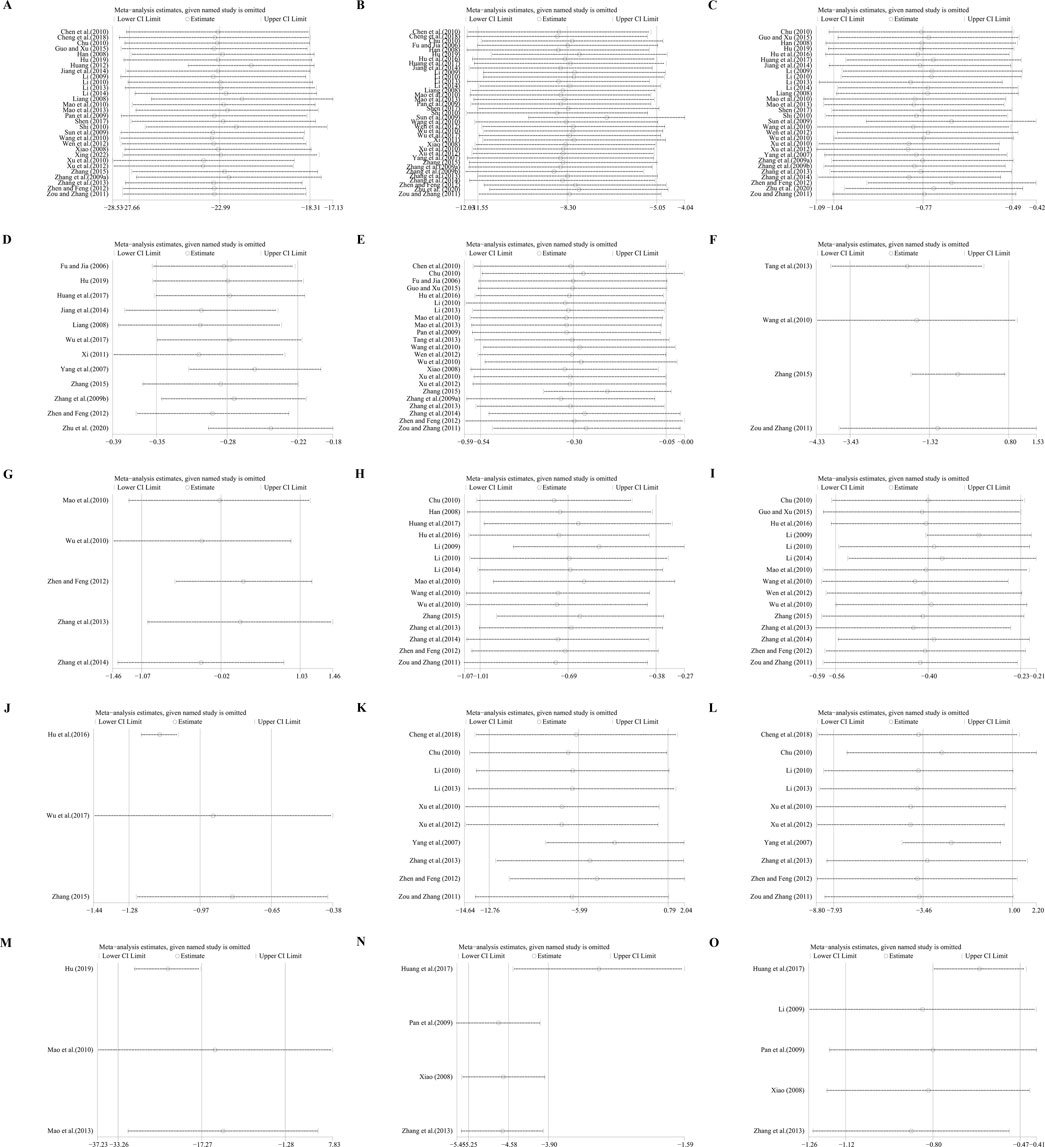
Figure 4. Sensitivity analysis: (A) UAER; (B) Scr; (C) BUN; (D) 24hUTP; (E) FBG; (F) 2hPG; (G) HbA1c; (H) TC; (I) TG; (J) LDL-C; (K) SBP; (L) DBP; (M) IL-6; (N) hematocrit; (O) fibrinogen.
3.5.1.2 ScrThirty-seven trials involving 2,757 participants assessed the efficacy of GBE plus ACEI/ARB with ACEI/ARB. A random effect model was selected to synthesize original data following the heterogeneity test (p < 0.01, I2 = 89%). Comparing ACEI/ARB, the meta-analysis indicated that GBE in combination with ACEI/ARB could reduce Scr level (MD = −8.30 μmol/L, 95%CI: −11.55 to −5.05, p < 0.01) (Figure 3B). Meta-regression showed that average age (p = 0.32, Adj R2 = −1.16%), GBE dosage form (p = 0.82, Adj R2 = −3.01%), control preparation (p = 0.42, Adj R2 = −1.73%) and the sample size (p = 0.62, Adj R2 = −3.29%) could not explain the heterogeneity for Scr (Supplementary Material S5). Sensitivity analysis demonstrated consistent pooled effect sizes, indicating the robustness of the outcome (Figure 4B; Supplementary Material S7).
3.5.1.3 BUNThirty studies including 2,258 patients evaluated BUN levels. A random effect model was utilized following the heterogeneity test (p < 0.01, I2 = 88%). The result revealed a significant reduction in BUN with the combined use of GBE and ACEI/ARB (MD = −0.77 mmol/L, 95%CI: −1.04 to −0.49, p < 0.01) (Figure 5A). Meta-regression according to average age (p = 0.79, Adj R2 = −5.70%), GBE dosage form (p = 0.54, Adj R2 = −4.03%), control preparation (p = 0.87, Adj R2 = −4.82%) and sample size (p = 0.58, Adj R2 = −3.59%) showed no difference (Supplementary Material S5), which means none of these factors appeared to be the source of heterogeneity. Sensitivity analysis revealed a stable outcome, with similar pooled effect sizes (Figure 4C; Supplementary Material S7).
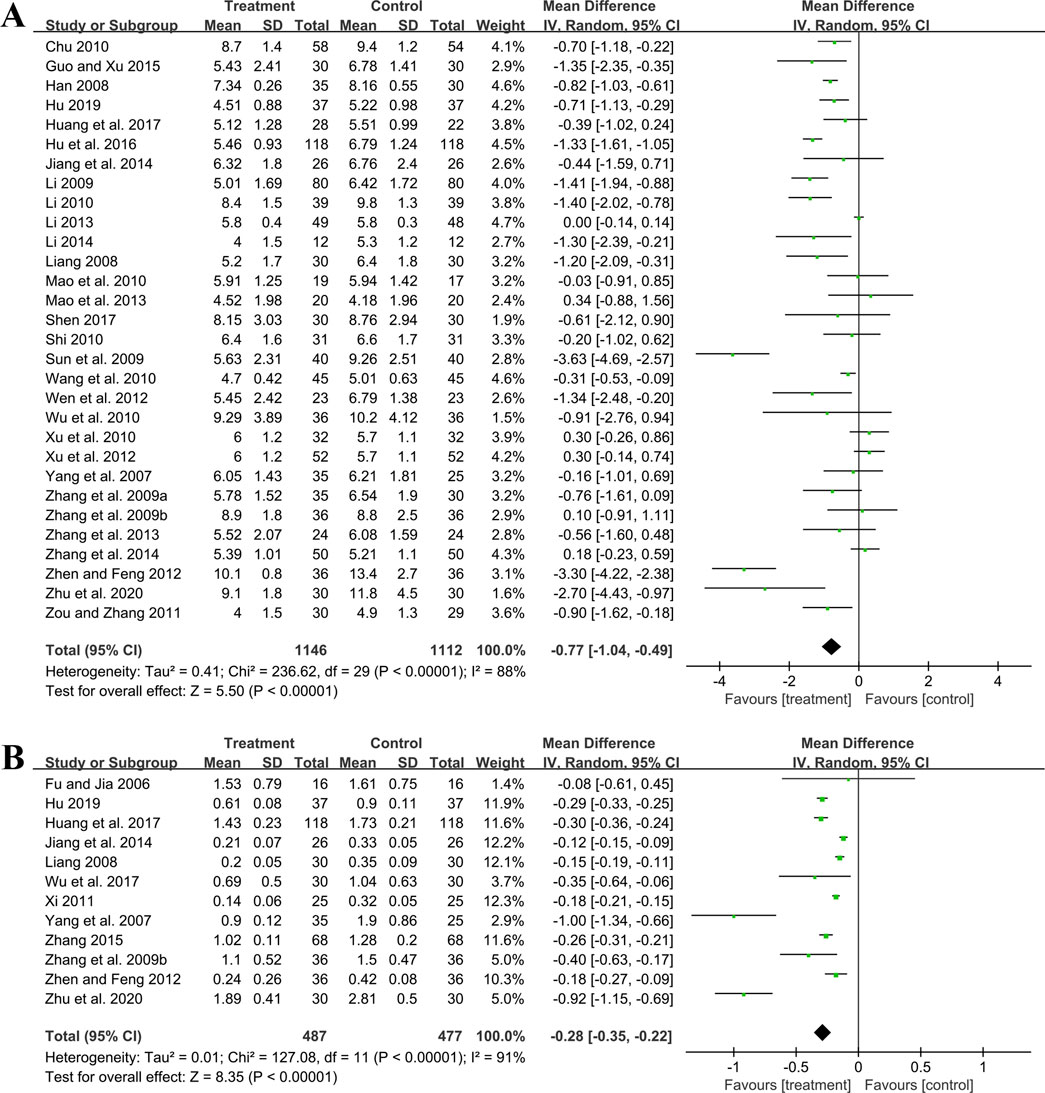
Figure 5. Forest plot of (A) BUN and (B) 24hUTP.
3.5.1.4 24hUTPTwelve studies including 964 patients evaluated 24hUTP outcomes. A random effect model was employed following the heterogeneity test (p < 0.01, I2 = 91%). Meta-analysis indicated that the combination of GBE with ACEI/ARB could significantly decrease 24hUTP compared to the control group (MD = −0.28 g/d, 95%CI: −0.35 to −0.22, p < 0.01) (Figure 5B). Meta-regression examining average age (p = 0.44, Adj R2 = −4.91%), GBE dosage form (p = 0.86, Adj R2 = −16.23%), control preparation (p = 0.76, Adj R2 = −11.15%) and sample size (p = 0.88, Adj R2 = −15.77%) did not identify factor to explain heterogeneity (Supplementary Material S5). Sensitivity analysis revealed a stable outcome, with similar pooled effect sizes (Figure 4D; Supplementary Material S7).
3.5.1.5 Cys-COne study (Shen, 2017) including 60 patients reported that, in comparison to ACEI/ARB alone, the addition of GBE led to a further reduction in Cys-C levels after 3 weeks of treatment (MD = −0.30 mg/L, 95%CI: −0.43 to −0.17, p < 0.01).
3.5.2 Effect on glucose metabolism3.5.2.1 FBGTwenty-three trials involving 1,577 patients assessed the efficacy of FBG. A random effect model was utilized following the heterogeneity test (p < 0.01, I2 = 87%). As shown by the pooled result, the combined therapy was more effective in reducing FBG (MD = −0.30 mmol/L, 95%CI: −0.54 to −0.05, p = 0.02) (Figure 6A). Meta-regression based on average age, GBE dosage form, control preparation and sample size was conducted to investigate potential factors contributing to the observed heterogeneity. Based on the meta-regression of sample size, scatters exhibited a linear pattern, with Tau2 decreasing from 0.240 to 0.142. This indicated that sample size may be the source of heterogeneity, with it accounting for 53.77% of the variability among study points (p < 0.01, Adj R2 = 53.77%) (Supplementary Material S5). Regression bubble plots showed that the difference in efficacy between groups increased with the study sample size (Supplementary Material S5). We further conducted subgroup analysis and found that when the sample size was ≤80 cases, there was no significant difference between the two groups (MD = −0.08 mmol/L, 95%CI: −0.21 to 0.06, p = 0.26). On the contrary, when the sample size was >80 cases, the combined treatment group had better efficacy in reducing FBG (MD = −0.73 mmol/L, 95%CI: −1.33 to −0.13, p < 0.01) (Supplementary Material S6). We considered the reason might be that the increased sample size reduced sampling error, improved statistical power and detected minor effects. Additionally, the average age (p = 0.18, Adj R2 = 8.40%), GBE dosage form (p = 0.56, Adj R2 = −3.62%) and control preparation (p = 0.96, Adj R2 = −6.17%) exhibited no difference (Supplementary Material S5). Sensitivity analysis revealed a relatively stable outcome, with consistent pooled effect sizes (Figure 4E; Supplementary Material S7).
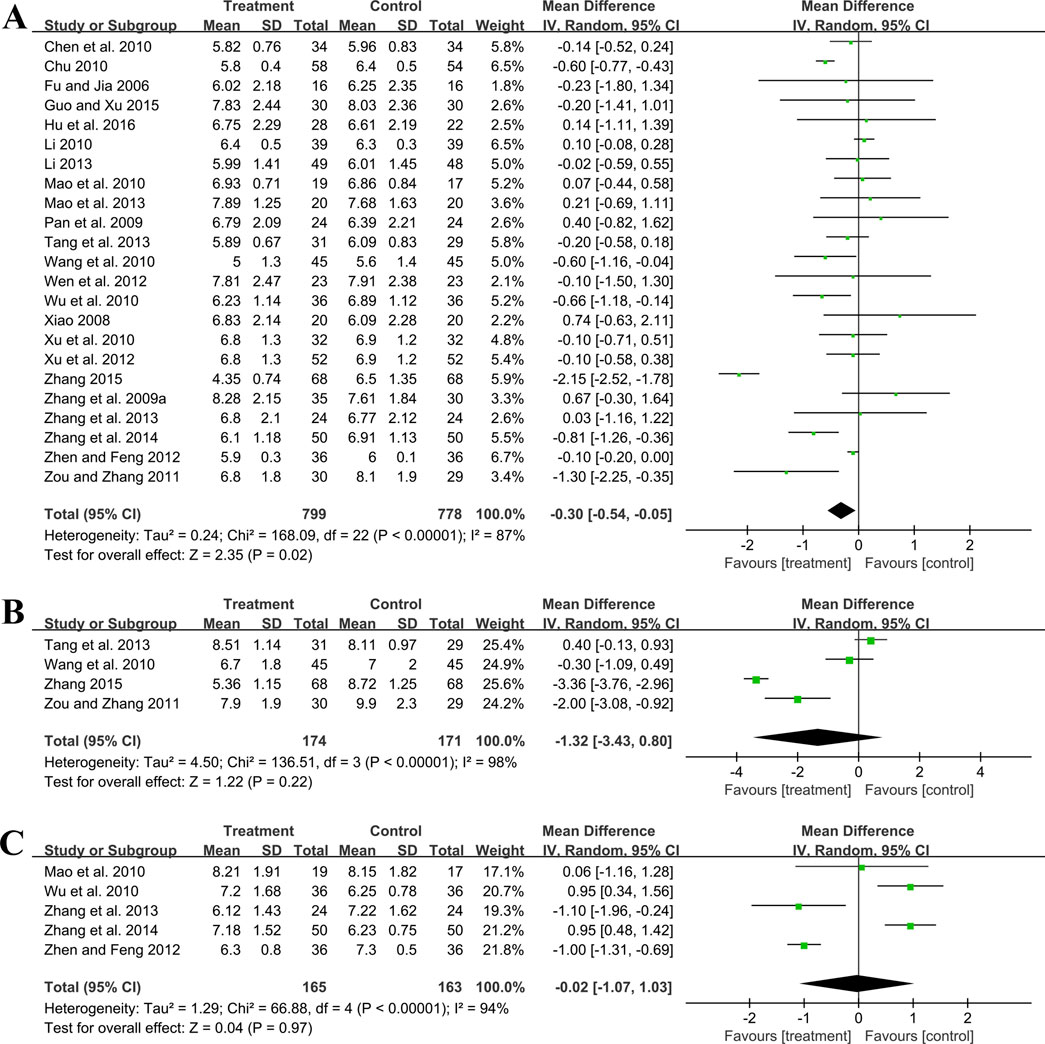
Figure 6. Forest plot of glucose metabolism outcomes: (A) FBG; (B) 2hPG; (C) HbA1c.
3.5.2.2 2hPGFour trials involving 345 participants evaluated 2hPG outcomes. A random effect model was selected to synthesize original data following the heterogeneity test (p < 0.01, I2 = 98%). The pooled effect indicated no difference between groups (MD = −1.32 mmol/L, 95%CI: −3.43 to 0.80, p = 0.22) (Figure 6B). Sensitivity analysis showed consistent pooled effect sizes, indicating the robustness of the outcome (Figure 4F; Supplementary Material S7).
3.5.2.3 HbA1cFive studies including 328 patients evaluated HbA1c levels. A random effect model was utilized following the heterogeneity test (p < 0.01, I2 = 94%). The pooled effect indicated no difference between groups (MD = −0.02%, 95%CI: −1.07 to 1.03, p = 0.97) (Figure 6C). Sensitivity analysis showed that no matter which study was excluded, the effect size was not statistically significant, meaning the results were robust (Figure 4G; Supplementary Material S7).
3.5.3 Effect on lipid metabolism3.5.3.1 TCFifteen studies including 1,338 patients reported TC levels. A random effect model was selected to synthesize original data following the heterogeneity test (p < 0.01, I2 = 96%). The pooled effect revealed that GBE combined with ACEI/ARB reduced TC more than ACEI/ARB (MD = −0.69 mmol/L, 95%CI: −1.01 to −0.38, p < 0.01) (Figure 7A). Meta-regression based on average age (p = 0.65, Adj R2 = −8.02%), GBE dosage form (p = 0.20, Adj R2 = 5.63%), control preparation (p = 0.74, Adj R2 = −8.43%) and sample size (p = 0.15, Adj R2 = 10.67%) did not find the factor to explain the heterogeneity (Supplementary Material S5). Sensitivity analysis suggests robustness in the result (Figure 4H; Supplementary Material S7).

Figure 7. Forest plot of lipid metabolism outcomes: (A) TC; (B) TG; (C) LDL-C.
3.5.3.2 TGFifteen studies including 1,143 patients evaluated TG levels. A random effect model was used to synthesize original data following the heterogeneity test (p < 0.01, I2 = 85%). The pooled result indicated that the combination therapy was more beneficial (MD = −0.40 mmol/L, 95%CI: −0.56 to −0.23, p < 0.01) (Figure 7B). The meta-regression on control preparation revealed a decrease in Tau2 from 0.070 to 0.009, implying that control preparation might account for the heterogeneity and interpret 78.91% of the variation among studies (p < 0.01, Adj R2 = 78.91%) (Supplementary Material S5). Interestingly, the regression scatter plot indicated that the combination of GBE with ACEI was superior in lowering TG compared to its combination with ARB. Similar to the meta-regression, the subgroup analysis of control preparation exhibited a significant difference between subgroups (p < 0.01), with reduced heterogeneity within each group (I2 = 38% and 44%, respectively), suggesting that control preparation might be accountable for the heterogeneity (Supplementary Material S6). Additionally, the average age (p = 0.80, Adj R2 = −13.59%), GBE dosage form (p = 0.92, Adj R2 = −11.70%) and sample size (p = 0.15, Adj R2 = 18.56%) exhibited no difference (Supplementary Material S5). Sensitivity analysis indicated that the result remained consistent, suggesting its robustness (Figure 4I; Supplementary Material S7).
3.5.3.3 LDL-CThree trials involving 246 participants reported LDL-C levels. A random effect model was utilized following the heterogeneity test (p = 0.02, I2 = 76%). The pooled result indicated that the addition of GBE to ACEI/ARB led to a greater decrease in LDL-C (MD = −0.97 mmol/L, 95%CI: −1.28 to −0.65, p < 0.01) (Figure 7C). After excluding the study (Hu et al., 2016), the I2 changed from 76% to 0%, which means that this seems to be a source of heterogeneity. This study used lipid-lowering drugs to control blood lipids at a stable level during the lead-in period. Therefore, when GBE was added, the reduction in LDL-C was less than that of the other two studies, resulting in heterogeneity after the merger. Sensitivity analysis indicated that the effect size was statistically significant regardless of which study was excluded, suggesting the robustness of the result (Figure 4J; Supplementary Material S7).
3.5.4 Effect on blood pressure3.5.4.1 SBPTen studies including 819 patients evaluated SBP. A random effect model was employed following the heterogeneity test (p < 0.01, I2 = 96%). The pooled result showed no statistical significance between two groups (MD = −5.99 mmHg, 95%CI: −12.76 to 0.79, p = 0.08) (Figure 8A). Subgroup analysis based on control preparation and sample size did not identify the factors that could account for the heterogeneity (Supplementary Material S6). Sensitivity analysis revealed a stable outcome, with similar pooled effect sizes (Figure 4K; Supplementary Material S7).
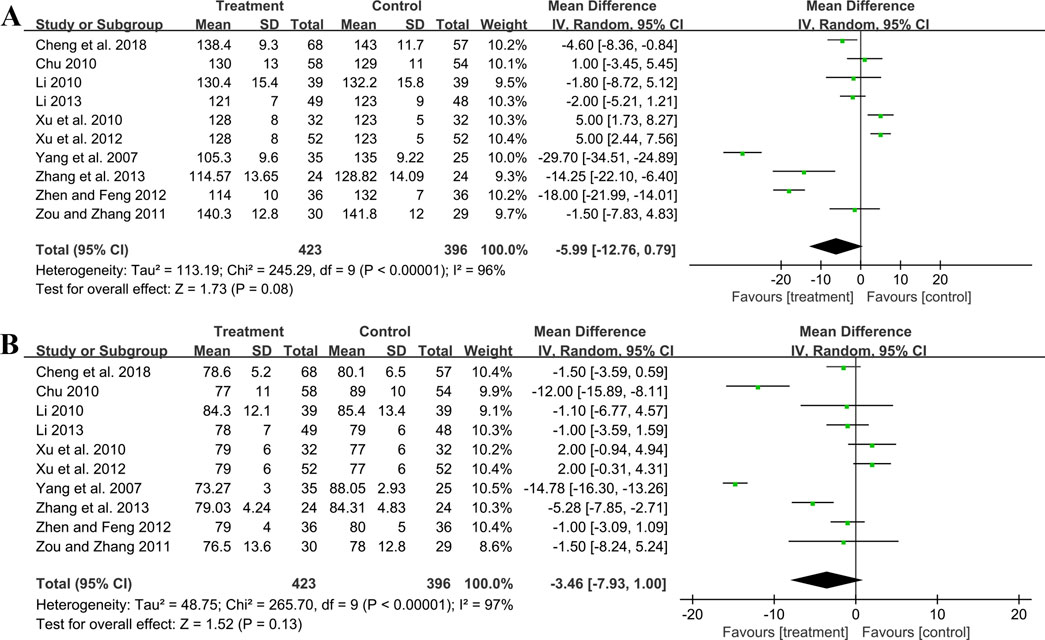
Figure 8. Forest plot of blood pressure outcomes: (A) SBP; (B) DBP.
3.5.4.2 DBPTen studies including 819 patients reported DBP. A random effect model was employed following the heterogeneity test (p < 0.01, I2 = 97%). The result indicated that the effect of GBE combined with ACEI/ARB on DBP was not statistically significant compared with ACEI/ARB (MD = −3.46 mmHg, 95%CI: −7.93 to 1.00, p = 0.13) (Figure 8B). Sensitivity analysis revealed a relatively stable outcome, with consistent pooled effect sizes (Figure 4L; Supplementary Material S7).
3.5.5 Effect on oxidative stress3.5.5.1 MDATwo trials including 321 patients evaluated MDA levels. Both studies suggested that the addition of GBE to ACEI/ARB was better in lowering MDA. However, after merging these studies into the meta-analysis, we got opposite results (SMD = −6.94, 95%CI: −14.43 to 0.54, p = 0.07) (Figure 9A). This was due to the use of a random effect model to account for high heterogeneity (p < 0.01, I2 = 99%). Since the result of one study (Cheng et al., 2018) was much better than another (Huang, 2012), there was a lack of overlap in the effect size intervals between them, resulting in high heterogeneity. On the contrary, if we used a fixed effect model, we can get a positive result. Therefore, the effect of GBE combined with ACEI/ARB on MDA remains uncertain, and further rigorous research is needed to explore this.

Figure 9. Forest plot of oxidative stress outcomes: (A) MDA; (B) SOD; (C) AOPP.
3.5.5.2 SODTwo studies involving 321 patients provided data on SOD. According to the heterogeneity test (p < 0.01, I2 = 91%), the random effect model was applied. The pooled result showed that combination treatment significantly improved SOD than ACEI/ARB (MD = 18.71 U/mL, 95%CI: 14.63 to 22.80, p < 0.01) (Figure 9B). The result remained similar when changing to a fixed effect model, indicating its robustness (Supplementary Material S7).
3.5.5.3 AOPPTwo studies including 321 patients evaluated AOPP. According to the heterogeneity test (p < 0.01, I2 = 95%), the random effect model was used. The pooled result showed that GBE combined with ACEI/ARB could significantly reduce the AOPP level compared to the control group (SMD = −5.92, 95%CI: −8.19 to −3.65, p < 0.01) (Figure 9C). The heterogeneity could be associated with variations in AOPP baseline levels between study points, as well as the potential measurement bias arising from different detection methods. The result remained similar when changing to a fixed effect model, indicating its robustness (Supplementary Material S7).
3.5.6 Effect on inflammatory factors3.5.6.1 hs-CRPTwo studies including 134 patients reported hs-CRP outcomes. A fixed effect model was used to synthesize the original data following the heterogeneity test (p = 0.88, I2 = 0%). The pooled effect indicated that the combination of GBE with ACEI/ARB was superior to ACEI/ARB alone in reducing hs-CRP levels (MD = −1.50 mg/L, 95%CI: −1.82 to −1.18, p < 0.01) (Figure 10A). The result remained statistically significant after transitioning the effect model, implying its robustness (Supplementary Material S7).
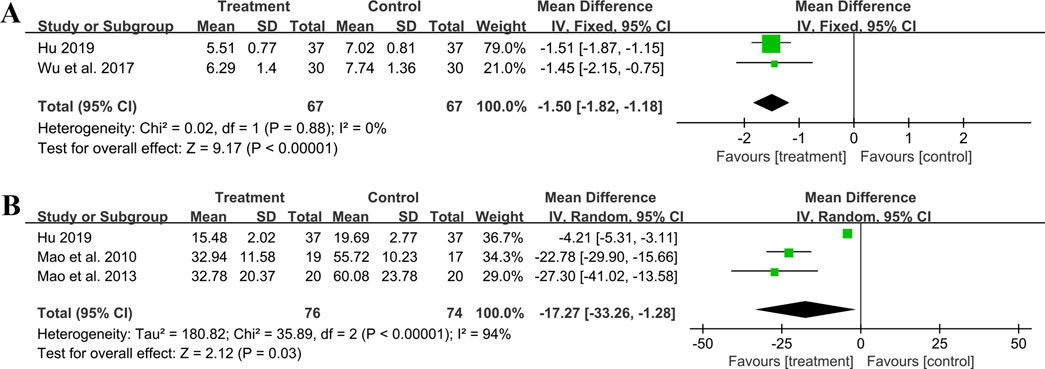
Figure 10. Forest plot of inflammatory factors: (A) hs-CRP; (B) IL-6.
3.5.6.2 IL-6Three studies including 150 patients evaluated IL-6 levels. According to the heterogeneity test (p < 0.01, I2 = 94%), the random effect model was used. The meta-analysis showed that combination treatment was better than ACEI/ARB in reducing IL-6 (MD = −17.27 ng/L, 95%CI: −33.26 to −1.28, p = 0.03) (Figure 10B). Sensitivity analysis found that after excluding Mao et al., 2010 or Mao et al., 2013, the combined findings exhibited a reversal and had no statistical significance, meaning the results were not robust (Figure 4M; Supplementary Material S7). This might be attributed to the literature (Hu, 2019), which showed a weaker efficacy. It carries a large weight in the pooled results, causing the upper confidence interval tending toward the null line. After excluding Mao et al., 2010 or Mao et al., 2013, the result’s weight of Hu, 2019 becomes even more prominent, leading to an exceeding of the null line. Additionally, the use of a random effect model makes the results more conservative. Given that all three studies have suggested positive results, we are optimistic about the effect of combination treatment on IL-6, but more rigorous trials are still needed to verify this.
3.5.6.3 TNF-αOne study (Mao et al., 2010) including 36 patients reported that the combination treatment resulted in a greater reduction in TNF-α levels compared to ACEI/ARB alone following 6 months of treatment (MD = −25.95 ng/L, 95%CI: −34.64 to −17.26, p < 0.01).
3.5.7 Effect on hemorheology indicators3.5.7.1 HematocritFour trials involving 372 individuals assessed the hematocrit outcome. A fixed effect model was used to synthesize original data following the heterogeneity test (p = 0.13, I2 = 46%). The pooled result indicated a greater reduction on hematocrit for combined therapy compared to ACEI/ARB alone (MD = −4.58%, 95%CI: −5.25 to −3.90, p < 0.01) (Figure 11A). Sensitivity analysis revealed a relatively stable outcome, with consistent pooled effect sizes (Figure 4N, Supplementary Material S7).
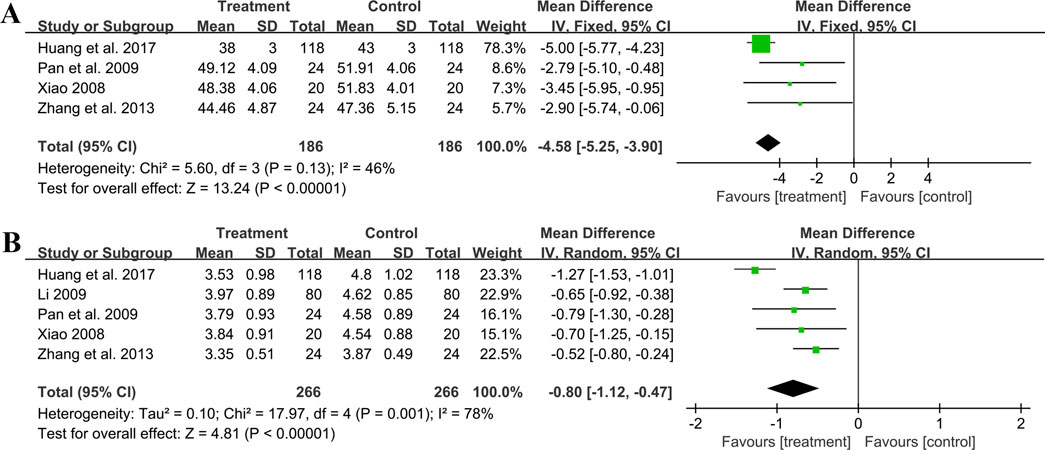
Figure 11. Forest plot of hemorheology indicators: (A) hematocrit; (B) fibrinogen.
3.5.7.2 FibrinogenFive studies including 532 patients reported the fibrinogen level. A random effect model was used to synthesize original data following the heterogeneity test (p < 0.01, I2 = 78%). The result suggested that combination treatment was superior to ACEI/ARB alone in lowering fibrinogen levels (MD = −0.80 g/L, 95%CI: −1.12 to −0.47, p < 0.01) (Figure 11B). After excluding the study (Huang et al., 2017), the I2 changed from 78% to 0%, implying that this literature may be a source of heterogeneity. This study had a longer treatment duration than the other studies, demonstrating a better efficacy. And no matter which study was excluded, the pooled effect size remained statistically significant, suggesting a relatively stable result (Figure 4O, Supplementary Material S7).
3.6 Safety outcomesA total of ten studies reported adverse events. Among them, nine studies reported the number of adverse events occurring in each group (Pan et al., 2009; Chu, 2010; Li, 2010; Xu et al., 2010; Xu et al., 2012; Zhang et al., 2013; Huang et al., 2017; Hu, 2019; Xing, 2022). The occurrence of adverse events in the two groups was 18/482 and 22/478 respectively, and meta-analysis indicated no significant difference (RR = 0.82, 95%CI: 0.46 to 1.48, p = 0.52) (Figure 12). Another study (Xiao, 2008) reported the sum adverse events of two groups, with three cases of mild cough and no other adverse events observed. As shown in Table 2, the most common adverse event was dizziness, and other adverse events such as skin rash, nausea and vomiting, dry cough, headache and lower limb soreness were also reported. In addition, a study (Xing, 2022) reported that one dyspnea occurred in the treatment group and one laryngeal edema in the control group, which were both rare and severe adverse events. No deaths were reported in these studies.
留言 (0)