VM is one of the most common disorders with episodic vestibular syndrome in clinical practice, predominantly affecting young to middle-aged women. It is primarily characterized by moderate to severe dizziness or vertigo, with or without unilateral pulsating headache, photophobia, phonophobia, and visual aura. Headache is not specific to VM, as patients may never experience it. However, when it does occur, it can be before, after, or even during the vestibular symptoms (Lampl et al., 2019). In addition to the typical dizziness and headache symptoms, there are some accompanying symptoms such as brain fog and difficulty finding words (Beh et al., 2019). In recent years, numerous studies have found that VM patients experience cognitive dysfunction, involving various aspects like attention, memory, visuospatial function, language function, etc (Balci et al., 2018; Preysner et al., 2022; Wang et al., 2016). It was also found that the cognitive dysfunction in VM patients are related to the duration of the disease and the frequency and the severity of symptom (Lu et al., 2024). But it was neglected because of the youthful onset and mild dysfunction of cognitive (Çelebisoy et al., 2022). The recurrent symptoms of dizziness and headache have already influenced the efficiency of work and daily life for the patients (Molnár et al., 2022). The appearance of cognitive dysfunction symptoms further exacerbates this suffering. Therefore we should pay attention to this issue, which is to identify VM-related cognitive dysfunction early and take appropriate measures.
There are many risk factors for the occurrence and progression of cognitive dysfunction, including age, level of education, psychological and emotional factors, traumatic brain injury, white matter lesions, and underlying conditions such as diabetes and coronary artery disease (Ding et al., 2019; Hugo and Ganguli, 2014). Olfactory dysfunction is also closely associated with cognitive dysfunction (Molnár et al., 2023b). Current studies have found that vestibular function is closely related to cognitive function, while it is particularly evident in vestibular diseases (Bigelow and Agrawal, 2015; Rizk et al., 2020). Patients with unilateral or bilateral vestibular dysfunction exhibit impairments in visuospatial function, memory, attention and executive function. The more severe the vestibular function damage, the more pronounced the cognitive impairment (Popp et al., 2017); Patients with vestibular neuritis also show varying degrees of impairment in executive function (Moser et al., 2017), visuospatial perception, and visuospatial memory function (Oh et al., 2023). Eraslan Boz et al. (2023) found that patients with Ménière’s disease experience widespread cognitive dysfunction, including in memory, attention, executive functioning, and visuospatial functioning. Many studies have identified varying degrees of vestibular dysfunction in VM patients (Yujie et al., 2018). However, whether vestibular dysfunction in VM patients is the cause of cognitive dysfunction and the specific interaction mechanism between the two is unclear. This study aims to investigate and analyze the vestibular and cognitive functions in VM patients to elucidate the correlation and the underlying mechanisms, providing new insights for the early identification and intervention of VM-related cognitive dysfunction.
2 Materials and methods 2.1 ParticipantsThis study was conducted from February 2023 to December 2023. The study was approved by the Ethics Committee of the First Affiliated Hospital of Harbin Medical University, and all participants voluntarily participated with signed informed consent forms. All 61 VM patients were recruited from the Dizziness and Vertigo Clinic of the Neurology Department at the First Affiliated Hospital of Harbin Medical University. Meanwhile the control group which include 30 participants, matched for age, gender and education years, required no history of headaches, dizziness/vertigo, or other serious illnesses and they mostly consisted of family members or friends accompanying the outpatients. The inclusion and exclusion criteria for VM patients are as follows. Upon enrollment, VM patients were assessed using the ACE-R, DHI, HADS, PHQ-9, and GAD-7 scales. Based on ACE-R scores, VM patients were divided into two groups: the VM-CogD group (ACE-R < 86) and the VM-NoCogD group (ACE-R ≥ 86). The VM-CogD group was further subdivided into 3 groups based on their total DHI score: mild, moderate, and severe dizziness/vertigo with cognitive dysfunction (DHI ≤ 30 for mild, 30 < DHI ≤ 60 for moderate, and DHI > 60 for severe). Bedside and laboratory vestibular function examinations, including the head-shaking test, head-impulse test, test of skew, Romberg test, Unterberger test, videonystagmography, and caloric test were performed on VM patients during the remission phase of episodes. All examinations were conducted by the same neurophysiologist.
2.1.1 Inclusion criteria(1) Meet the diagnostic criteria for VM according to the Bárány Society (Table 1) (Lempert et al., 2012); (2) Be able to read and complete questionnaires; (3) Be able to communicate properly; (4) Sign the informed consent form.
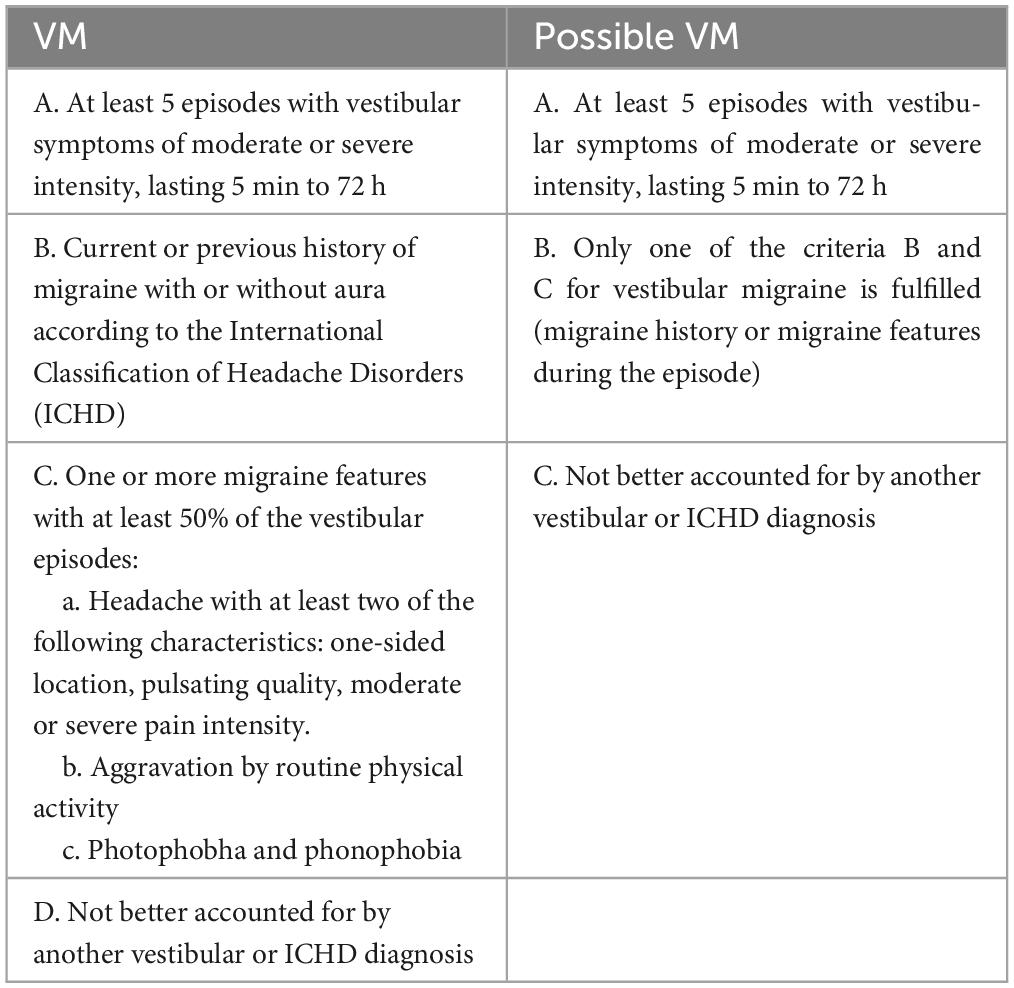
Table 1. Diagnostic criteria of VM.
2.1.2 Exclusion criteria(1) Inability to adequately expose the pupil or with blindness, strabismus and congenital spontaneous nystagmus; (2) Perforated eardrum, foreign body in the external auditory canal; (3) Other causes of cognitive dysfunction (such as Alzheimer’s disease, Lewy body dementia, vascular dementia, Parkinson’s disease, etc.); (4) Other vestibular disorders, such as benign paroxysmal positional vertigo (BPPV), vestibular neuritis, and Ménière’s disease (MD); (5) Individuals with severe physical illnesses, neuropsychiatric disorders and systemic diseases, such as stroke, coronary artery disease, schizophrenia; (6) Individuals with substance abusers; (7) Pregnant or breastfeeding women; (8) Individuals who refuse to sign the informed consent form.
2.2 Outcomes(1) Demographic information: age, sex and years of education; (2) Clinical characteristics: duration of the disease and the frequency of episodes; (3) Vestibular function-related indicators: bedside and laboratory examinations (Tables 2, 3); (4) Scale scores of ACE-R, DHI, HADS, PHQ-9 and GAD-7 (Table 4).
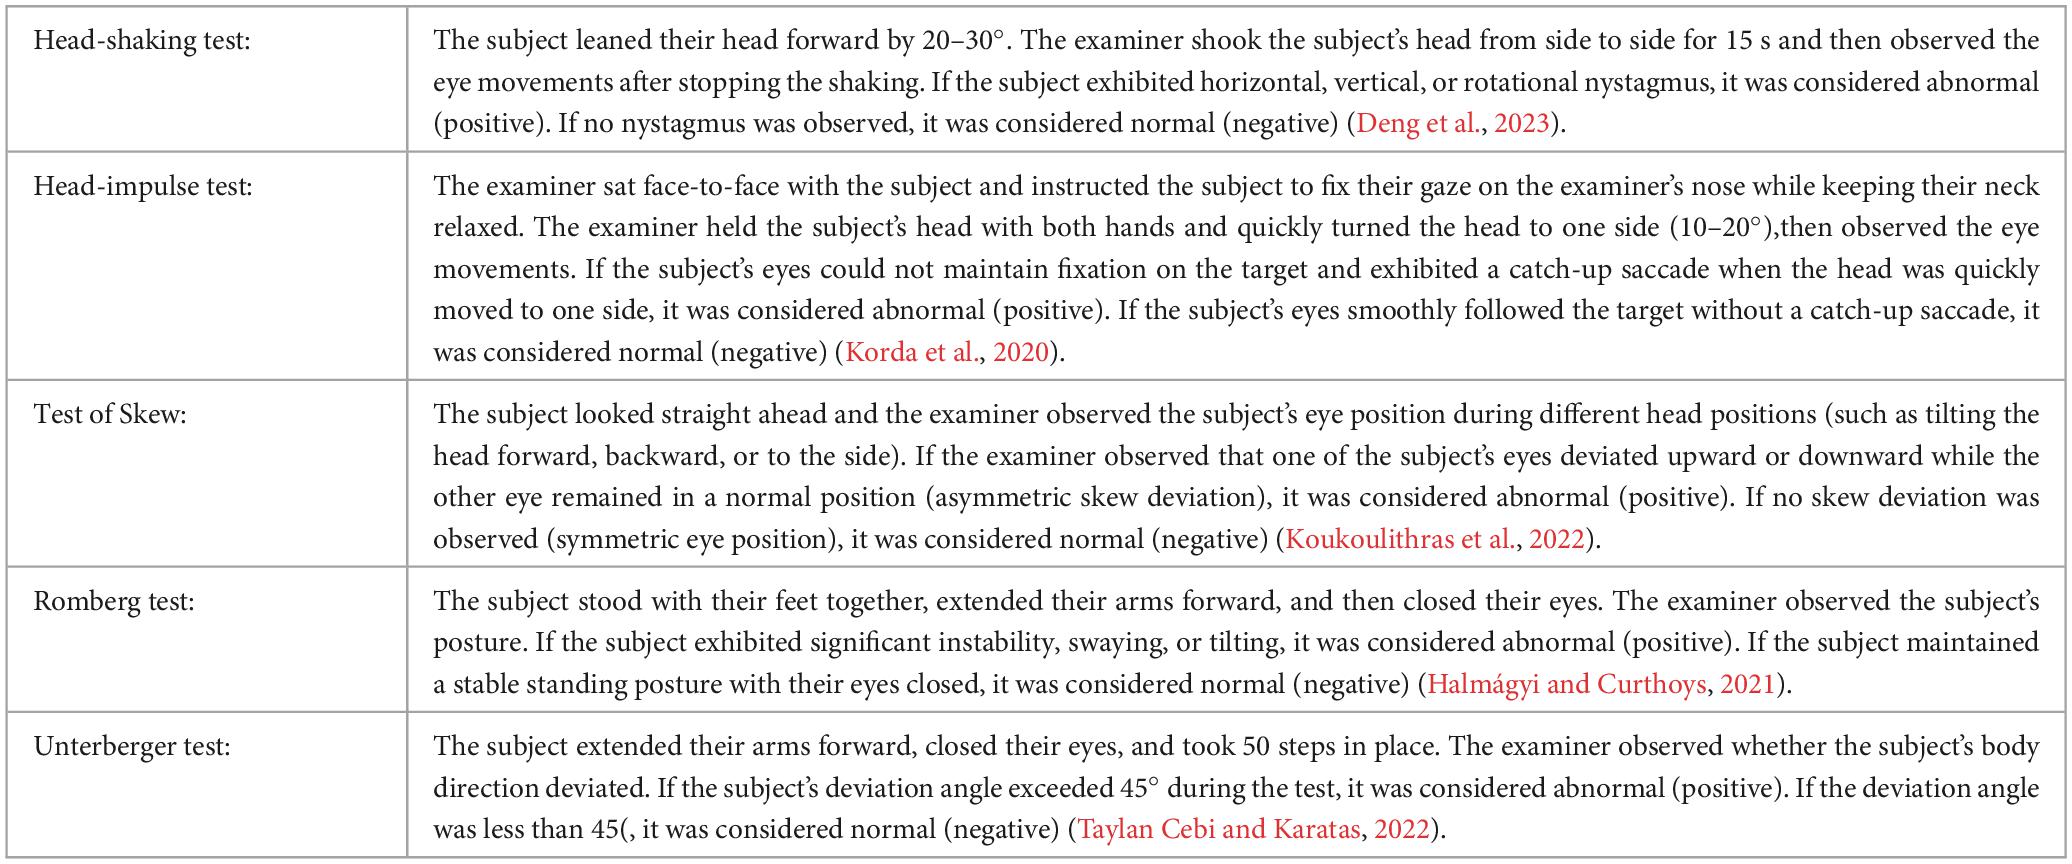
Table 2. Items of bedside examination for vestibular function.
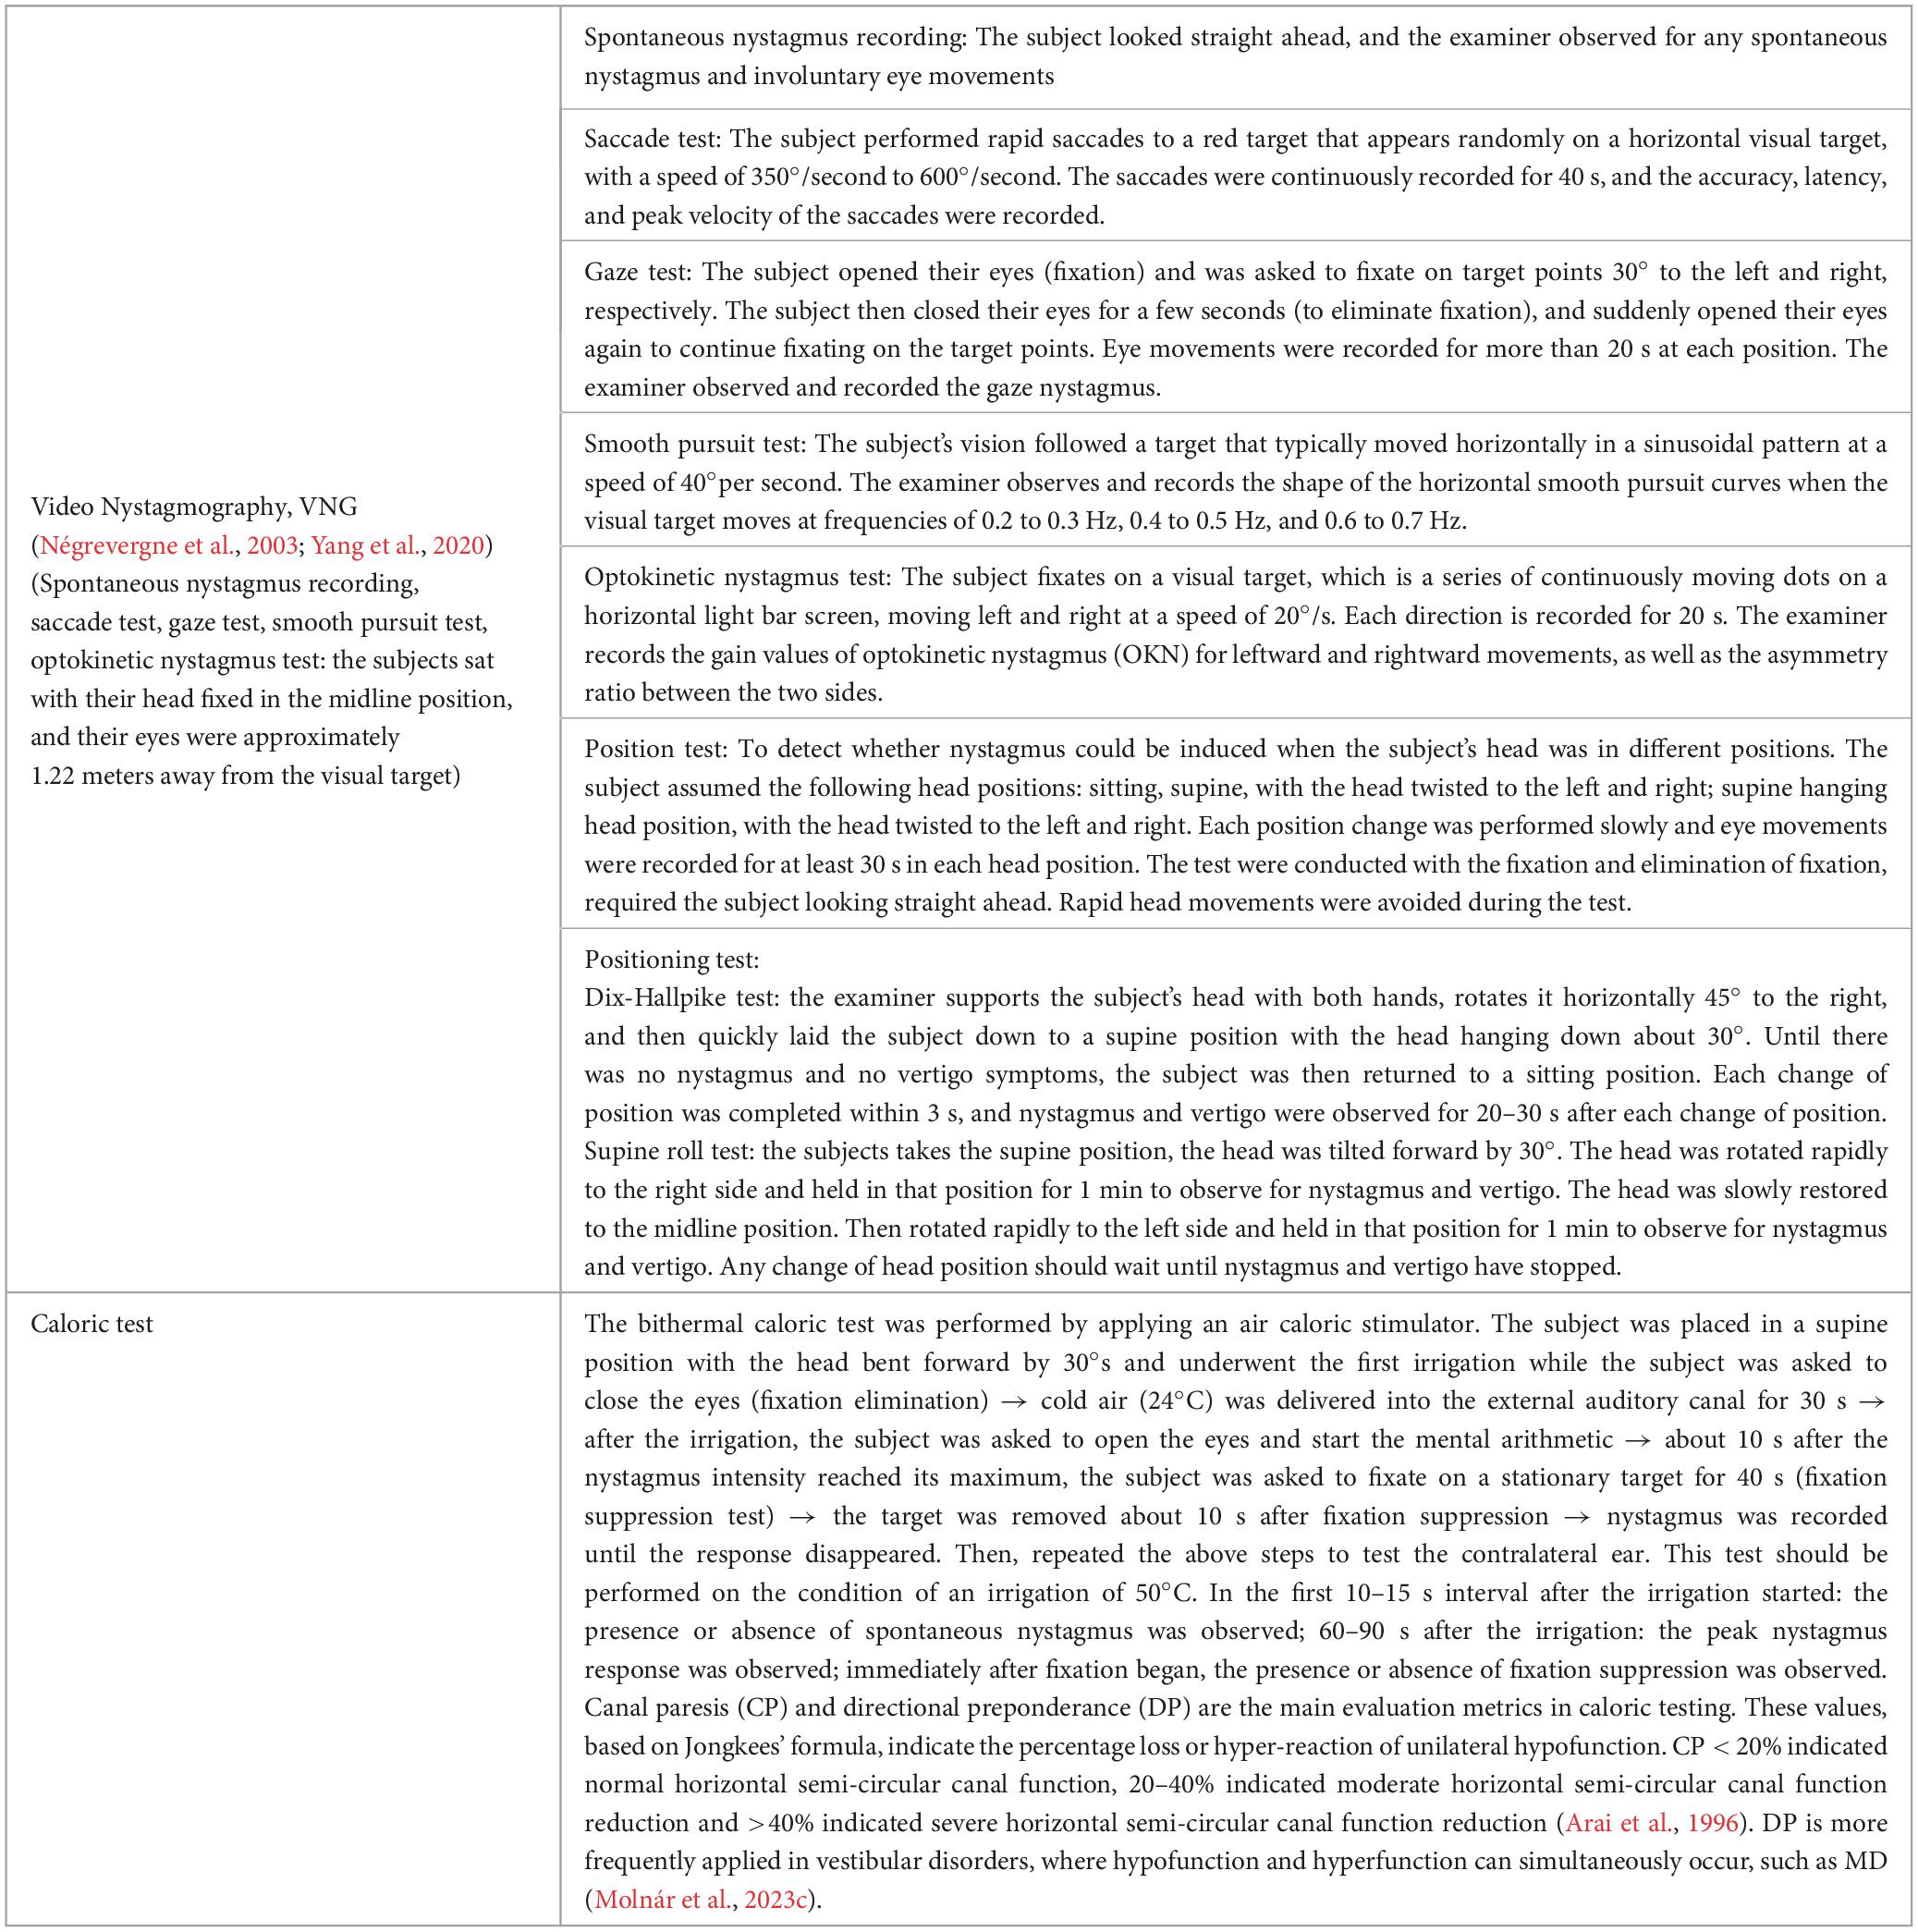
Table 3. Items of objective neurotological testing for vestibular function.
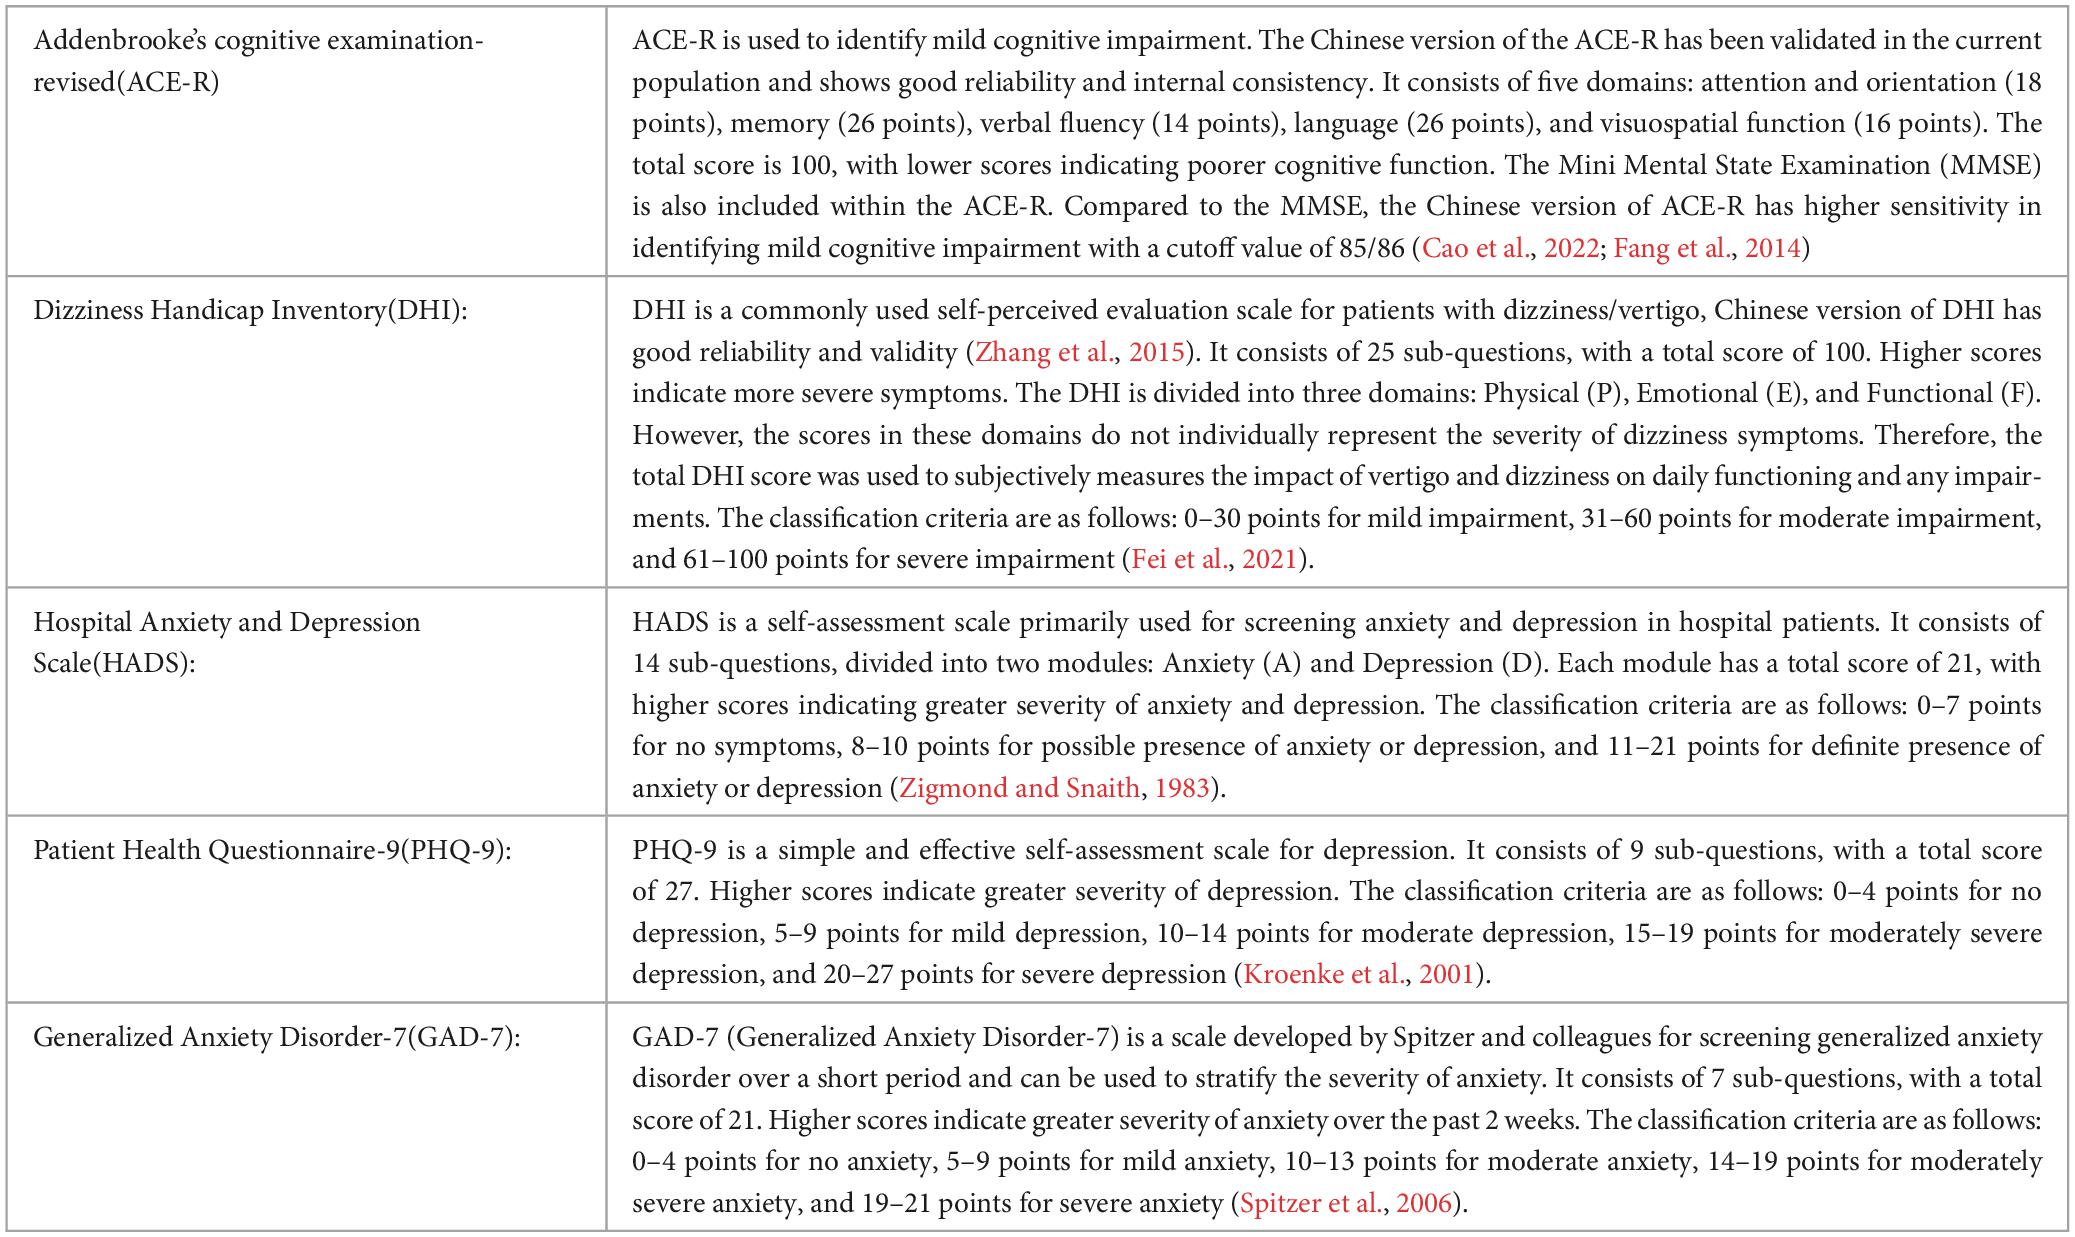
Table 4. Items of scales.
2.3 Statistical analysisStatistical analysis was conducted using SPSS25.0. We used the Shapiro-Wilk test to perform normality testing on our data. Categorical data were presented as n (%), and intergroup comparisons were performed using the chi-square test or Fisher’s exact test. Continuous data that were normally distributed were presented as mean (SD), and intergroup comparisons were conducted using the independent samples t-test. Continuous data that were not normally distributed were presented as median (P25, P75), and the Mann-Whitney U test was used for intergroup comparisons. A p-value < 0.05 was considered statistically significant and | r| > 0.3 indicated a good correlation.
To assess the relationships between the variables, we conducted a correlation analysis. For normally distributed data, we used Pearson’s correlation coefficient, and for non-normally distributed data, we used Spearman’s rank correlation coefficient. To determine the statistical significance of the correlation coefficients, we used a two-tailed test with a significance level of α = 0.05. We also created scatter plots to visually represent the relationships between the variables.
To evaluate the performance of the diagnostic tests and determine the optimal cut-off values, we performed a Receiver Operating Characteristic (ROC) curve analysis. We calculated the True Positive Rate (TPR) and False Positive Rate (FPR) for each diagnostic metric at different cut-off values. We plotted the ROC curves with FPR on the x-axis and TPR on the y-axis. The Area Under the Curve (AUC) reflected the overall performance of the diagnostic tests, AUC > 0.5 indicates that the model has better predictive performance than random guessing. The ROC curves and AUC values were presented in both graphical and tabular forms. We reported the optimal cut-off values, sensitivity, specificity, and their corresponding 95% confidence intervals for each diagnostic metric.
3 Results 3.1 Differences in age, gender, and years of education between the VM group and the HC groupA total of 61 patients were included in the VM group, with a median age of 47 years, consisting of 4 male and 57 female patients, and the median years of education for the VM group was 15 years. A total of 30 subjects were included in the HC group, with a median age of 45 years, consisting of 4 male and 26 female patients, and the median years of education was 13.5 years. There were no statistically significant differences in the general demographic data between the two groups (p-value > 0.05) (Table 5). Therefore, they were comparable in the subsequent studies.
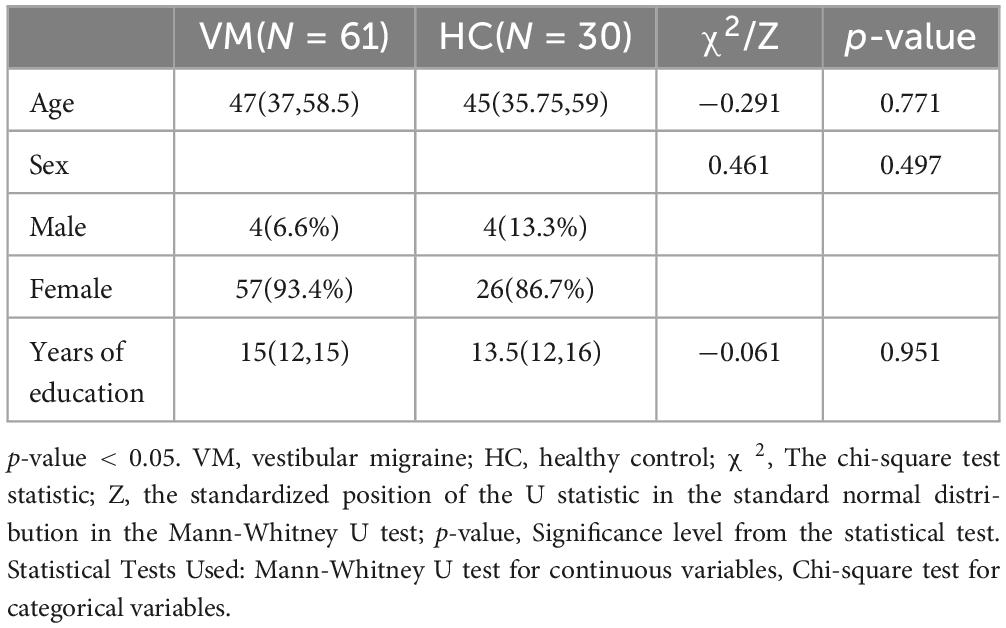
Table 5. Comparison of general demographic data between VM and HC groups.
3.2 Differences in DHI scales between the VM group and the HC groupThere were statistically significant differences in the total DHI scores (p-value = 0.000), DHI-P (p-value = 0.000), DHI-E (p-value = 0.000), and DHI-F (p-value = 0.000) scores between the VM group and the HC group p-value (Figure 1 and Table 6). Specifically, the VM group had significantly higher DHI total score [46 (33, 63)], DHI-P [14 (10, 18)], DHI-E [12 (6, 20)], and DHI-F [20 (12, 27)] compare to the HC group, which had DHI total score [8 (4, 10.5)], DHI-P [2 (0, 6)], DHI-E [2 (0, 4)], and DHI-F [1 (0, 2.5)].
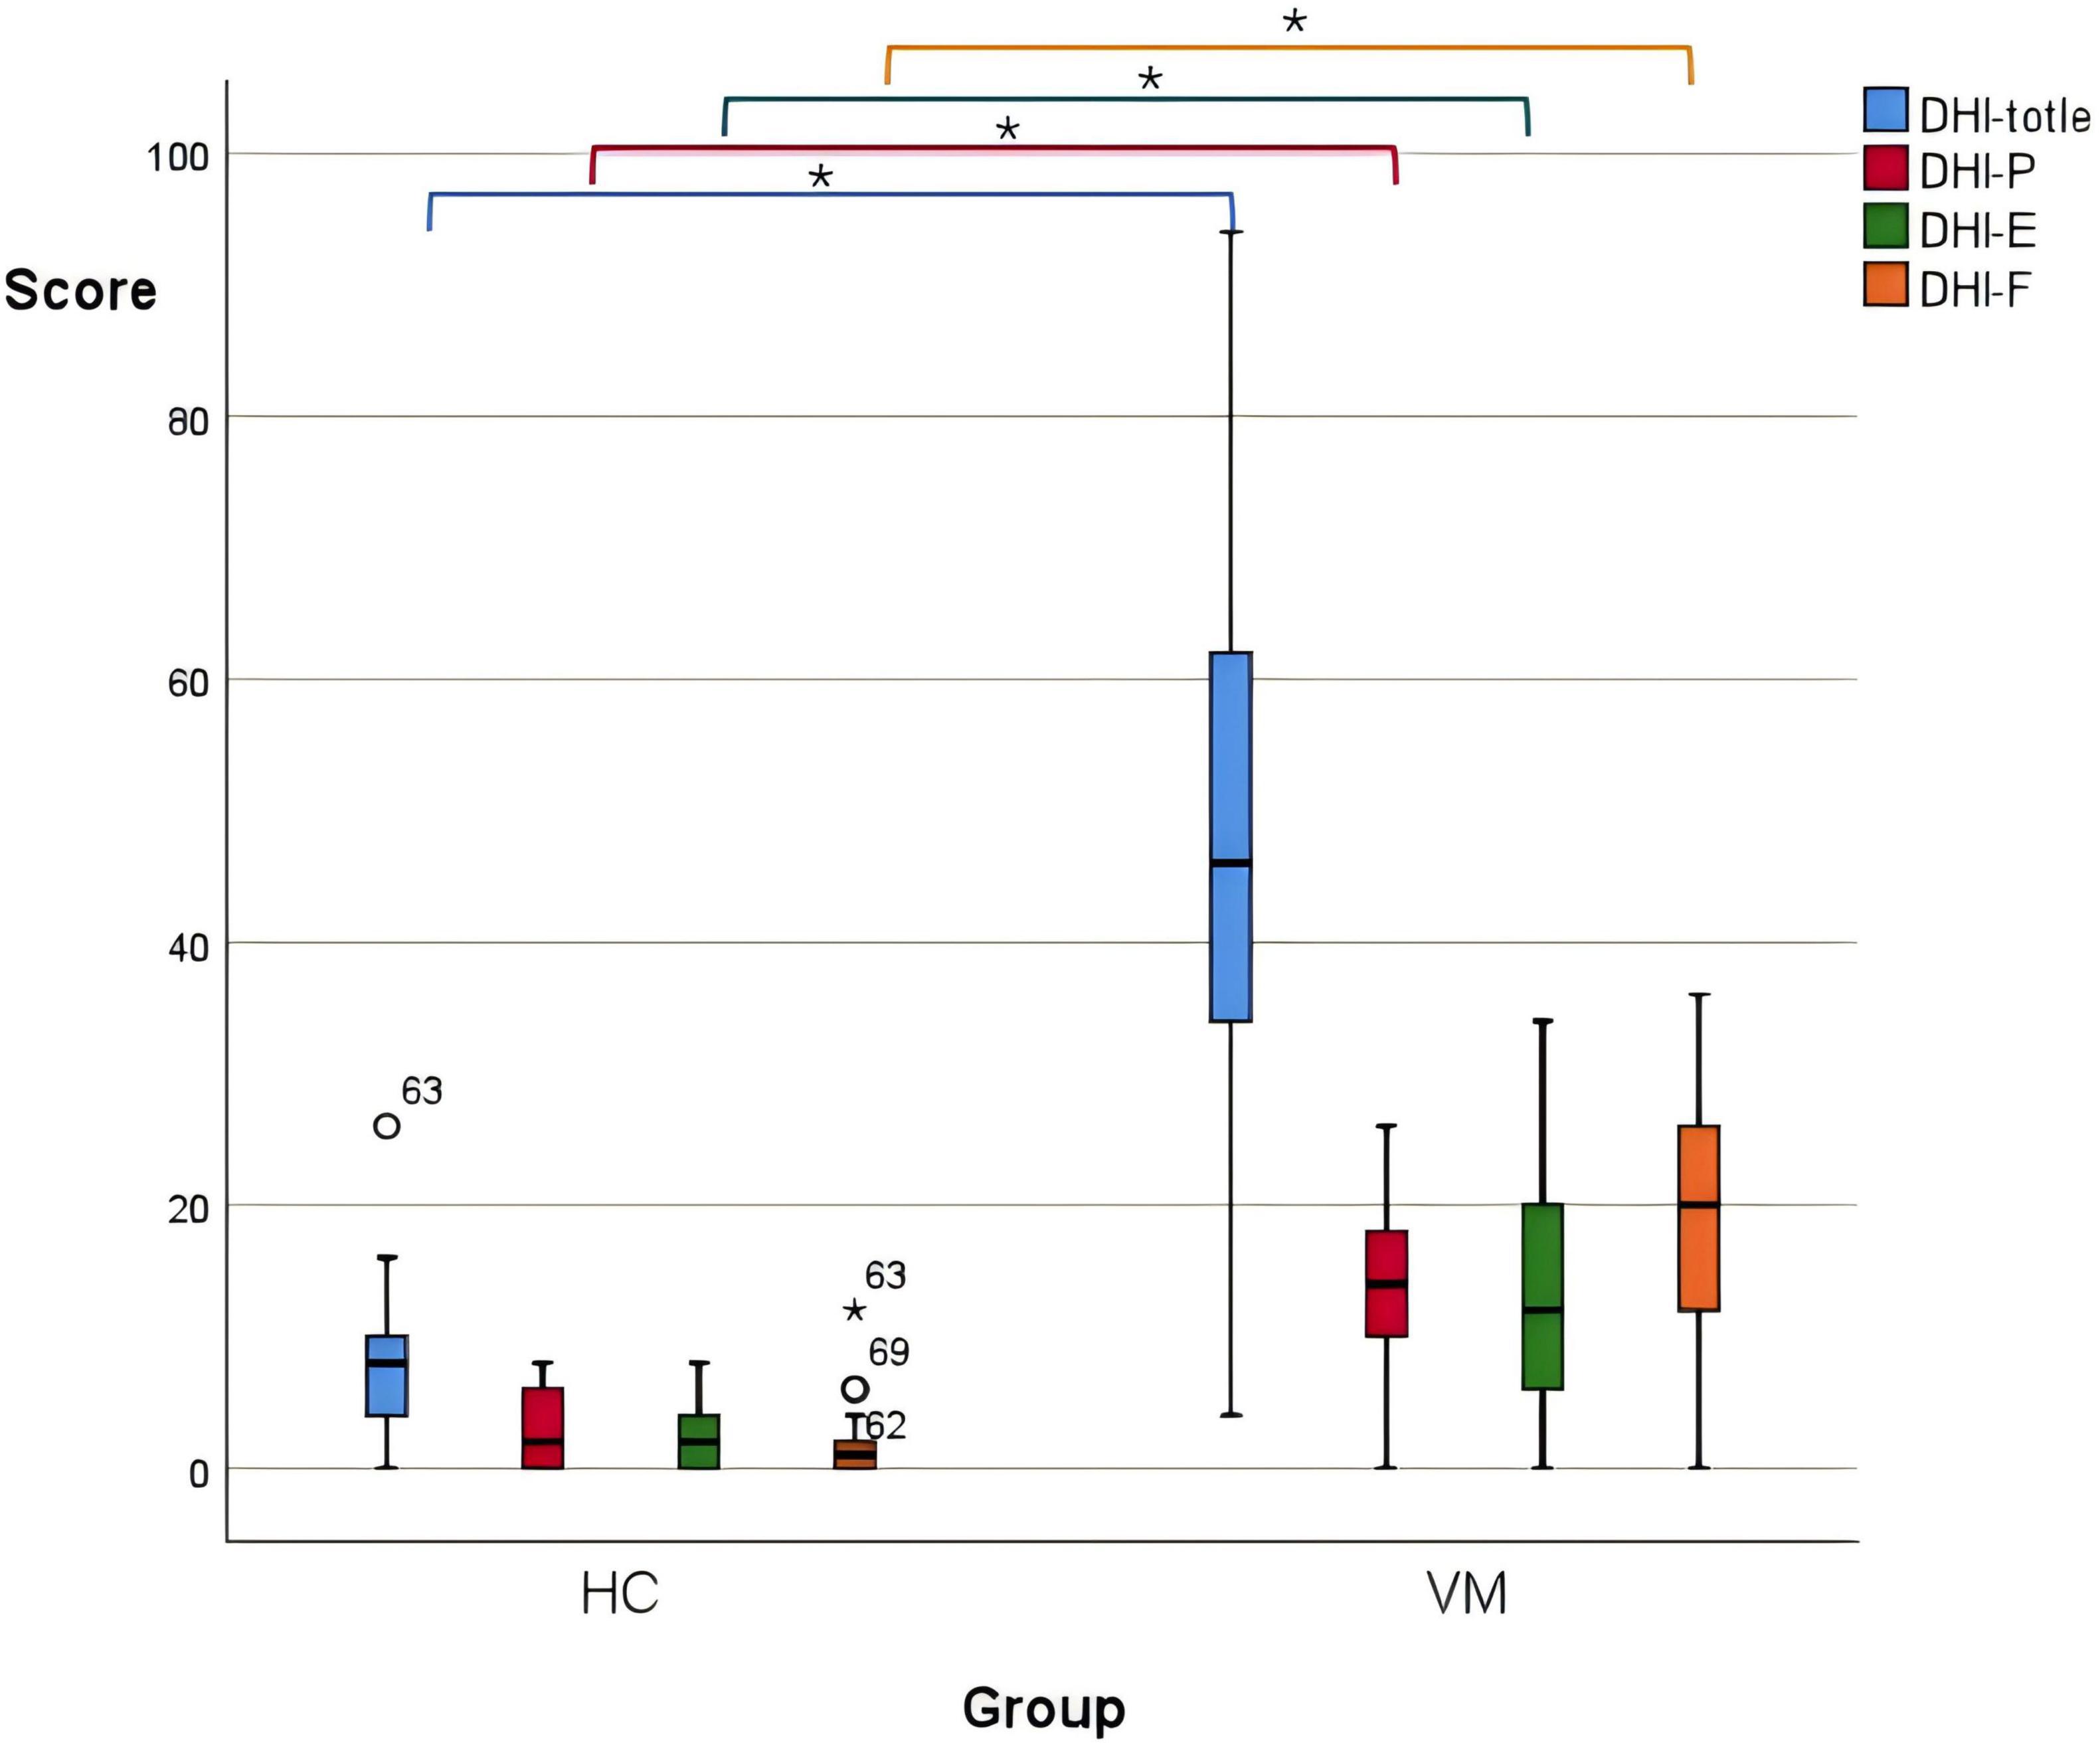
Figure 1. Boxplot comparing DHI scores between the VM and the HC groups. Black lines in the boxes: median values, box: the middle 50% of the data, whiskers: upper and lower 25%. * Represents extreme outliers.
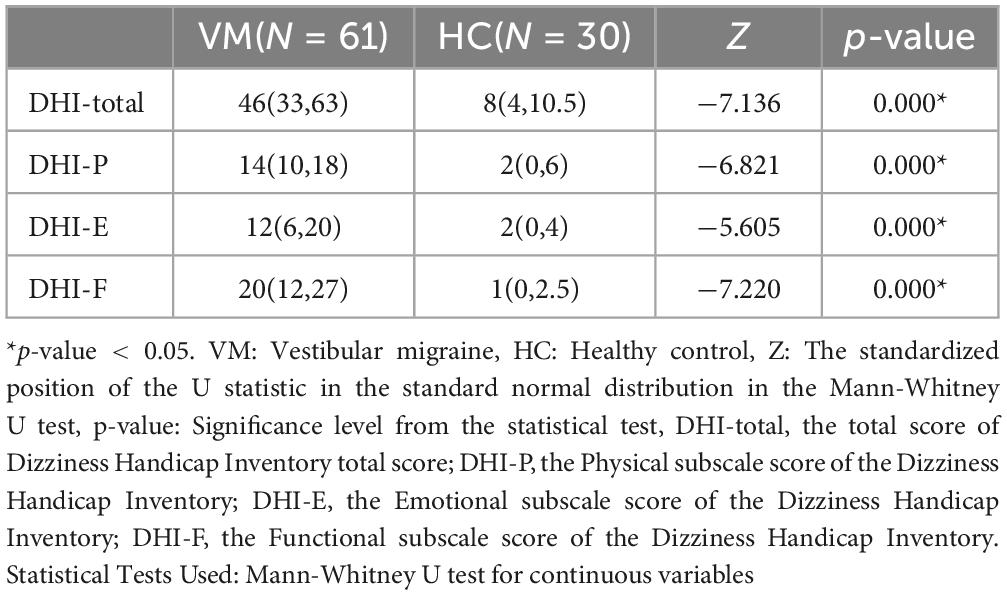
Table 6. Comparison of DHI scores between VM and HC groups.
Further, the ROC curve for the total DHI score in diagnosing VM was plotted. The AUC was 0.961 (95% CI: 0.922–1.000), with a corresponding p-value of 0.000, which is less than 0.05, indicating that the total DHI score has a high predictive value for VM. The cut-off value was 17, with a sensitivity of 0.951, and a specificity of 0.967, potentially serving as a predictive indicator (Figure 2 and Table 7).
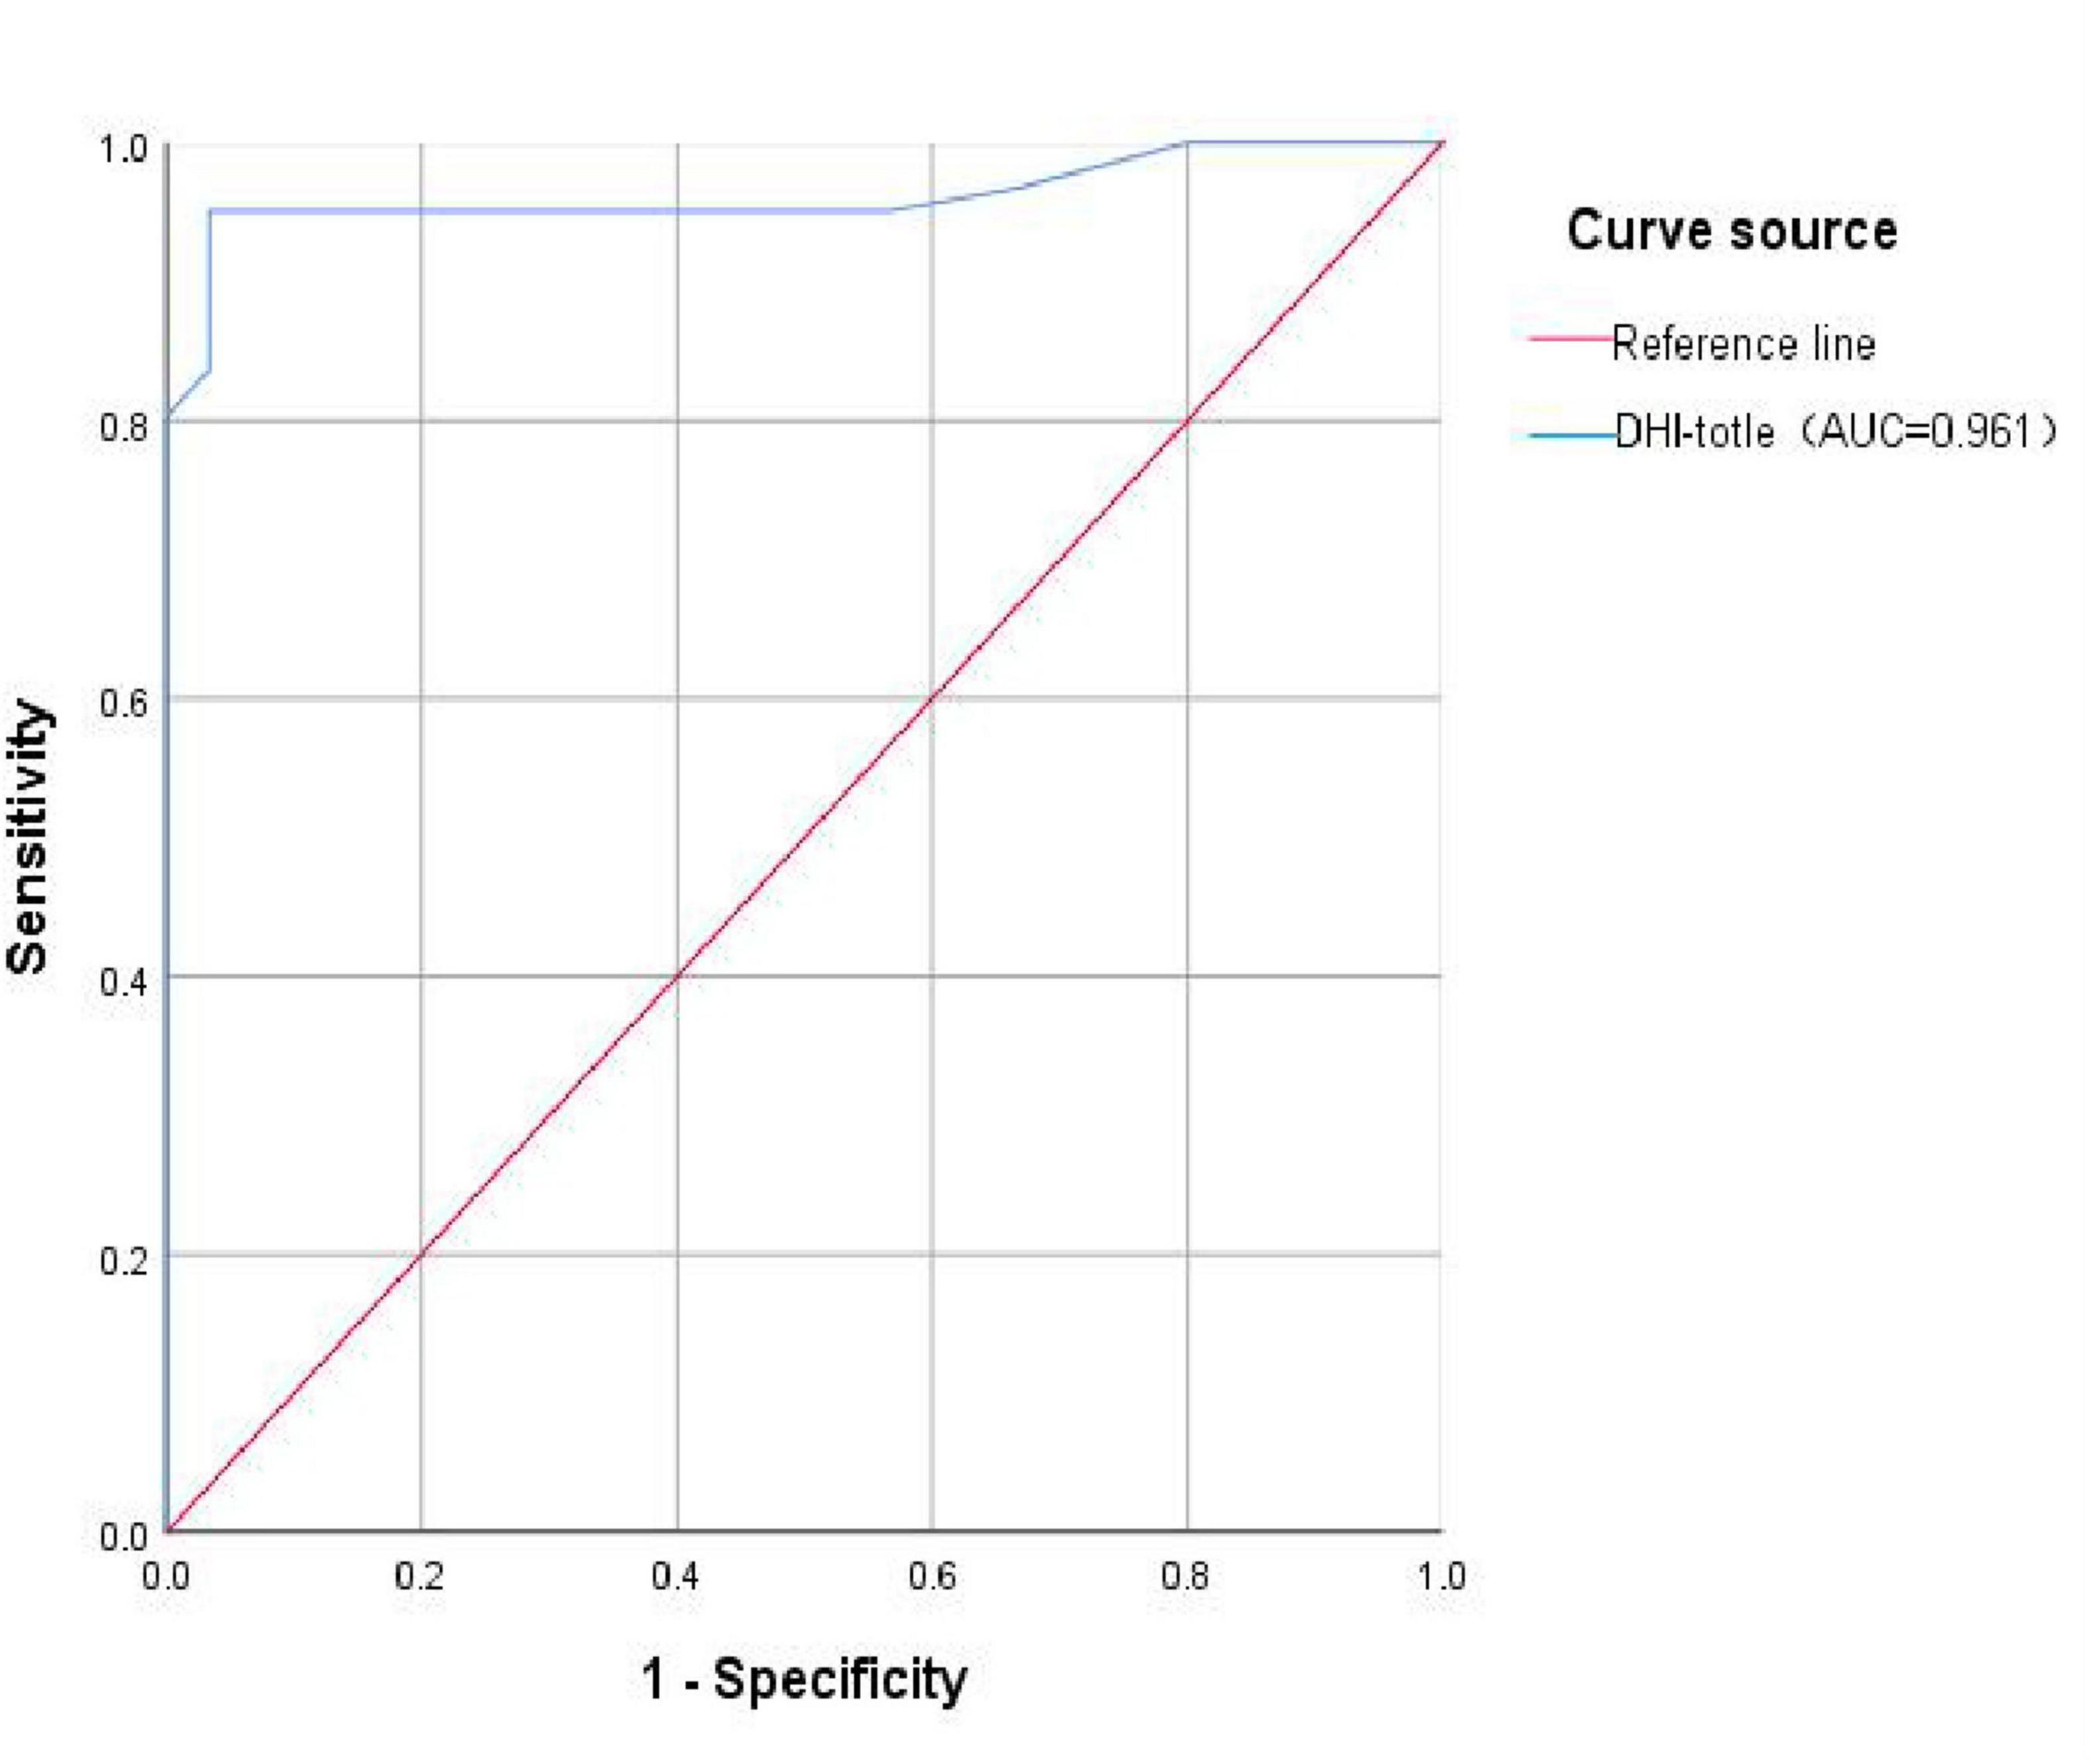
Figure 2. ROC curve of VM predicted by DHI total score. DHI-total, the total score of Dizziness Handicap Inventory total score; AUC, the Area Under the Curve.

Table 7. ROC curve for the total DHI score in diagnosing VM.
3.3 Differences in emotional scales (HADS, PHQ-9, GAD-7) between the VM and HC groupsThe emotional scales showed statistical differences between the VM group and the HC group (p-value = 0.000) (Figure 3 and Table 8). Specifically, the VM group had significantly higher HADS-A scores [7 (4, 11)], HADS-D scores [7 (4, 11)], PHQ-9 scores [8 (4, 13)], and GAD-7 scores [6 (2, 10)] compared to the HC group, which had HADS-A scores [2 (0, 4.25)], HADS-D scores [1 (0, 3)], PHQ-9 scores [1.5 (1, 2)], and GAD-7 scores [2 (1, 3.25)]. These results emphasized that the co-occurrence of psychiatric symptoms, particularly depression and anxiety, was significantly higher in VM patients.
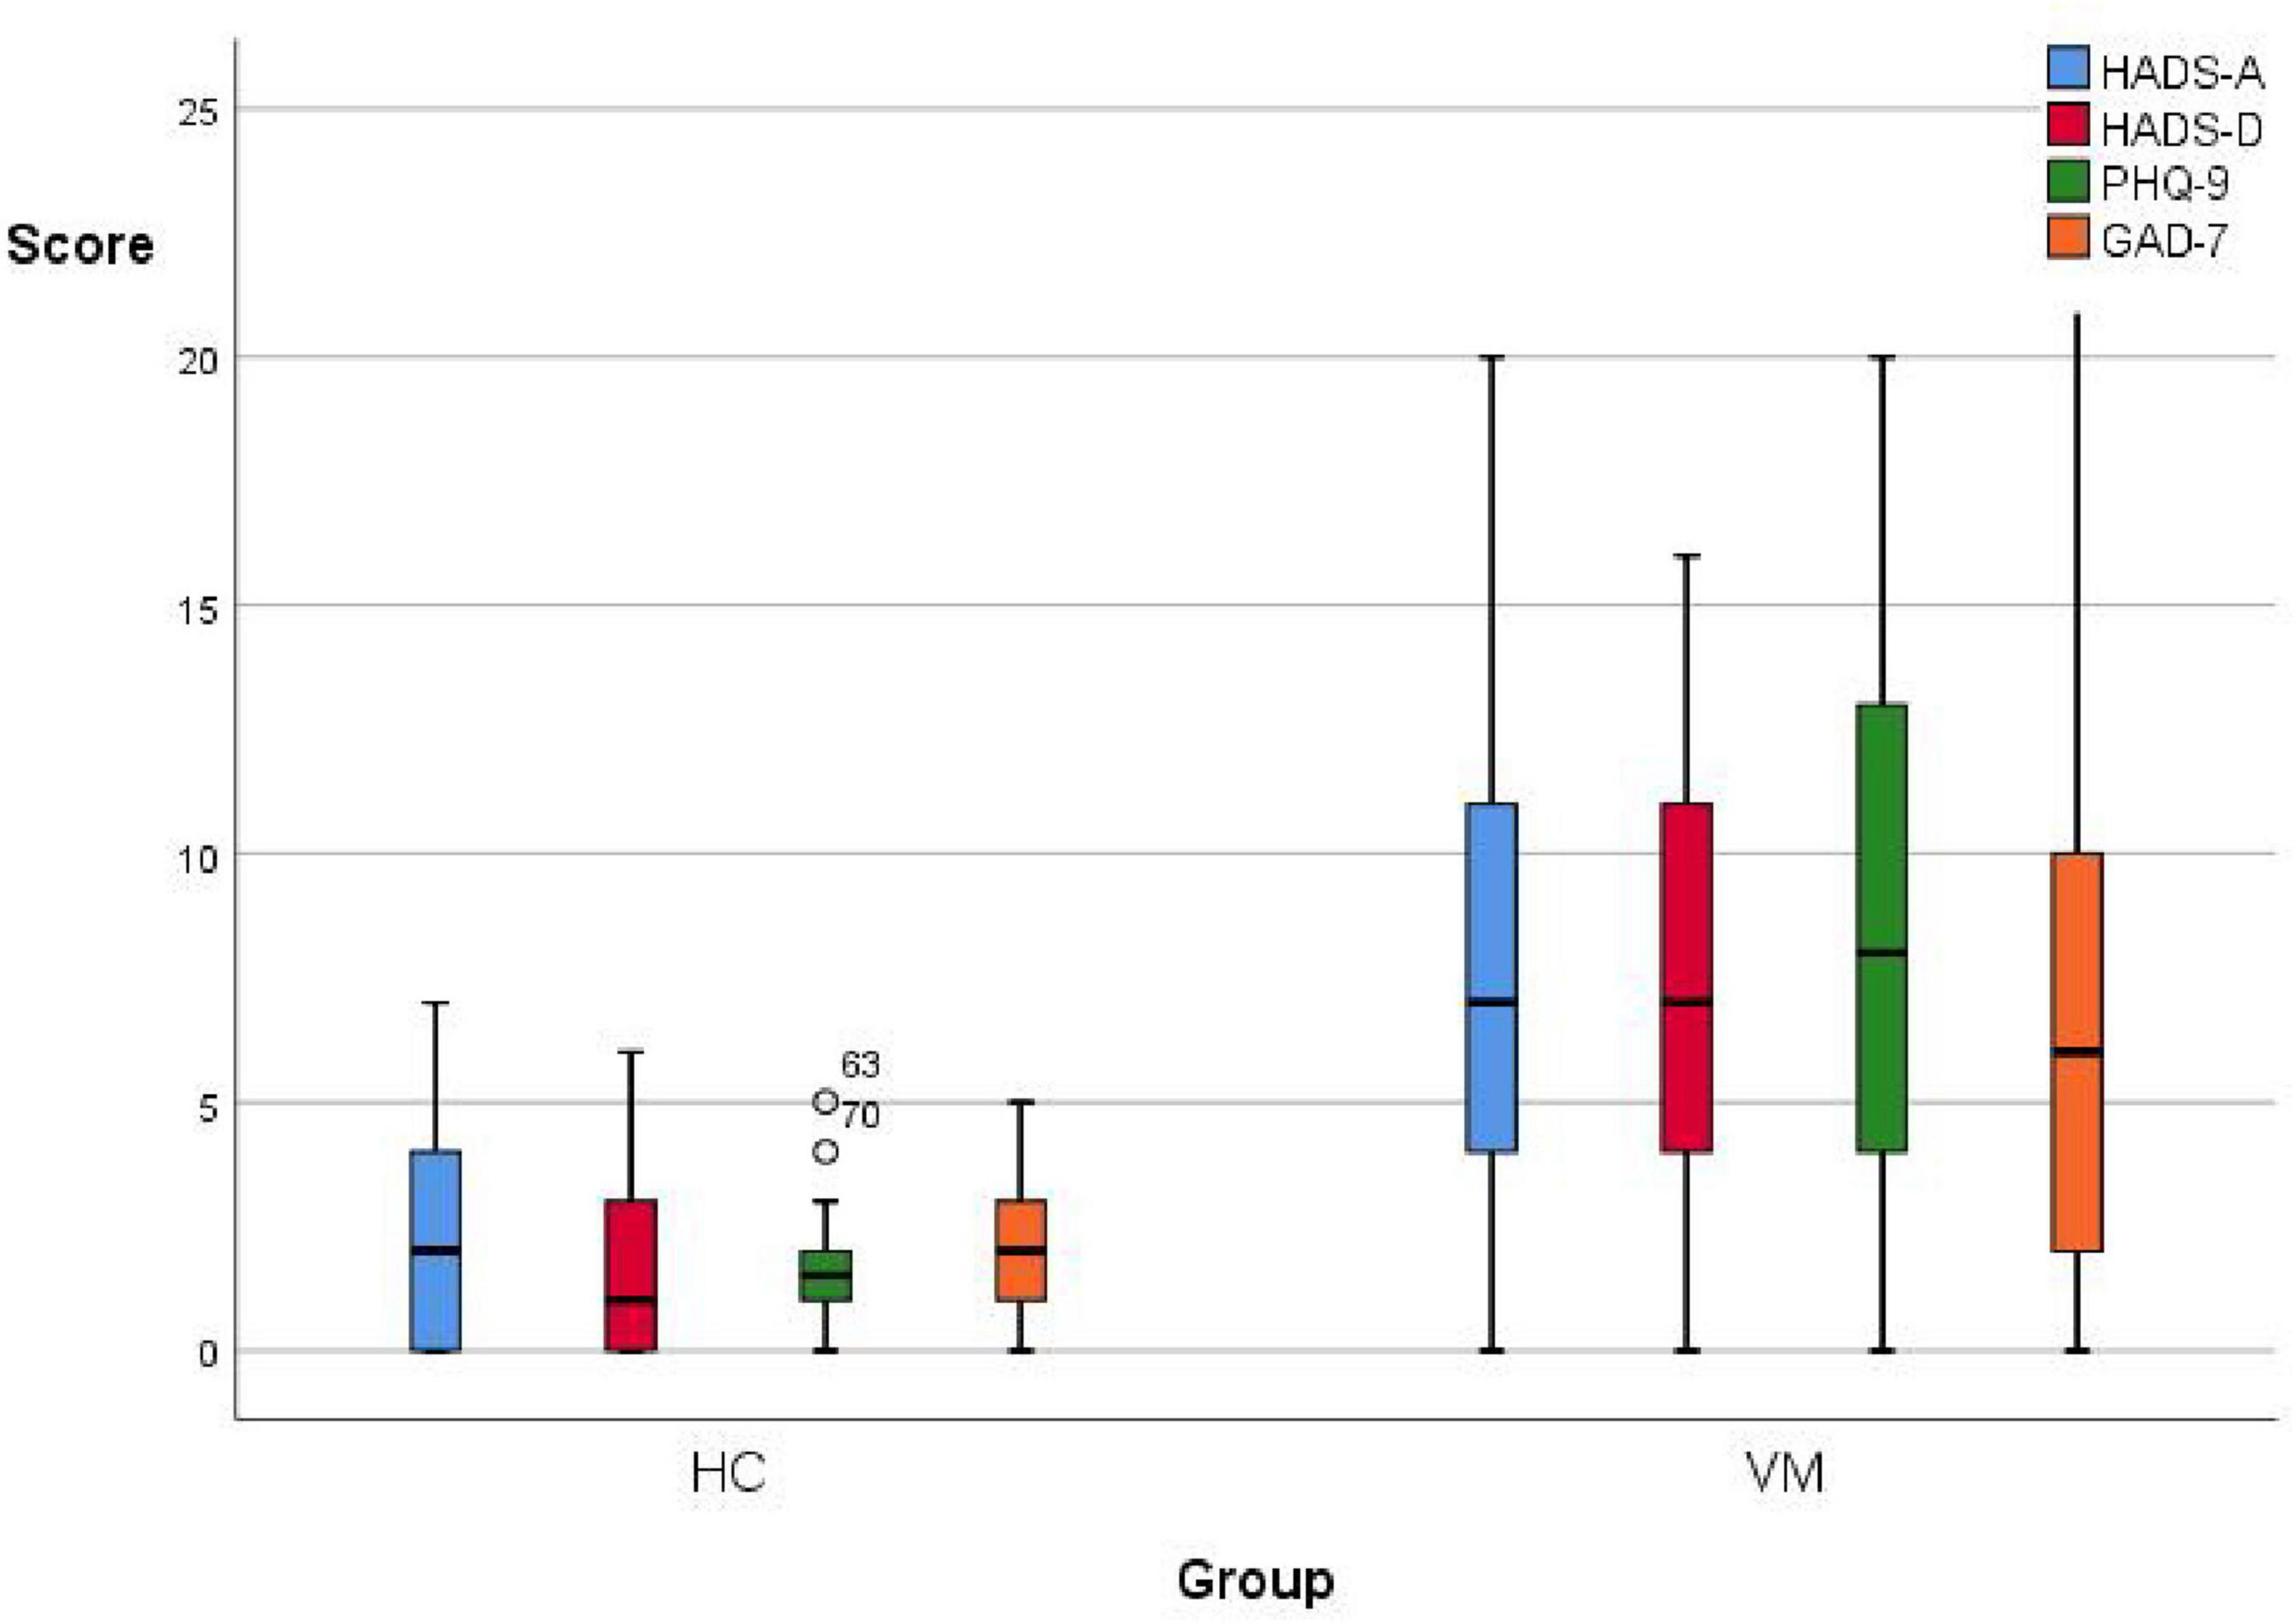
Figure 3. Boxplot comparing emotional scales scores between the VM and the HC groups. Black lines in the boxes: median values, box: the middle 50% of the data, whiskers: upper and lower 25%.
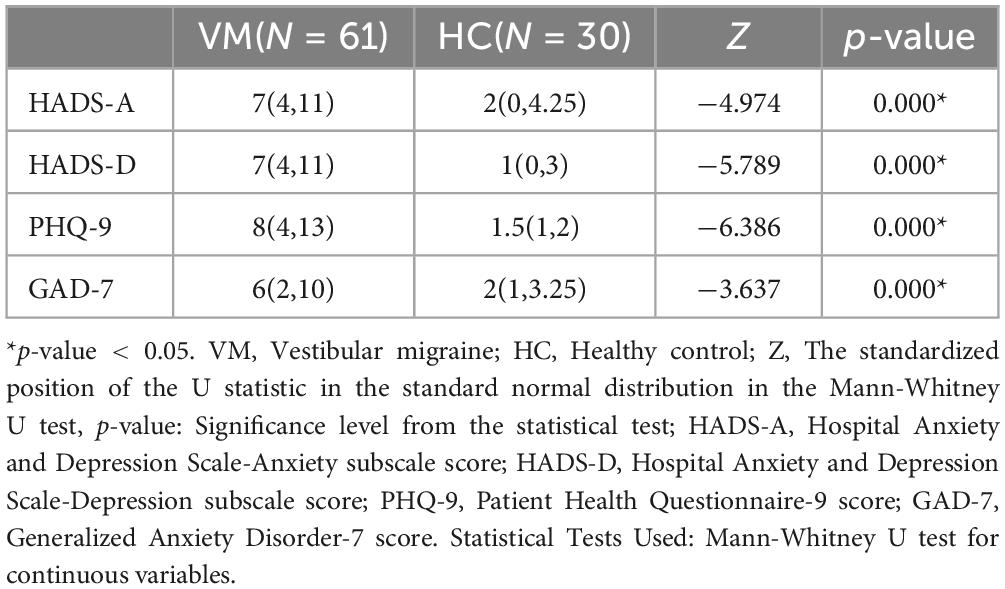
Table 8. Comparison of emotional scales between VM and HC groups.
3.4 Differences in vestibular function between the VM and HC groupsIt was statistically different in vestibular function indicators between the VM group and the HC group (p-value < 0.05) (Table 9). During the caloric test, we observed that VM patients exhibited reduced nystagmus intensity or even no nystagmus in response to cold/warm stimuli, as well as asymmetry in the intensity of nystagmus bilaterally. Additionally, some VM patients showed a change in the direction of nystagmus, such as nystagmus instead directed to the left when the right ear was stimulated with warm water. Specifically, the VM group had significantly higher percentages than the HC group for canal paresis (82.0% vs. 3.3%), oculor motor dysfunction (49.2% vs. 0.0%), positive head-shaking test (27.9% vs. 0.0%), positive head-impulse test (37.7% vs. 0.0%), positive Romberg’s sign (60.7% vs. 0.0%), and positive Unterberger’s sign (60.7% vs. 0.0%). Since the results of the test of skew were negative for all subjects in both groups, no statistical analysis was performed for this test.

Table 9. Comparison of vestibular function between VM and HC groups.
3.5 Differences in ACE-R between the VM and HC groupsThe differences in the ACE-R total score, memory, verbal fluency, language, and visuospatial function scores between the VM group and the HC group were statistically significant (p-value < 0.05), while the differences in MMSE scores, attention, and orientation scores were not (p-value > 0.05) (Table 10). Specifically, the ACE-R total score [82 (68.5, 87)], memory score [18 (15, 24)], verbal fluency score [8 (6, 10)], language score [22 (19.5, 25)], and visuospatial functioning score [15 (12.5, 16)] in the VM group were significantly lower than those in the HC group, which had ACE-R total score [90.5 (86, 96)], memory score [24 (20, 25)], verbal fluency score [11 (9.75, 13)], language score [24 (23, 25)], and visuospatial function score [16 (14.75, 16)].

Table 10. Comparison of cognitive function between VM and HC groups.
3.6 Analysis of factors influencing VM-related cognitive dysfunction 3.6.1 Comparison of general demographic data, clinical manifestations, vestibular function tests, and scale results between the VM-CogD group and the VM-NoCogD groupIt can be seen that only the differences in CP value (p-value = 0.000), age (p-value = 0.012), years of education (p-value = 0.016), and course of the disease (p-value = 0.045) were statistically different between the two groups, There were no statistical differences (p-value > 0.05) in sex, frequency of episodes, total DHI score, DHI-P, DHI-E, DHI-F, HADS-A, HADS-D, PHQ-9, GAD-7 scores, percentage of canal paresis and ocular motor dysfunctions, positive percentage of head-shaking test, head-impulse test, Romberg test, Unterberger test (Table 11). However, there was a significant unequal sex distribution in both groups, with a notably higher proportion of females than males. This seems to validate the observation mentioned in the introduction that VM is more common in females. Specifically, the VM-CogD group had significantly higher CP values (34.14 ± 18.051) and age [51 (40, 60)] compared to the VM-NoCogD group (CP: 12.28 ± 10.016, age: 36 (25, 57.5)). The years of education [12 (12, 15)] were significantly lower, and the disease duration [8 (5, 10)] was significantly longer in the VM-CogD group compared to the VM-NoCogD group (education: 15 (12, 16), disease duration: 5 (2, 8.5)).
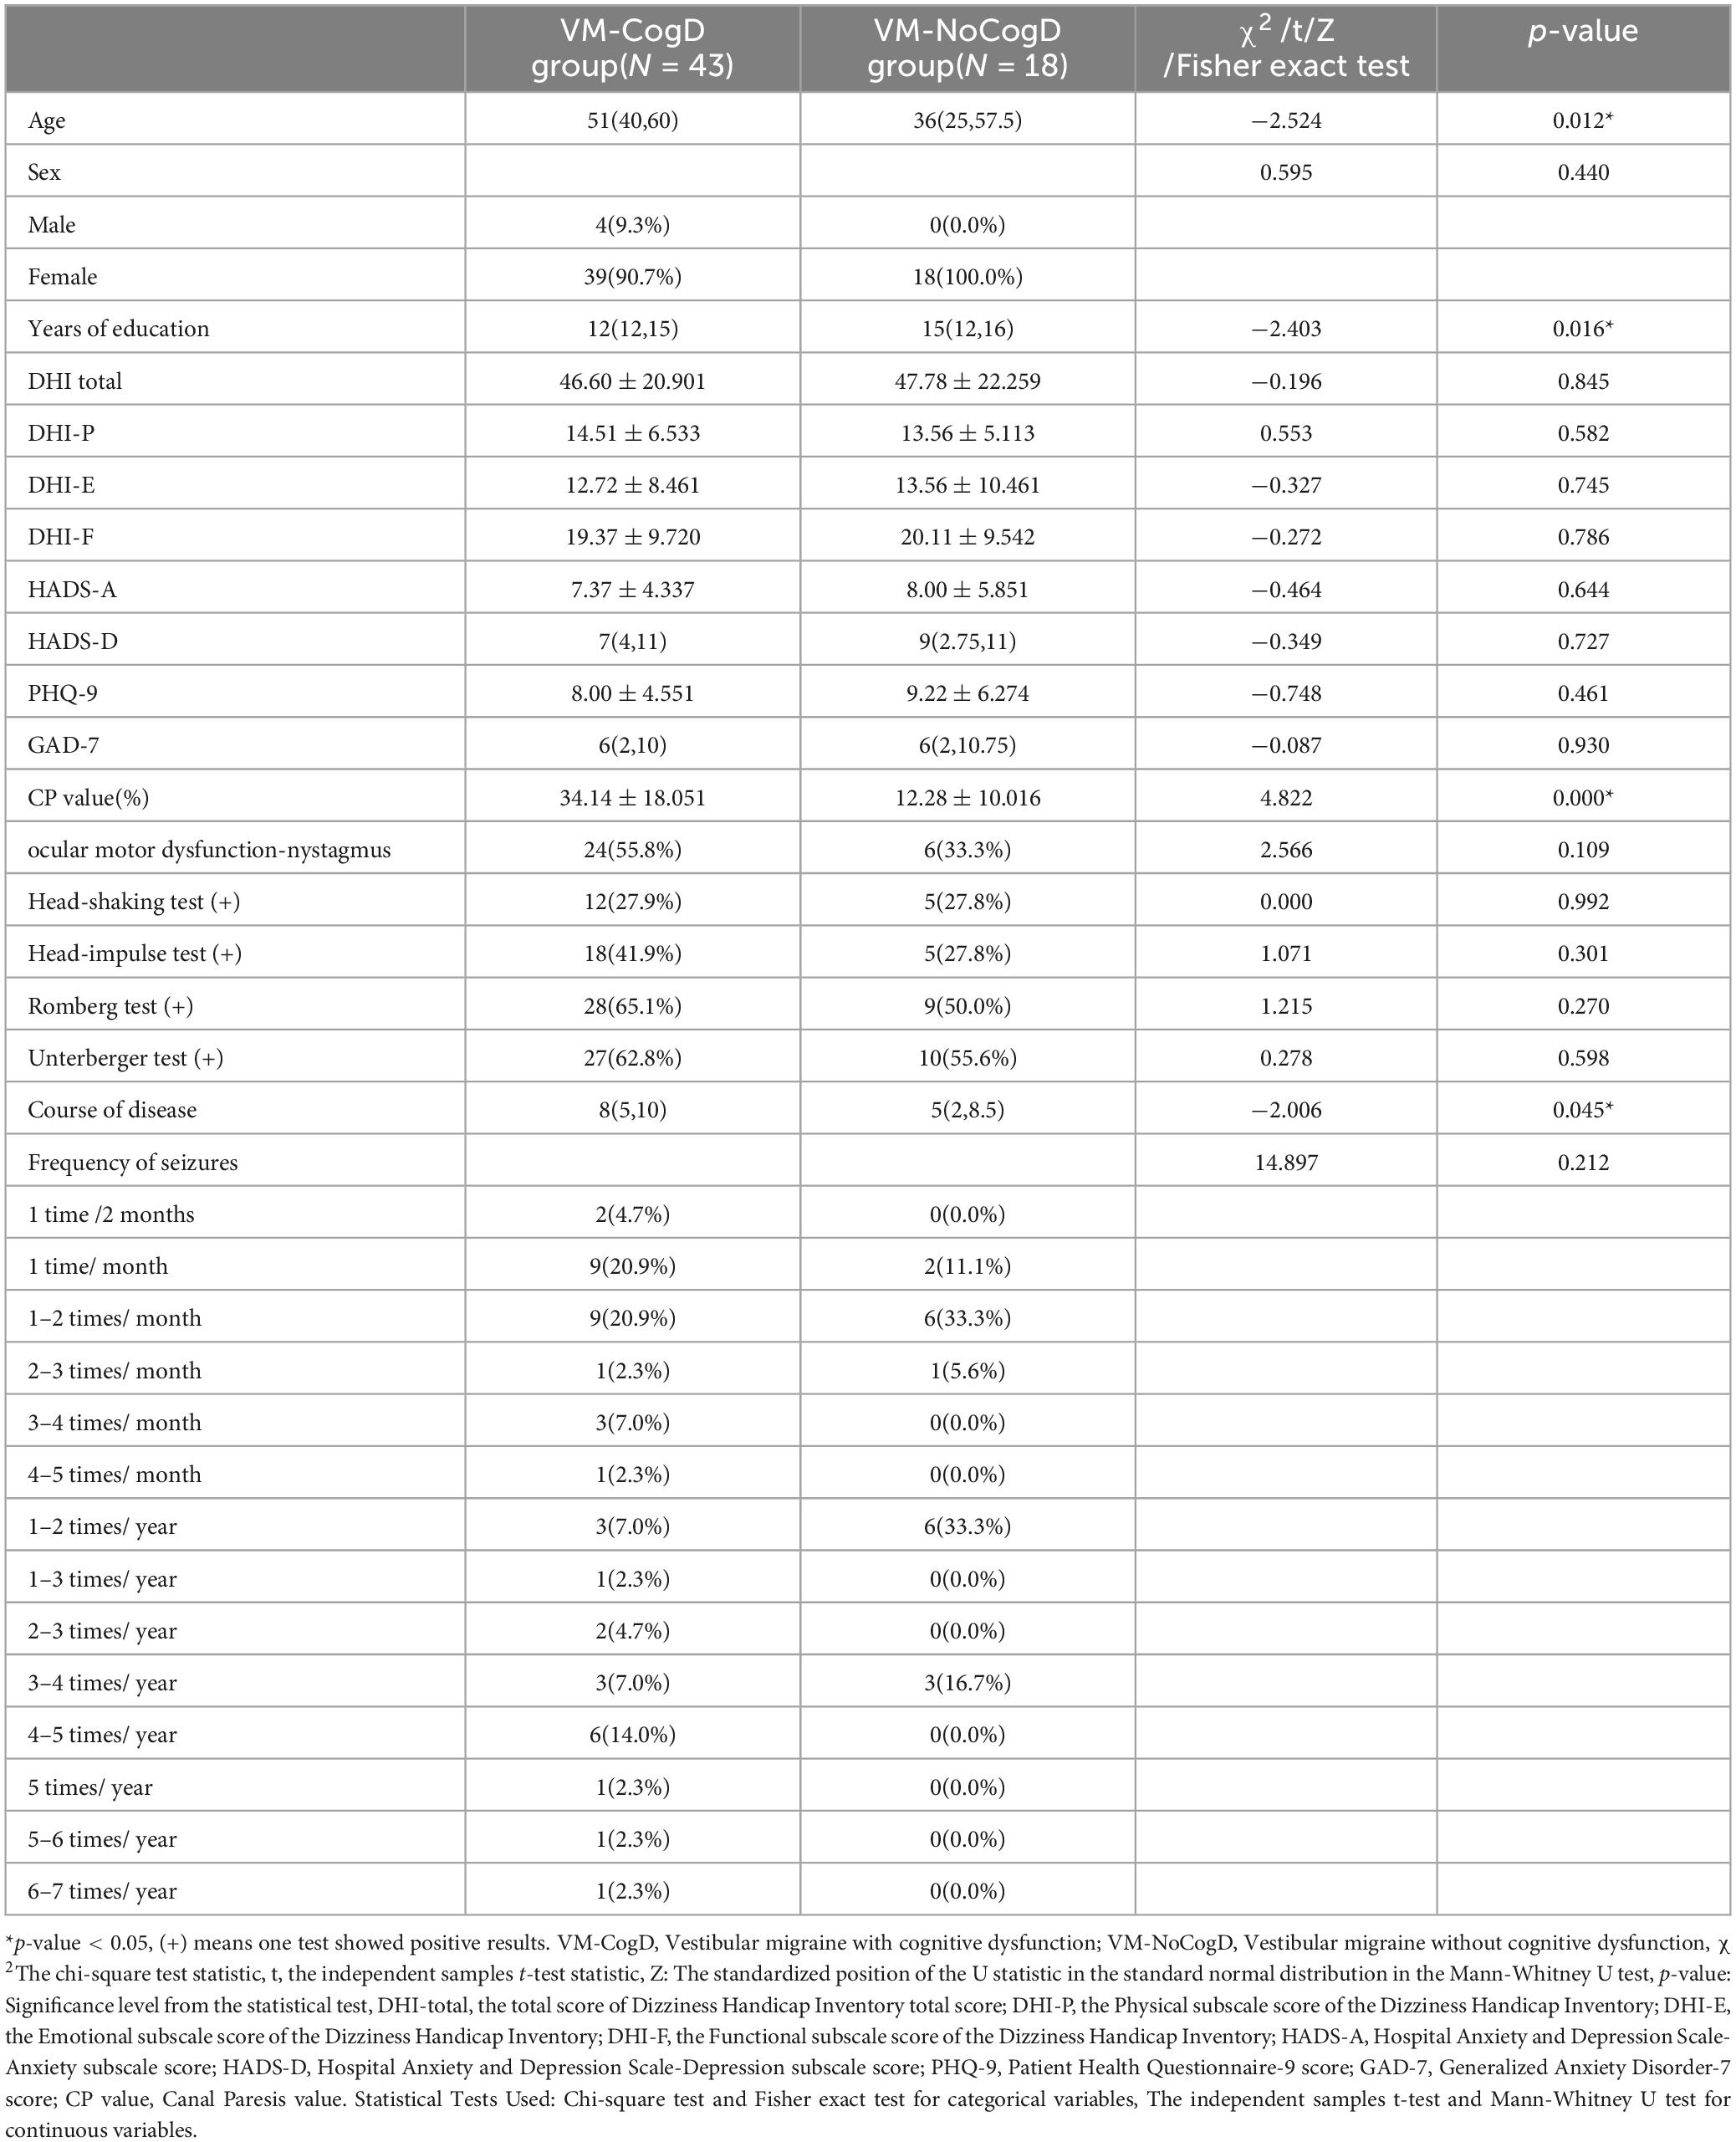
Table 11. Comparison of multiple factors between the VM-CogD and the VM-NoCogD groups.
3.6.2 Correlation analysis of cognitive function with CP value, age, years of education, and disease duration in the VM-CogD groupThere was a significant negative correlation between the ACE-R total score (r = −0.571, p-value = 0.000), memory (r = −0.526, p-value = 0.000), verbal fluency (r = −0.345, p-value = 0.024), language (r = −0.524, p-value = 0.000), visuospatial function (r = −0.340, p-value = 0.026) scores and the CP values (Table 12). A significant negative correlation was also observed between language (r = −0.384, p-value = 0.011) and age. Moreover, the ACE-R total score (r = 0.504, p-value = 0.001) and the language skill score (r = 0.455, p-value = 0.002) was positively correlated with years of education (Figure 4).

Table 12. Correlation analysis of cognitive dysfunction.
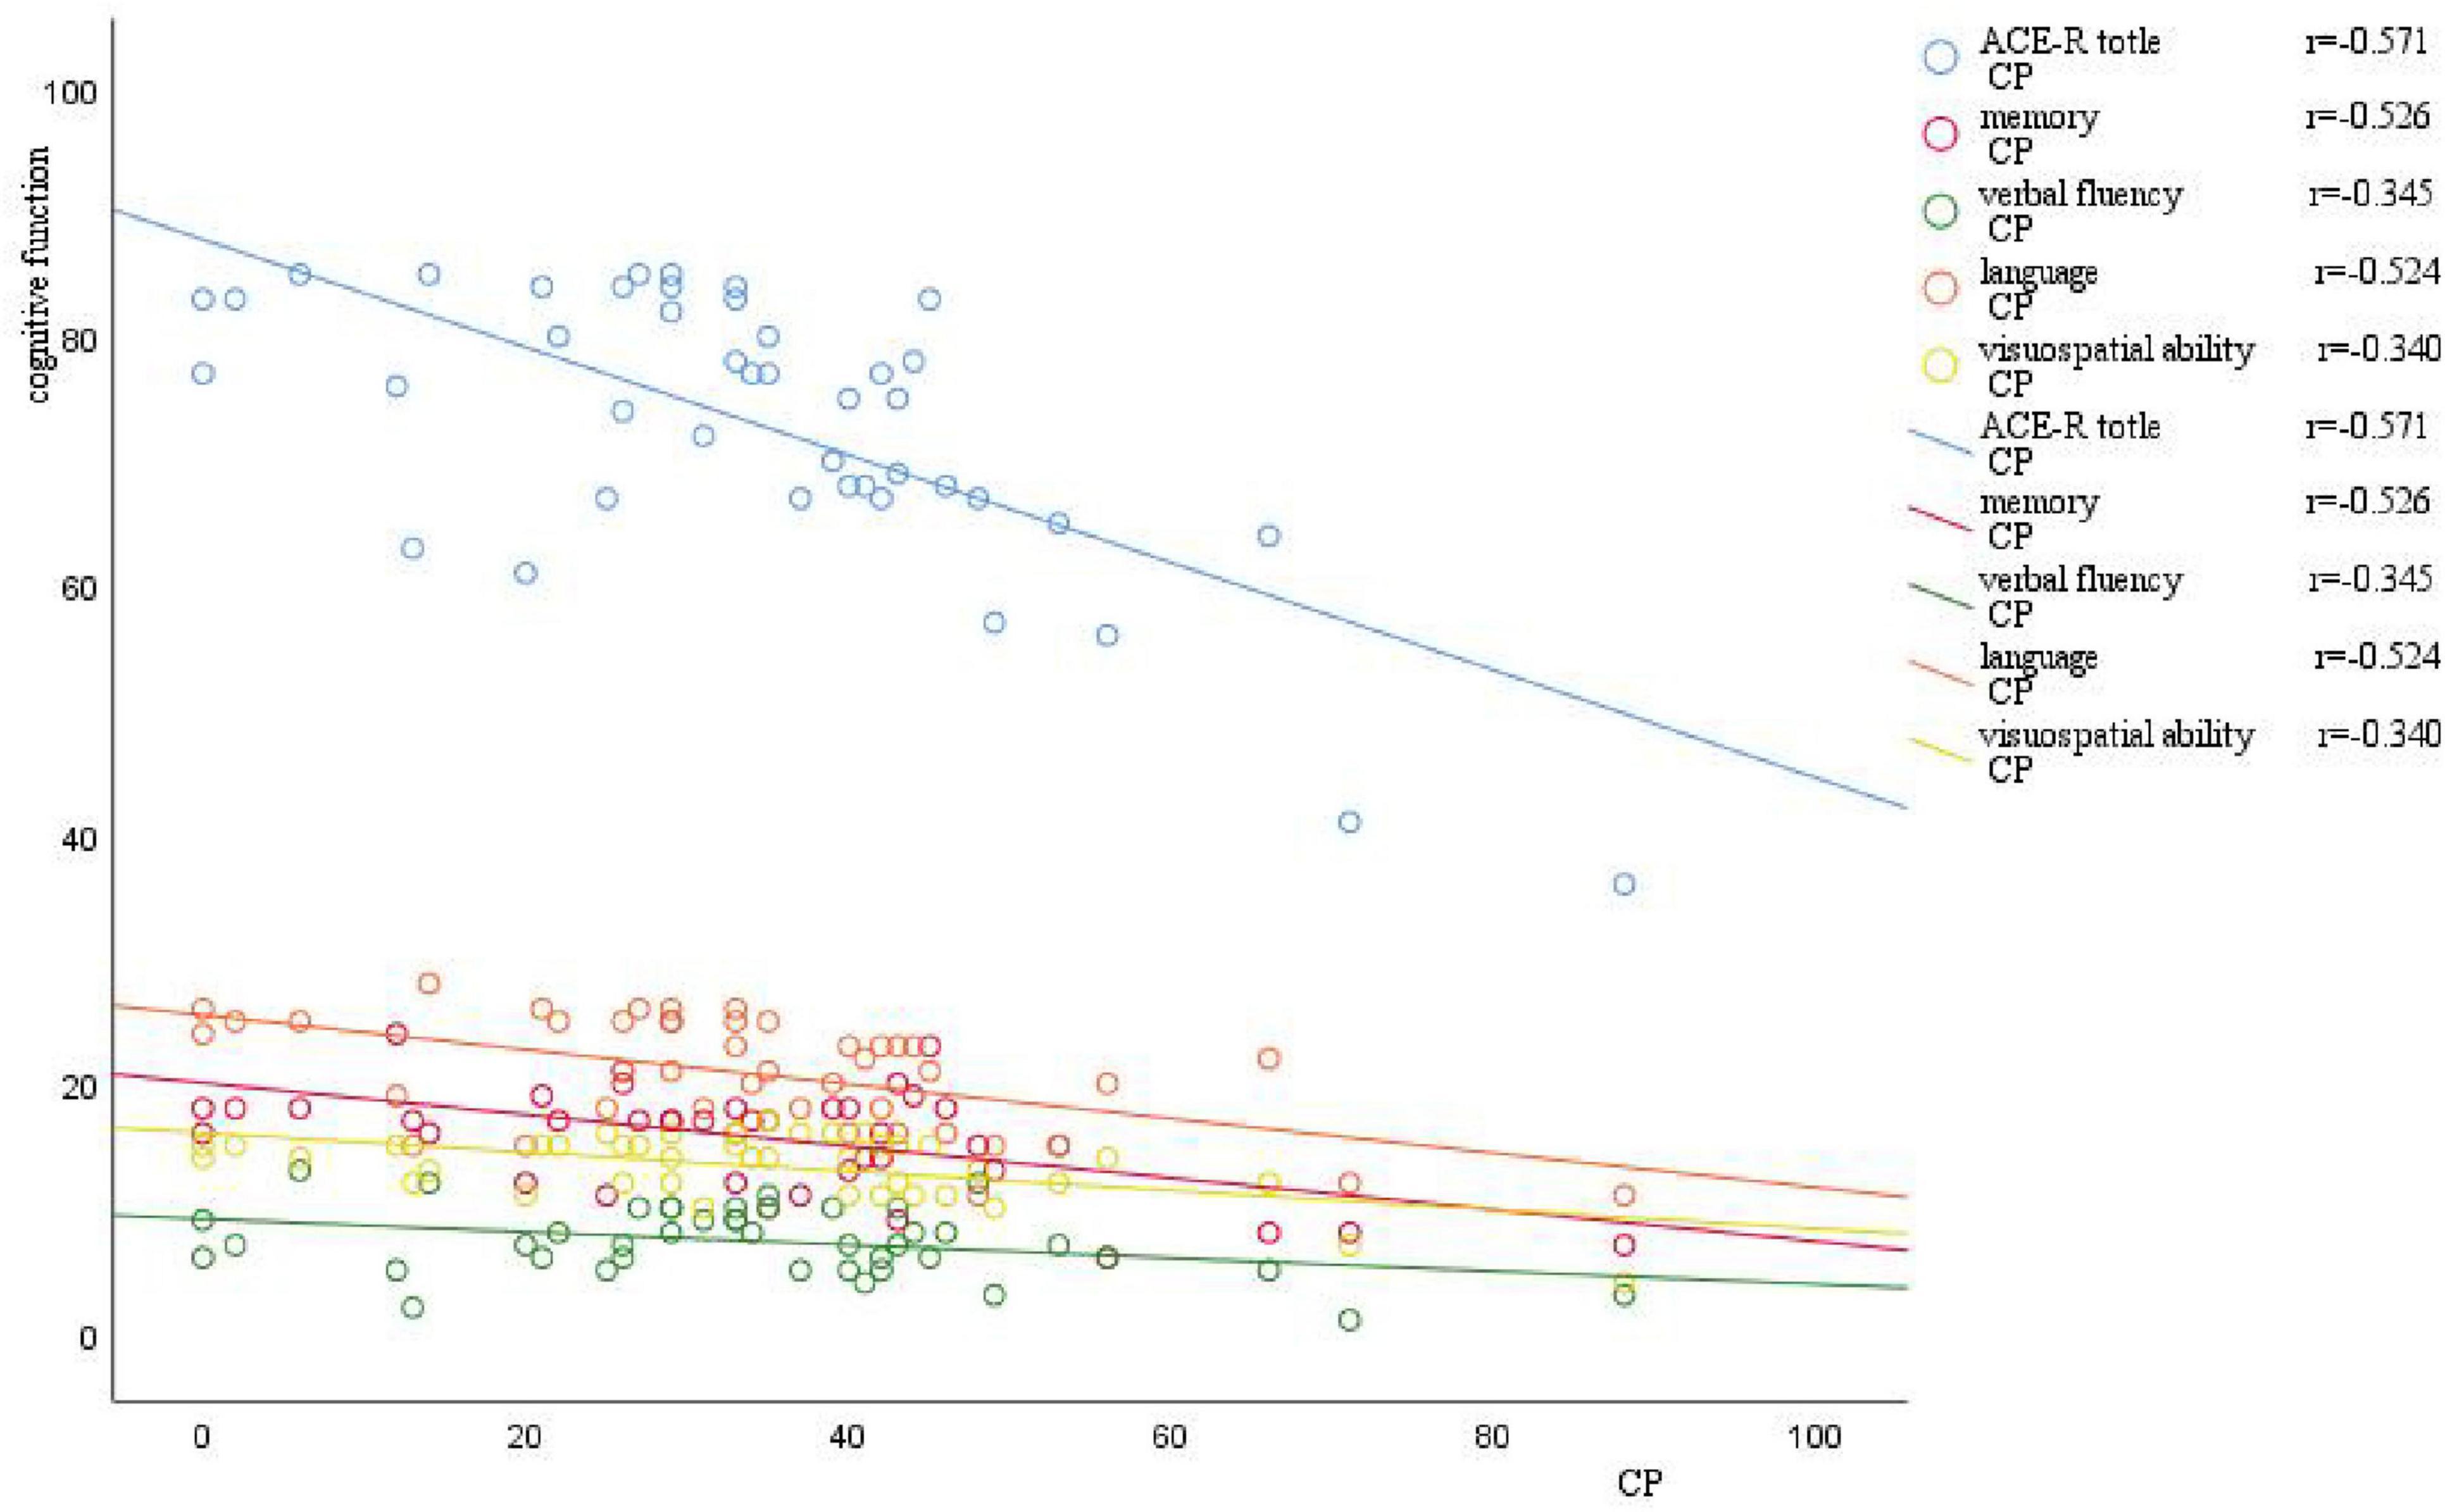
Figure 4. Scatter plot of correlation between CP value and cognitive function. The horizontal axis represents the CP value, and the vertical axis represents cognitive function. As the CP value increases, there is a varying degree of decrease in different domains of cognitive function.
3.6.3 Predictive analyses of CP value, age, years of education, and disease duration of VM for VM-related cognitive dysfunctionWe further drew ROC curves for VM-related cognitive dysfunction using CP value, age, years of education, and disease duration of VM (Figure 5) The AUC values were 0.860 (95% CI: 0.769–0.952), 0.706 (95% CI: 0.537–0.875), 0.311 (95% CI: 0.164–0.457), 0.663 (95% CI: 0.512–0.813), respectively. The corresponding p-values were 0.000, 0.012, 0.021, and 0.046. This indicated that the CP value, age, years of education, and duration of the VM disease had a certain predictive value for the cognitive dysfunction in VM, with cut-off values of 25.5, 33, 15.5, and 6.5, respectively (Table 13). Therefore, the diagnosis of VM-related cognitive dysfunction could be predicted when the CP value was greater than 25.5%, age was older than 33 years, years of education is less than 15.5 years, and disease duration of VM is longer than 6.5 years.
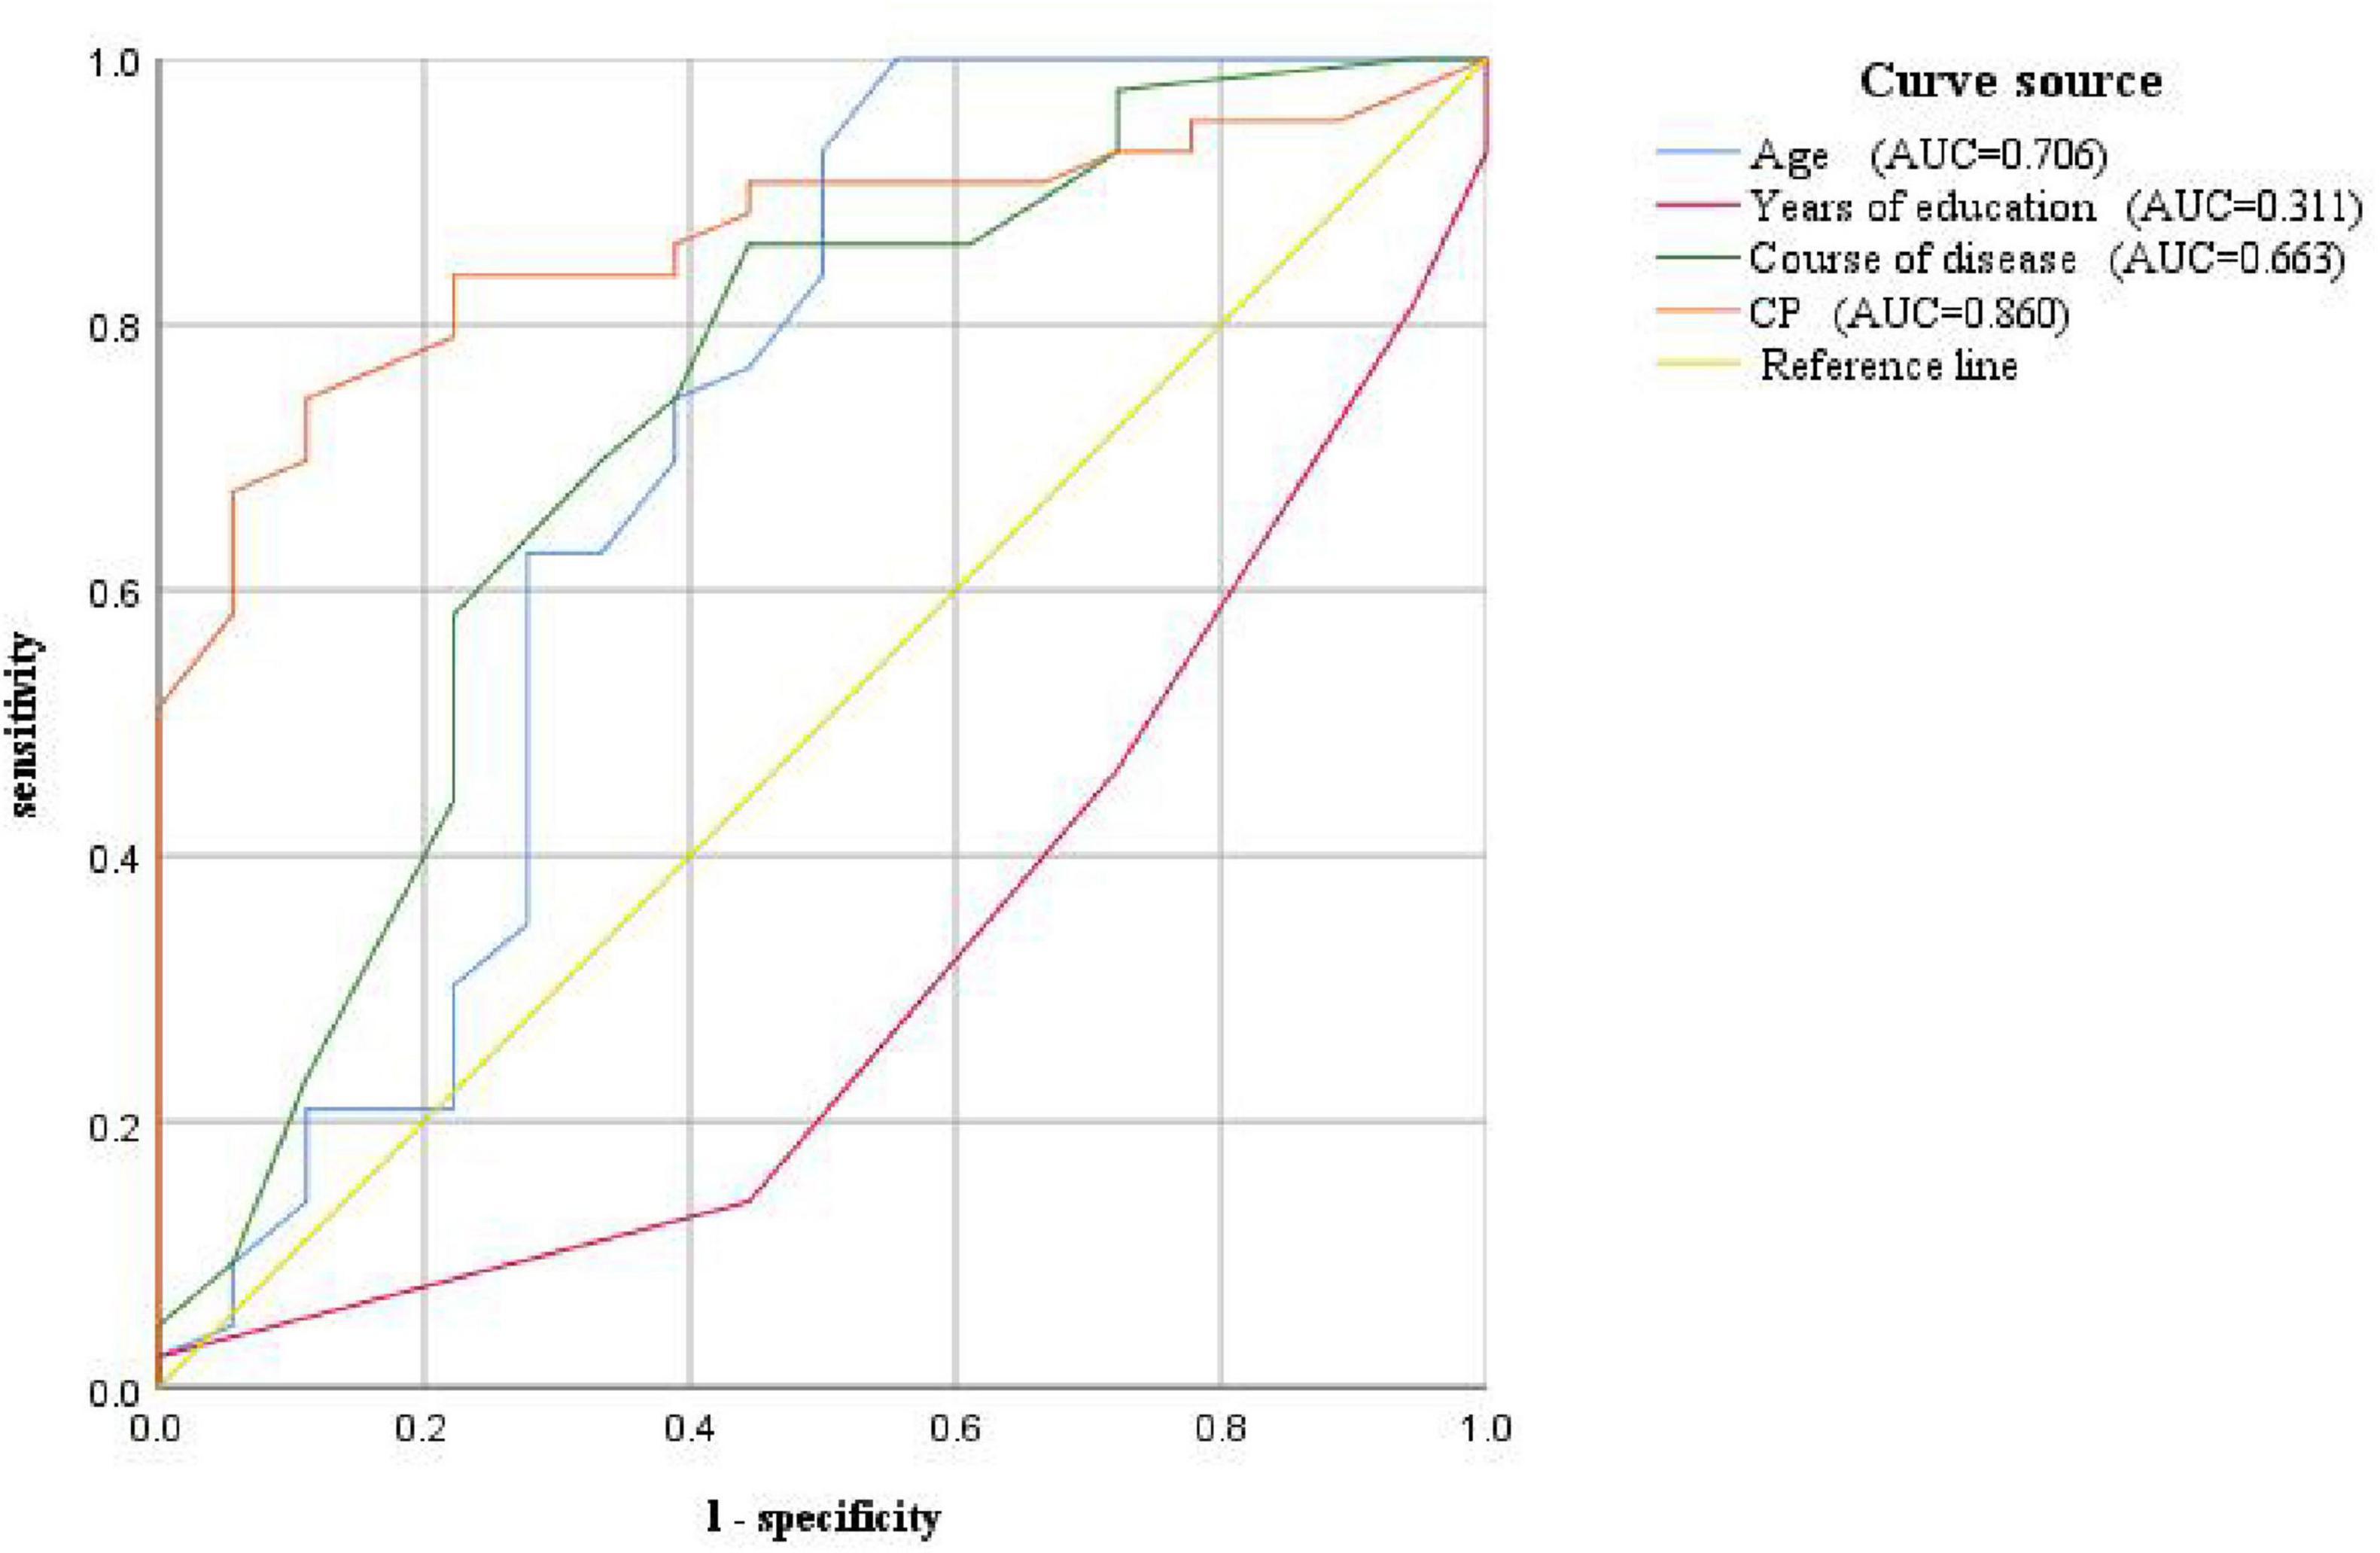
Figure 5. ROC curve for predicting VM-related cognitive impairment based on CP value, age, years of education, and disease course

Table 13. ROC curve of cognitive dysfunction related to VM diagnosis based on CP value, age, years of education, and disease course.
3.6.4 Analysis of the impact of DHI, HADS, PHQ-9, and GAD-7 scale scores on VM-related cognitive dysfunctionThere was no statistically significant difference in the DHI scale and anxiety/depression scales between the VM-CogD group and the VM-NoCogD group. Further subgroup analysis based on the total DHI score in VM-CogD revealed that the majority (23) of the 43 patients with VM-CogD exhibited moderate dizziness/vertigo. Patients with moderate dizziness/vertigo showed a negative correlation between ACE-R total score and the HADS-D score (p-value = 0.047), between memory score and the DHI total score (p-value = 0.008), the DHI-E score (p-value = 0.016), the HADS-D (p-value = 0.023), between language score and the DHI-F score (p-value = 0.031), between visuospatial ability score and the DHI-F score (p-value = 0.049) (Table 14). VM patients’ cognitive function was significantly lower in those with concomitant depression, vestibular dysfunction, and more severe dizziness. The correlation between DHI, HADS, PHQ-9, and GAD-7 scores and cognitive dysfunction was lower in patients who exhibited mild and severe dizziness/vertigo (| r| < 0.3). In patients with VM-CogD, those who exhibited moderate dizziness/vertigo showed the strongest correlation between CP values and ACE-R total score. Furthermore, the CP values were negatively correlated with memory and language function in patients with moderate dizziness/vertigo and memory in patients with severe dizziness/vertigo (Tables 15, 16).

Table 14. Correlation analysis of VM-CogD presenting with moderate dizziness/vertigo.

Table 15. Correlation analysis of VM-CogD presenting with mild dizziness/vertigo.

Table 16. Correlation analysis of VM-CogD presenting with severe dizziness/vertigo.
4 DiscussionOur study found that VM, a paroxysmal vestibular disorder, involves both peripheral and central vestibular dysfunction, primarily manifesting as nystagmus and abnormalities in the caloric test, Romberg test, and Unterberger test. Although the median age of VM patients (47 years) is lower compared to Alzheimer’s Disease (AD), VM patients also exhibit cognitive dysfunction, mainly affecting visuospatial function, memory, verbal fluency, and language skill. However, the overall degree of cognitive dysfunction is relatively mild, with a median ACE-R total score of 82 out of 100(82/100). Further analysis of the factors related to VM-associated cognitive dysfunction revealed that the patient’s age, years of education, duration of VM disease, severity of vestibular dysfunction, and comorbid anxiety and depression can all influence the cognitive function of VM patients.
The caloric test is one of the main vestibular tests, alongside other important assessments. It assess the function of the bilateral horizontal semicircular canals with low-frequency stimulation, and is more sensitive to mild asymmetries in bilateral vestibular function (Mezzalira et al., 2017). CP value is a parameter generally considered for peripheral vestibular lesions, representing unilateral canal paresis (Molnár et al., 2023a). The DP value represents unilateral hyperresponse and is often used in patients with Meniere’s disease (MD), as both hypofunction and hyperfunction can occur simultaneously in this condition. Additionally, the DP value can show dynamic changes at different stages of vestibular disorders, even presenting opposite results. To ensure consistency in the results, this study only used the CP value (Lin et al., 2009). The head-shaking test is a medium-frequency stimulus, and the presence of characteristic unidirectional or bidirectional nystagmus suggests peripheral vestibular damage, and the intensity of the nystagmus can also determine the degree of vestibular compensation (Deng et al., 2023). The head-impulse test is a high-frequency stimulus. The presence of a significant catch-up saccade typically indicates an abnormality in the patient’s vestibular-ocular reflex (VOR) pathway, suggesting peripheral vestibular dysfunction (Korda et al., 2020). Romberg’s test and Unterberger’s test are based on the vestibulospinal reflex (VSR) pathway. When a patient has central vestibular lesions, these tests may reveal swaying with eyes closed and a tendency to fall or lean to one side (Halmágyi and Curthoys, 2021; Hemm et al., 2023). The combination of nystagmus test, head impulse test, and test of skew is known as the HINTS triad and is widely used to identify various acute vestibular syndromes (Kattah, 2018). Combining the HINTS triad with a bedside hearing test forms the HINTS+ test, which can effectively distinguish between acute central and peripheral vestibular lesions, particularly
in the context of posterior circulation strokes (Tarnutzer and Edlow, 2023). Alterations in the nystagmus system are numerous and complex. The advent of videonystagmography (VNG) has enabled the recording and study of subtle nystagmus that cannot be detected by the naked eye. VNG can record nystagmus caused by different lesions in the vestibular system, such as peripheral, central, or mixed (Skóra et al., 2018).
Vestibular function tests are often crucial and informative for definitive diagnosis, whether the vestibular disorder is central or peripheral. Recently, Meniere’s disease (MD) has been recognized as a cochleo-vestibular disorder rather than a mere cochlear disorder. In the early stages of MD, there is a decrease in amplitude of cervical vestibular evoked myogenic potentials (cVEMP), and in the later stages, there is a significant canal paresis in caloric testing and gain asymmetry in the video head impulse test (vHIT) (Sobhy et al., 2019). MD also presents with various ocular motor abnormalities, including spontaneous nystagmus, gaze test, saccade test, smooth pursuit, and optokinetic nystagmus in VNG. Positional nystagmus is crucial for the diagnosis of benign paroxysmal positional vertigo (BPPV), as the changes in nystagmus in different positions can identify the affected semicircular canal (Ziemska-Gorczyca et al., 2024). Additionally, patients with BPPV may exhibit abnormalities in smooth pursuit and optokinetic nystagmus. Patients with vestibular neuritis exhibit spontaneous nystagmus, which is generally horizontal-torsional, direction-fixed, and enhanced by removal of visual fixation. They also exhibit abnormal positional tests (Moideen et al., 2023) as well as lesions in the VOR and VSR pathways (Strupp et al., 2022).
Continuing research has found that vestibular disorders can manifest with cognitive impairments. The mobile tablet-based Vestibular Cognitive Assessment System (VCAS) is a system that use electronic devices to build a three-dimensional spatial structure based on cognitive questionnaires to assess visuospatial function in patients with vestibular disorders. Its tests have found that patients with vestibular dysfunction exhibit impaired spatial memory and spatial navigation function (Huang et al., 2023b). Among the above indicators reflecting vestibular function, CP value were correlated with the degree of cognitive dysfunction in VM patients. The more severe the semicircular canal damage, indicated by a higher CP value, the more severe the memory, verbal fluency, language, and visuospatial dysfunction in VM patients. Previous studies had reported a high prevalence of cognitive impairment in patients with VM and concomitant vestibular migraine and Menière’s disease (VMMD). These patients reported significantly higher frequencies of cognitive dysfunctional symptoms such as brain fog and chronic fatigue compared to those with MD alone (Chari et al., 2021). However, another study on cognitive function in VM patients reached the opposite conclusion, suggesting that the cognitive function of VM patients is normal. The latter study used the MMSE scale to assess cognitive function (Demirhan and Celebisoy, 2023). In our study, we used the ACE-R to evaluate cognitive function, which was more objective than self-reported symptoms and had higher sensitivity for mild cognitive impairment compared to the MMSE. This made our findings on cognitive impairment of VM more convincing. Other studies had evaluated immediate memory, delayed memory, language function, attention, executive function, and visuospatial abilities in VM patients and found dysfunction in all these areas. These cognitive dysfunction were also found to be correlated with latency and error frequency of anti-saccade. Our results were consistent with these findings, but our study included a more comprehensive assessment of the entire ocular motor system, recording spontaneous nystagmus, positional nystagmus, gaze-evoked nystagmus, and abnormalities in smooth pursuit (Lu et al., 2024). Liu et al. (2019) developed a new scale, the Neuro-Otologic Vestibular Instrument (NVI), to assess cognitive function in patients with vestibular disorders. They found that VM patients had cognitive dysfunction which was correlated with anxiety and depression scales. Our study also supports this finding. However, the NVI cannot be applied to healthy individuals, making it impossible to compare with them during the study. Therefore, the conclusions about the characteristics of cognitive dysfunction in VM were relatively unreliable. The experimental design of our study, which included inter-group comparisons, enhances the reliability of our conclusions (Liu et al., 2019).
How does canal paresis affect cognitive function? On one hand, it may be related to the transmission of neural pathways and the activity of brain regions. The vestibular system is a complex structure involving multiple components. The peripheral vestibular organs sense angular acceleration and linear acceleration and integrate this multisensory information, which is transmitted to the vestibular nucleus complex (VNC). The VNC integrates incoming information from vestibular, visual and proprioceptive senses, which are processed in the thalamus and cerebellum and reach the vestibular cortex, where the body responds to the information. In addition to the above structures, the VOR reflex and VSR reflex pathways are also essential for maintaining visual clarity and postural stability during movement (Aleman, 2022). The vestibular system overlaps with the cognitive system to some extent, where the vestibular cortex, thalamus, cerebellum, and basal ganglia are collectively involved in the influence of the vestibular system on cognitive functions (Hebert and Filley, 2022; Hitier et al., 2014). The vestibular cortex is a complex structure containing the cingulate gyrus, parietal cortex, hippocampus, and retrosplenial cortex. Among these, the parietal-insular vestibular cortex (PIVC) is the core structure of the vestibular cortex, which is activated to varying degrees when the vestibular system is stimulated. Various regions of the vestibular cortex have been consistently found to be involved in many processes of visuospatial function, such as the retrosplenial cortex in navigation and path integration, the anterior parietal cortex in integrating vestibular input to help distinguish self-motion from the motion of external objects, and the hippocampus in adjusting spatial orientation information in real-time via place cells, boundary cells, grid cells and head direction (HD) cells. The cerebellum and thalamus receive projections from the vestibular nerve or VNC, integration this information, and then project it to the vestibular cortex, forming a complex vestibular-cognitive network that modulates cognitive function. The basal ganglia area also receives vestibular input and participate in spatial cognitive processes. Galvanic vestibular stimulation (GVS) can affect subjects’ visuospatial function by modulating spatial representations in the hippocampus and striatum, but this modulation shows gender differences. It enhances spatial learning ability in females, and increase sensitivity to location and boundary information in males. Spatial boundary information is mostly associated with hippocampal activity, and location information is associated with striatal activity (Hilliard et al., 2019). An interesting study found that astronauts experience a diminished ability to perceive time and space, leading to incorrect estimation of time intervals and spatial distances. This spatiotemporal perception disorder is associated with the vestibular system. The vestibular system continuously integrates visual, proprioceptive, and vestibular input to accuracy of time and spatial position. The right parietal cortex, hippocampus, entorhinal cortex, which are part of the vestibular cortex are involved in the regulation of temporal and spatial cognition. In microgravity environments, the speed of the object movement decreases, and the interaction between the optokinetic stimuli and the vestibular system is reduced. In addition, microgravity reduces peripheral vestibular input, leading to functional changes in the right parietal cortex, ultimately resulting in spatiotemporal perception disorders (Navarro Morales et al., 2023).
On the other hand, it may be related to the allocation of cognitive resources. It has been proposed that the sum of an individual’s cognitive resources for vestibular and cognitive functioning is fixed. When vestibular function is impaired or the demands of vestibular tasks are increased, the body reduces its allocation of resources to cognitive functioning, resulting in varying degrees of cognitive dysfunct
留言 (0)