
記住我


This study was designed as parallel-arm, active control, examiner masked, randomized controlled clinical trial investigating the soft tissue dimensional changes using conical and butt-joint implant-abutment connection type. The study was performed in accordance to the guidelines presented in the Helsinki Declaration of Ethical Principles for Medical Research. The manuscript was organized following the Consolidated Standards of Reporting Trials guidelines (CONSORT) (Fig. 1). All patients provided informed written consent to participate in this study. The study protocol was approved by the ethical committee of Charité University Hospital (application number: EA4_111_19). The study was registered in the ClinicalTrial.gov with identifier NCT06627023.
Fig. 1
The inclusion criteria were defined as follows: presence of a single tooth gap, completion of conservative and periodontal treatments, presence of diagnostic preoperative models and a recent panoramic radiograph not older than 6 months. The exclusion criteria were abnormal jaw anatomy (e.g., significant bone defects or malformations) and insufficient bone volume, abnormal bone conditions (such as cysts or tumors), abnormal findings in the oral mucosa (e.g., oral lesions or mucosal diseases), untreated periodontal disease, acute inflammatory diseases, pregnancy, temporarily contraindicated medication use, psychological contraindications such as substance abuse (alcohol or drugs), poor compliance, and general medical contraindications or conditions. All gathered datasets were anonymized and each participant was assigned a study number. A randomization was performed regarding the implant-abutment connection type, using a computer-generated list. Allocation concealment was ensured to prevent any bias through a secure online randomization system that provided assignment information only to authorized personnel at the time of patient enrolment. All enrolled patients were anonymized and each participant was assigned a study number. A priori power analysis based on the results of a previous study of Ramanauiskaite et al. revealed that 15 patients in the group is sufficient to detect difference of 0.36 mm with statistical power of 95% and α = 0.05.17
Virtual implant planningThe patients who were admitted to participate in the study were guided through the following scheme: initially, cone beam computed tomography (CBCT) of respective jaws with an individually adjusted volume of mostly 100 × 50 mm (Veraviewepocs 3D R100, Morita, Kyoto, Japan) was performed and exported in Digital Imaging and Communications in Medicine (DICOM) format. Subsequently impressions with a vinyl polyether silicone (EXA’lence; GC, Tokyo, Japan) were required and a master model was cast from type IV plaster (SHERAHARD-ROCK, SHERA Werkstoff-Technologie GmbH & Co, Lemförde, Germany). Thereafter, analogue wax-ups of the missing teeth were performed. Both, initial situation and wax-ups were digitized using a laboratory scanner (D2000, 3Shape, Copenhagen, Denmark) and exported in Standard Tessellation/Triangulation Language (STL).
Virtual implant planning was performed by matching of DICOM and STL datasets from digitized master models and wax-ups in two different implant planning software. SMOP software (Swissmedia AG, Baar, Switzerland) was used for butt-joint group (CAMLOG SCREW LINE Promote plus) and coDiagnostiX® (Dental Wings GmbH, Chemnitz, Germany) for conical connection group (Straumann Bone Level Tapered). Surgical guides were designed by specialist from respective companies and STL files were provided for 3D printing with stereolithography (SLA) technique (Form 3, Formlabs, Sommerville, Massachutes, USA).
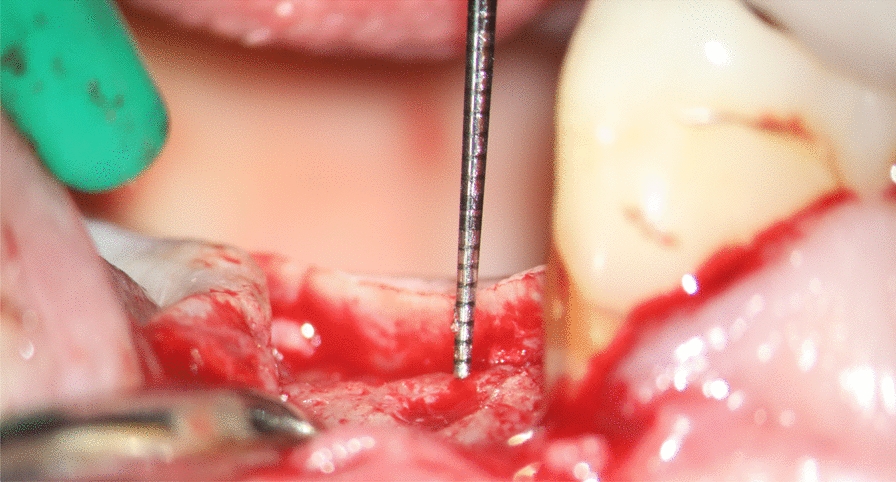
Implant placementIn the butt-joint group the CAMLOG SCREW LINE Promote plus implants were placed. In the conical group Straumann Bone Level Tapered were placed. In both cases the implants were placed with the 30–40 Ncm torque. The supracrestal dimension was respected, so that the distance between the platform and soft tissue margin was at least 4 mm. In case of butt-joint connection, if the implant was placed subcrestaly, the surrounding bone was profiled using a special bur, in order to avoid bone remodelling in the healing phase. In case of conical connection, the subcrestaly placed implants were left as is. All implants had at least 1.5 mm of surrounding bone. After dental implant placement, a closed healing approach was applied. Wounds were stitched with one horizontal mattress suture (Prolene 5.0, Johnson and Johnson, Norderstedt, Germany) and at least three single sutures (Prolene 6.0, Johnson and Johnson, Norderstedt, Germany).
Implant exposureSecond stage surgery was performed three to six months after implant installation. Prefabricated healing abutments were placed (CAMLOG wide body healing abutment and Straumann conical healing abutment). No suturing was performed after uncovering. Two weeks after exposure the positions of dental implants were scanned using an intraoral scanner (IOS) (Trios3, 3Shape, Copenhagen, Denmark) and sent to the in-house dental laboratory of Charité University Hospital. The final screw-retained crowns were made from a high-strength glass-ceramic (Suprinity®, Vita Zahnfabrik Bad Säckingen, Germany) and were screwed with either a torque of 20 NCm (CAMLOG) or 35 NCm (Straumann) followed by closure with teflon tape and composite.
Follow-up and 3D data gatheringAll intraoral scans were performed by a single calibrated operator with the same IOS (Trios3, 3Shape, Copenhagen, Denmark). The first scan was made before surgery, then immediately after implant placement and at key intervals during the healing process (e.g., 14 days post-op, immediately after exposure), two weeks after exposure (pre-delivery), immediately after delivery of the final crown and at 6 and 12 months after implant placement (Fig. 2). The scans were performed in adherence to the manufacturers recommended scanning strategy [18]. At any stage of follow-up intraoral scans were performed prior to local anaesthesia in order to exclude any influence of the injection on the soft tissue volume. The follow-up period was measured from the day of implant insertion, establishing a maximum follow-up of 12 months after implant placement. The healing abutment phase lasted an average of 2.3 months, and an average of 7 months elapsed between the integration of the final crown and the last scan.
Fig. 2
Timeline of intraoral scans divided into three main groups: implant healing phase, exposure with healing abutment placement, and crown delivery. For each group an STL data was obtaines using IOS
Gathered data post-processingA trained and calibrated specialist performed data post-processing of the STL datasets. The STL files were trimmed to focus on the peri-implant soft tissue, excluding the healing abutment and implant crowns using Blender software (Blender Foundation, Amsterdam, Netherlands) to avoid interference in the matching process. Two STL datasets from each matching group (Fig. 2) were imported into Geomagic Control X (3D Systems, Morrisville, North Carolina) for analysis.
Data analysesTwo of the processed STL datasets of a corresponding matching group (Fig. 2) were imported into the metrology software Geomagic Control X (3D Systems, Morrisville, North Carolina). The matching process had two stages. First, a pre-matching step was conducted using the “transform fit” tool, which aligned the datasets by selecting four distinctive points on the adjacent teeth. Then, the segmented teeth were used as a reference surface for final alignment using the “best fit” tool.
Next, the differences between the STL datasets around the implant site were digitally measured (Fig. 3). The analyzed region extended 4 mm caudally from the middle of the adjacent teeth, with a straight-line tolerance of ± 0.1 mm, ensuring measurements remained within the attached gingiva. A heat map was generated to qualitatively show positive and negative deviations in soft tissue relief. While linear measurements were primarily used, this method was deemed appropriate for the objectives of the study. For the quantitative analysis, the maximum and average mean differences in the marked areas were measured (in mm).
Fig. 3
Primary outcome of tghe study: sigificantly higher soft tissue groth in conical connection type compared to butt-joint
For the qualitative analysis a heat map was generated to depict the negative and positive deviations regarding the soft tissue relief. For the quantitative analysis in the marked area the following parameters were obtained and used to compare the soft tissue relief: maximum mean difference and average mean difference in mm.
In order to analyse the papillae, the selected region was divided into 4 areas: mesio-vestibular, disto-vestibular, disto-oral, and mesio-oral. Each papilla was defined by a line extending 2 mm caudally from the top of the respective papilla (Fig. 4). From this point, the area in the ventro-dorsal direction was selected, reaching up to the sulcus of the implant crown and the respective neighbouring tooth. Subsequently, a 3D comparison was conducted using the same method as for analysing the peri-implant soft tissue as described above.
Fig. 4
The examined area was extended from the papilla tip of the respective neighbouring tooth to 2 mm caudal and ventro-dorsal to the sulcus of the implant crown
Special anamnesisFor all enrolled patients a detailed medical historywas collected, including following parameters: sex, region, brushing, mouth rinsing, flossing, alcohol consumption, stress, periodontitis therapy, gingival biotype.
Statistical analysesAll gathered data were statistically analysed in JMP 14 (SAS Corp., Heidelberg, Germany). Firstly, soft tissue measurements were tested for normal distribution by goodness of fit with the Shapiro-Wilk test. For non-normally distributed data the statistical difference was analysed by using Wilcoxon test. The threshold for significance was defined as a p-value less than 0.05.
留言 (0)