Retinal regeneration upon acute damage occurs spontaneously in zebrafish, but not in mammals. Due to their intrinsic regenerative capacity, zebrafish serve as an important model organism to study retinal regeneration with translatable findings (Todd et al., 2021; Jorstad et al., 2020; Jorstad et al., 2017; Ueki et al., 2015; Pollak et al., 2013; Lahne et al., 2020; Rueda et al., 2019; Yao et al., 2016; Wohlschlegel et al., 2023). It is now recognized that Müller glial responses underlie the disparate regenerative outcomes in zebrafish compared to mammals. In zebrafish retina, Müller glia (MG) respond to acute retinal damage by re-entering the cell cycle to produce a proliferating pool of neuronal progenitors (Bernardos et al., 2007; Nagashima et al., 2013; Fausett and Goldman, 2006; Fimbel et al., 2007; Thummel et al., 2008). However, in mammals Müller glia instead enter a gliotic response with severely limited ability to produce neuronal progenitors (Bringmann et al., 2009). Inflammation has emerged as a key regulator of the zebrafish Müller glial response to retinal damage (Zhang et al., 2020; White et al., 2017; Silva et al., 2020; Nagashima and Hitchcock, 2021; Iribarne and Hyde, 2022; Bludau et al., 2024). Cellular sources of inflammatory signals presumably include the microglia, which are the resident immune cells of the vertebrate retina. In support of such a role, microglia express many inflammatory cytokines (Mitchell et al., 2019; Hoang et al., 2020) and microglial manipulations have been shown to have effects on the Müller glial regenerative response in mouse (Todd et al., 2020), chick (Fischer et al., 2014), and zebrafish (White et al., 2017; Conedera et al., 2019). In addition, immunosuppressant treatments alter the kinetics of zebrafish retinal regeneration (White et al., 2017; Silva et al., 2020; Bludau et al., 2024). Despite these findings, direct connection of microglia-specific inflammatory factors as drivers of MG responses is still not well established. Though certain cytokines may be involved (Zhao et al., 2014; Lu and Hyde, 2024; Nelson et al., 2013), the cell types producing these cytokines and the timing of expression remain poorly defined. Moreover, intracellular pathways activated to stimulate such signals from microglia are currently unknown.
Temporal control of inflammatory signals and the downstream responses that are induced are likely important for transitioning from quiescence to the initial damage response then to a regenerative phase. Indeed, the regulation of Nfkb transcriptional activity, which is induced by inflammatory signaling through numerous cell surface and intracellular receptors, likely influences the outcome of Müller glial responses in the mouse and chick (Palazzo et al., 2020; Palazzo et al., 2022). Numerous innate immune receptors detect ligands such as those released from damaged cells and activate intracellular pathways culminating on NfkB signaling and cytokine production, and cytokine signaling may continue to regulate inflammatory responses downstream of the initial stimulus.
Toll-like receptors (TLRs) and IL-1 family receptors are membrane bound innate immune receptors known to activate a shared intracellular molecular adaptor, MyD88 (Deguine and Barton, 2014; Warner and Núñez, 2013). Beyond these canonical activators of MyD88, MyD88 may also participate in other immune response pathways (Chen et al., 2022; Sun and Ding, 2006; Liu et al., 2011). MyD88 activates signaling cascades resulting in transcriptional and cellular responses in cells responding to extracellular signals including damage-associated molecules (Deguine and Barton, 2014; Warner and Núñez, 2013). Nfkb is one of several transcription factor families activated downstream of MD88 signaling (Deguine and Barton, 2014). The MyD88 pathway is an important response mechanism in macrophages and plays a role in microglial responses (Esen and Kielian, 2006). Several cytokines found to be important in regulating regenerative responses (Lu and Hyde, 2024; Hasegawa et al., 2017; Tsarouchas et al., 2018; Nguyen-Chi et al., 2017) are known to be induced downstream of MyD88 signaling and Nfkb activation. Further, constitutively active MyD88 signaling has effects on cell proliferation and survival in cancer (Wang et al., 2014; Ngo et al., 2011).
In this paper, we focused on the effects of overactivation of MyD88 signaling in microglia and macrophages on the Müller glial regenerative response in the zebrafish retina. We became interested in MyD88 regulation in microglia because transcriptomic datasets suggest it could be regulated temporally in microglia responding to damage in the central nervous system (Mitchell et al., 2019; Oosterhof et al., 2017), Figure 1. We hypothesized that forcing inflammatory signals from microglia via sustained MyD88 signaling during retinal regeneration would alter the outcome of Müller glia-mediated regenerative responses. To test our hypothesis, we generated transgenic zebrafish in which forced MyD88 signaling occurs cell-selectively in microglia and macrophages. Using these transgenic fish, we examined the MG-mediated regenerative response triggered upon neurotoxin-induced death of inner retinal neurons. We analyzed the acute damage response, production and proliferation of MG-derived progenitors, and early regeneration of inner retinal neurons. Our results indicate that regulation of inflammatory signals produced by microglia and macrophages partly drive the temporal transition from inflammatory/proliferative to regenerative responses. In addition, our results indicate that the downstream signals from MyD88 activation in microglia/macrophages impact the survival of regenerated retinal neurons.
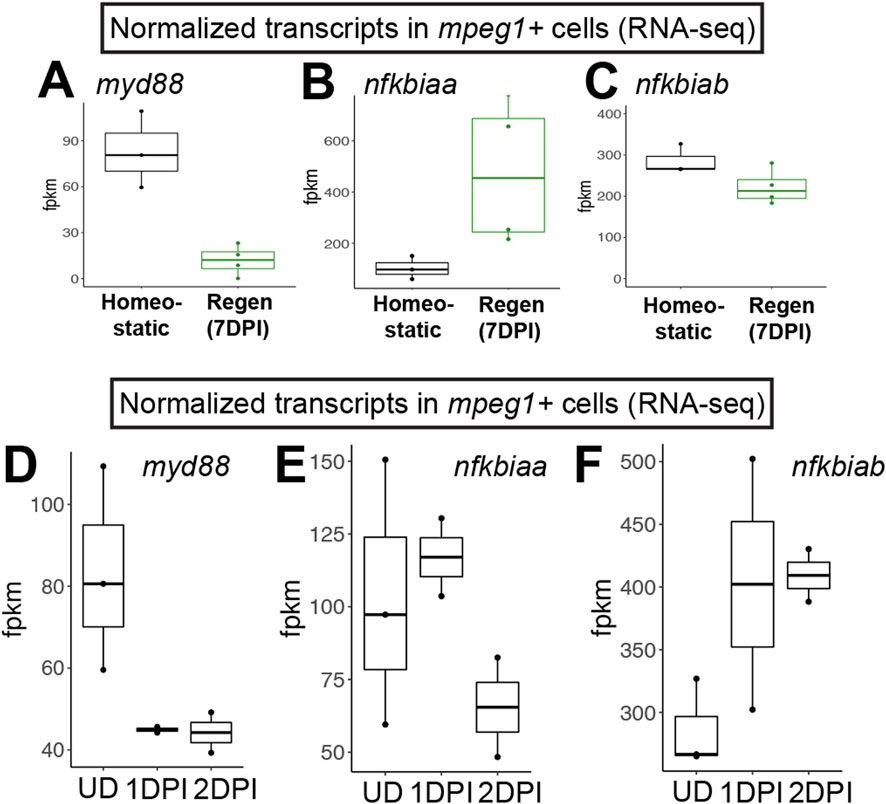
Figure 1. RNA-seq indicates downregulation of myd88 in mpeg1+ cells during retinal regeneration and upon CNS damage. Normalized transcript counts (fragments per kilobase million, fpkm) of myd88 (A), nfkbiaa (B), nfkbiab (C) in mpeg1:GFP+ cells isolated from undamaged zebrafish brain [homeostatic (Oosterhof et al., 2017)] or regenerating zebrafish retinas [Regen (7DPI) (Mitchell et al., 2019)]. Normalized transcript counts (fragments per kilobase million, fpkm) of myd88 (D), nfkbiaa (E), nfkbiab (F) in mpeg1:GFP+ cells isolated from undamaged (UD) or acutely damaged zebrafish brain at 1 or 2 days post injury (1DPI, 2DPI) using transcriptome data from (Oosterhof et al., 2017). Fish used in the retina sequencing study were 10–12 months old (Mitchell et al., 2019); fish used in the brain study were 3 months old (Oosterhof et al., 2017).
Materials and methodsZebrafishProcedures using zebrafish were performed at the University of Idaho in compliance with IACUC (Institutional Animal Care and Use Committee) approved protocols. Zebrafish (Danio rerio) were maintained on a 14:10 light:dark cycle in 28°C recirculating, monitored system water. Zebrafish were housed and propagated according to (Westerfield, 2007). Zebrafish lines used include mpeg1:GFP (Ellett et al., 2011) (gl22Tg, originally obtained from Zebrafish International Resource Center, ZIRC), mpeg1:mCherry (Ellett et al., 2011) (gl23Tg, originally obtained from ZIRC), 6xHSA.NFKB:EGFP (Kanther et al., 2011) (nc1Tg, obtained from ZIRC, referred to throughout the manuscript as NfkB::gfp), and mpeg1:myd88-2A-mCherry (uoi2505Tg, generated in-house, described below). All lines were bred to (at least 8 generations) or generated using an in-house “wildtype” strain that was originally obtained from Scientific Hatcheries (now Aquatica Tropicalis). Zebrafish used were of both sexes and ranged in age from 4–21 months. Prior to tissue collection, fish were euthanized by extended immersion in tricaine solution (0.25 mg/mL).
Generation of the mpeg1:myd88-2A-mCherry transgenic line (uoi2505Tg): The zebrafish myd88 cDNA sequence (NCBI NM_212814.2) was amplified from cDNA generated from mRNA isolated from whole zebrafish retinas. Primers in the PCR reaction were designed to selectively amplify myd88 and included restriction sites for EcoR1 and NotI (Forward: 5′-TAAGCAGAATTCATGGCATCAAAGTTAAGTATAGACCA-3′, Reverse: 5′- TAAGCAGCGGCCGCGGGCAGTGAAAGTGCTTTGGC-3′). The PCR amplicon was excised from the agarose gel after electrophoresis and purified using the NEB Monarch Gel Extraction Kit, then digested with EcoR1 and NotI (NEB). The amplicon was ligated into pME-MCS (also previously digested with EcoR1 and NotI) using Promega T4 DNA Ligase. After transformation and plating, colonies were selected for liquid cultures and plasmid minipreps purified using the Qiagen QIA Prep Spin Minprep Kit. Plasmids with correct size inserts were sequenced by Sanger sequencing. The transgenesis vector was created by using Gateway LR reaction with p5E-mpeg1.1 (Don et al., 2017) (plasmid 75023 obtained from Addgene), pME-myd88, 543-p3E-2A-mCherrypA (Villefranc et al., 2013) (plasmid 2603 obtained from Addgene), and pDEST-Tol2CG2 as described in (Kwan et al., 2007). After transformation and colony selection, transgenesis constructs with the proper inserts and orientation were identified by Restriction Enzyme digestions. Single cell stage zebrafish embryos were injected with ∼0.5–1 nL of the transgenesis construct mixed with Tol2 mRNA at 25 ng/μL final concentration. F0 founders were selected based on expression of GFP fluorescent hearts, grown to adults, then outcrossed with wildtype fish. F1 fish were identified by germline inheritance of GFP+ hearts, reared to adults, then again outcrossed to wildtype to obtain F2 with stable integration. F2 lines were examined and selected for mCherry fluorescence in microglia and ∼50% transgene segregation upon outcross to non-transgenic partners. Fish were bred to F3 generation and later for experiments. Fish of the uoi2505Tg transgenic line were healthy and viable to adult age with similar survival rates to other lines used in this study.
Retinal lesionRetinal lesions were performed by intravitreal injection of the neurotoxin ouabain (ouabain octahydrate, Sigma-Aldrich) as described in previous publications (Mitchell et al., 2019; Mitchell et al., 2018) and extensively detailed in (Mitchell and Stenkamp, 2023), using 40–80 µM ouabain working solutions prepared in 0.65% sterile saline (NaCl) to induce the death of inner retinal neurons. Injections were performed with a blunt-end calibrated 10 μL Hamilton syringe, 26 s gauge, point style 3. Lesions were unilateral and only the right eye was injected. Saline injected retinas served as additional controls; these fish received an intravitreal injection of 0.65% sterile saline (NaCl, vehicle) solution in the right eye. Prior to and during the procedure, fish were continuously anaesthetized with tricaine in water solution (0.25 mg/mL). Immediately after the procedure, fish were returned to clean tanks with clean system water for revival and recovery. All fish receiving such injections fully recovered from the procedure.
Tissue fixation and processing for retinal cryosections for TUNEL and immunofluorescent stainingOcular enucleation was performed using fine forceps, whole eyes were then transferred to PBS (phosphate-buffered saline), followed by cornea puncture and lens removal. Eyes were fixed in phosphate buffered, 4% paraformaldehyde containing 5% sucrose at 4°C for 16–20 h with constant rocking. Eyes were then washed in a graded series of phosphate-buffered solution (pH = 7.4) of 5% sucrose to 20% sucrose. The following day, tissues were washed in a 1:2 solution of OCT embedding medium (Sakura Finetek) and phosphate buffered, 20% sucrose at room temperature (RT) for 30 min. After the wash, eyes were embedded in fresh 1:2 solution of OCT embedding medium (Sakura Finetek) and phosphate buffered, 20% sucrose and frozen by immersion in 2-methylbutane supercooled with liquid nitrogen. After freezing solid, the tissue blocks were stored at −20°C for at least 24 h prior to sectioning. Eyes were sectioned at 10 µM thickness using a Lieca CM3050 cryostat and mounted onto glass slides (FisherBrand Superfrost Plus Microscope Slides). Tissue sections underwent overnight desiccation and were then stored at −20°C until use.
Tissue fixation and processing of whole retinas for immunofluorescent stainingFish were dark adapted for approximately 12 h and ocular enucleation was performed using fine forceps. Whole eyes were then transferred to PBS, followed by cornea puncture and lens removal. Retinas were isolated from the whole eye cup and retinal pigmented epithelium (RPE) was removed prior to PBS rinses. Retinas were fixed in phosphate buffered, 4% paraformaldehyde in PBS at 4°C for 16–24 h with constant rocking. Post fixation, retinas were washed several times in PBS with 0.01% Triton-X-100 (PBST) and dehydrated in a graded series of methanol washes prior to storing at −20°C in 100% methanol until use.
Immunofluorescence staining of retinal cryosections and whole retinasRetinal cryosections were thawed in a humidified chamber for 10 min at RT followed by a 1 h blocking period with 1% normal donkey serum (NDS), 0.1% sodium azide in PBS-Triton-X-100 (PBST). Retinal cryosections were stained overnight at 4°C with primary antibodies in an antibody dilution buffer, PBST, 1% NDS, and 0.1% sodium azide. Following incubation, retinal cryosections were washed in PBST at RT for 30 min then stained with secondary antibodies and 4′,6-diamidino-2-phenylindole (DAPI) diluted in antibody dilution buffer at RT for at least 1 h. Following secondary incubation, retinal cryosections underwent a second 30-min PBST wash and multiple PBS rinses. Coverslips were mounted using an antifade mounting media (Vectashield Vibrance).
Whole retinas were rehydrated in a series of PBST washes at RT prior to a 1 h blocking period with 1% normal donkey serum (NDS) and 0.1% sodium azide in PBST. Retinas were stained over night at 4°C with primary antibodies in an antibody dilution buffer (PBST, 1% NDS, and 0.1% sodium azide). Following incubation, retinas underwent a series of PBST washes at RT prior to the secondary staining. Secondary antibodies and DAPI were diluted in antibody dilution buffer, staining was performed at RT for 2 h. Retinas were then washed in a series of PBST, followed by a PBS wash. Four radial incisions were made in the retina to allow for a flat mount. Coverslips were mounted using an antifade mounting media (Vectashield Vibrance).
Primary antibodies and dilutions used are as follows. Rabbit polyclonal anti-zebrafish L-plastin (Guyader et al., 2008) (1:10,000, a kind gift from Dr. Michael Redd), rat anti-PCNA (1:200, Chromotek, Cat 16d10, Lot 090428013AB), mouse 4C4 antibody (1:100, used as hybridoma supernatant, hybridoma 7.4.C4 sourced from Sigma-Aldrich used to stain zebrafish microglia, Cat 92092321, Lot 15B027), mouse anti-GFAP (1:100, ZRF1 obtained from ZIRC, ZDB-ATB-081002-46), mouse anti-Glutamine Synthetase (1:100, BD Biosciences, Cat 610517, Lots 1340268, 3166939), mouse anti-Neurolin/DM-GRASP/Alcama (1:500, Zn-5 (also known as Zn-8), obtained from ZIRC, ZDB-ATB-081002-22), chicken anti-GFP (1:1000, Abcam, Cat AB13970, Lot 1018753-23), Rabbit anti-HuC/D (1:200, AbCam Cat AB210554, Lots GR3445684-5, GR3208493-3). Detection of PCNA required a citrate antigen retrieval prior to immunolabeling. Antigen retrieval was performed as detailed in (Lovel and Mitchell, 2023). Post antigen retrieval, retinal cryosections entered a blocking step using a 20% NDS, 0.1% sodium azide, in PBS-Triton-X-100 for 1 h at RT.
Secondary antibodies and dilutions used are as follows. Donkey anti-mouse FITC, donkey anti-rabbit FITC, donkey anti-mouse Cy3, donkey anti-rabbit Cy3, donkey anti-mouse Alexa-Fluor647, donkey anti-rabbit Alexa-Fluor647, donkey anti-Chicken Alexa-Fluor488, donkey anti-Chicken Alexa-Fluor647 (Jackson ImmunoResearch), donkey anti-rat Alexa-Flour647 (Thermo Scientific), and goat anti-mouse Cy7 (AAT Bioquest) were used at 1:200 dilution. DAPI was used at 1:1000 dilution in all stains and added to the secondary antibody solution.
TUNEL (Terminal deoxynucleotidyl transferase dUTP nick end labeling) staining (Roche, Fluorescein Green Kit and TMR Red Kit, Cats 11684795910, 12156792910) of retinal cryosections was performed using Roche manufacturer’s instructions. Prior to immunolabeling, retinal cryosections were thawed in a humidified chamber at RT for 10 min and washed in PBS for 20 min. Retinal cryosections underwent permeabilization for 2 min in a chilled 0.1% Triton-X-100, 0.1% sodium citrate solution on ice. Slides were then washed twice in PBS for 5 min prior to undergoing the TUNEL reaction. TUNEL reactions were performed at 37°C for 3 h in a humidified chamber following the manufacturer’s instructions. Following the reaction, slides were rinsed in PBS for 5 min three times. Immunolabeling procedure was performed following TUNEL labeling, beginning at the blocking step.
Microscopy and image acquisitionImages were captured using a Nikon Andor X1 spinning disk confocal microscope or Nikon CrestOptics X-Light confocal microscope, both equipped with BSI Express 16-bit sCMOS camera and utilizing Nikon Elements software. Imaging was performed using a Plan Apo λ 20X Air 0.75 NA DIC or CFI APO LWD 40x water immersion 1.15 NA λ S DIC N2 objectives. Z stacks were acquired in 2–3 µm intervals. For cryosections, one control retinal cryosection was used to determine optimal image acquisition settings for laser power and exposure. For whole retinas, a small segment of one control retina was used for selection of optimal image conditions. Image viewing and processing was performed with Nikon Elements software and ImageJ (Fiji).
Quantification of cell types in retinal cryosections from confocal imagesQuantification of cells across timepoints was performed using ImageJ (Fiji). Leukocytes (including microglia), TUNEL+ cells, PCNA+ cells, and HuC/D+ inner retinal neurons were quantified within the retina in individual z stacks in the image. Cells that were L-plastin+ were counted as leukocytes and counts were reported based on the region of interest (ROI) area or to a specified curvilinear distance of the ROI. Total number of TUNEL+ cells were counted and normalized to the ROI area or curvilinear distance. For certain timepoint(s) L-plastin+ cells were also scored for nuclear PCNA signal. HuC/D+ inner retinal neurons were counted as those with HuC/D+ signal surrounding DAPI+ nucleus. Counts were performed using images from central retinal regions and excluded regions at the peripheral edges and optic nerve head (ONH).
Quantification of total PCNA+ DAPI+ cells was achieved using a partially automated Python script run through a Windows command shell. The script is available upon request. Image data was read using Python package Nd2reader. ROI selection required non-automated, user defined input, using a data visualization library called Matplotlib (Hunter, 2007). Image filters (unsharp, Gaussian blur, and edge detection) were applied to the images using the Sci-Kit Image library (Walt et al., 2014). Multiple thresholding techniques (multi-Otsu, Otsu, and local) using The Open-CV library were then applied to perform further segmentation of cells. Signal from channels associated with DAPI or PCNA less than 15 square pixels in area were excluded to avoid quantification of artifacts. To obtain cell counts, signals from both DAPI and PCNA channels were overlayed using a binary logical “AND” algorithm, implemented using Numpy (Harris et al., 2020). Objects with PCNA and DAPI co-localization meeting the criteria were reported based on curvilinear distance in the retinal cryosection.
RNA isolation, cDNA synthesis, and quantitative PCR (RT-qPCR)RNA was extracted from whole retinas; either undamaged or following injections of either saline or ouabain. Retinas dissected were processed individually, there was no sample pooling. Retinas were immediately transferred to and homogenized in the RNA lysis solution using a handheld homogenizer (Bio-Gen Series PRO200, Pro Scientific), then stored at −80°C for a maximum of 1 week, until RNA extraction. RNA extraction was performed using the NucleoSpin® RNA kit (Macherey-Nagel), following the manufacturer’s protocol. RNA was quantified and quality checked using a NanoDrop™ One Microvolume UV-Vis Spectrometer (Thermo Scientific). Following RNA extractions, cDNA was synthesized using SuperScript IV First-Strand cDNA Synthesis Reaction kit (Invitrogen) using random hexamers. cDNA samples were stored at −20°C until qPCR reaction set up.
Gene-specific primers for qPCR and their sources are shown in Table 1. Primers were verified for specificity by NCBI Primer Blast vs. GRCz11. Amplification of qPCR reactions were performed using PowerTrack SYBR-Green Master Mix (Applied Biosystems), 1–2.5 ng cDNA template per reaction and run with a QuantStudio™ 3 Real-Time PCR System (Thermo Fisher). The chosen reference gene was 18s, which returned consistent Ct readings (inter-sample ranges within ∼1–1.4−ΔΔCT of each other) between all samples. Other reference genes (bact2, elf1a, gapdh) were deemed unsuitable due to variability in Ct readings >2−ΔΔCT between samples. RT-qPCR reactions underwent 40 amplification cycles. No-template control wells were included for each primer set and melt curves were checked for clean and specific peaks after each run. Fold change was calculated using the delta delta Ct method.
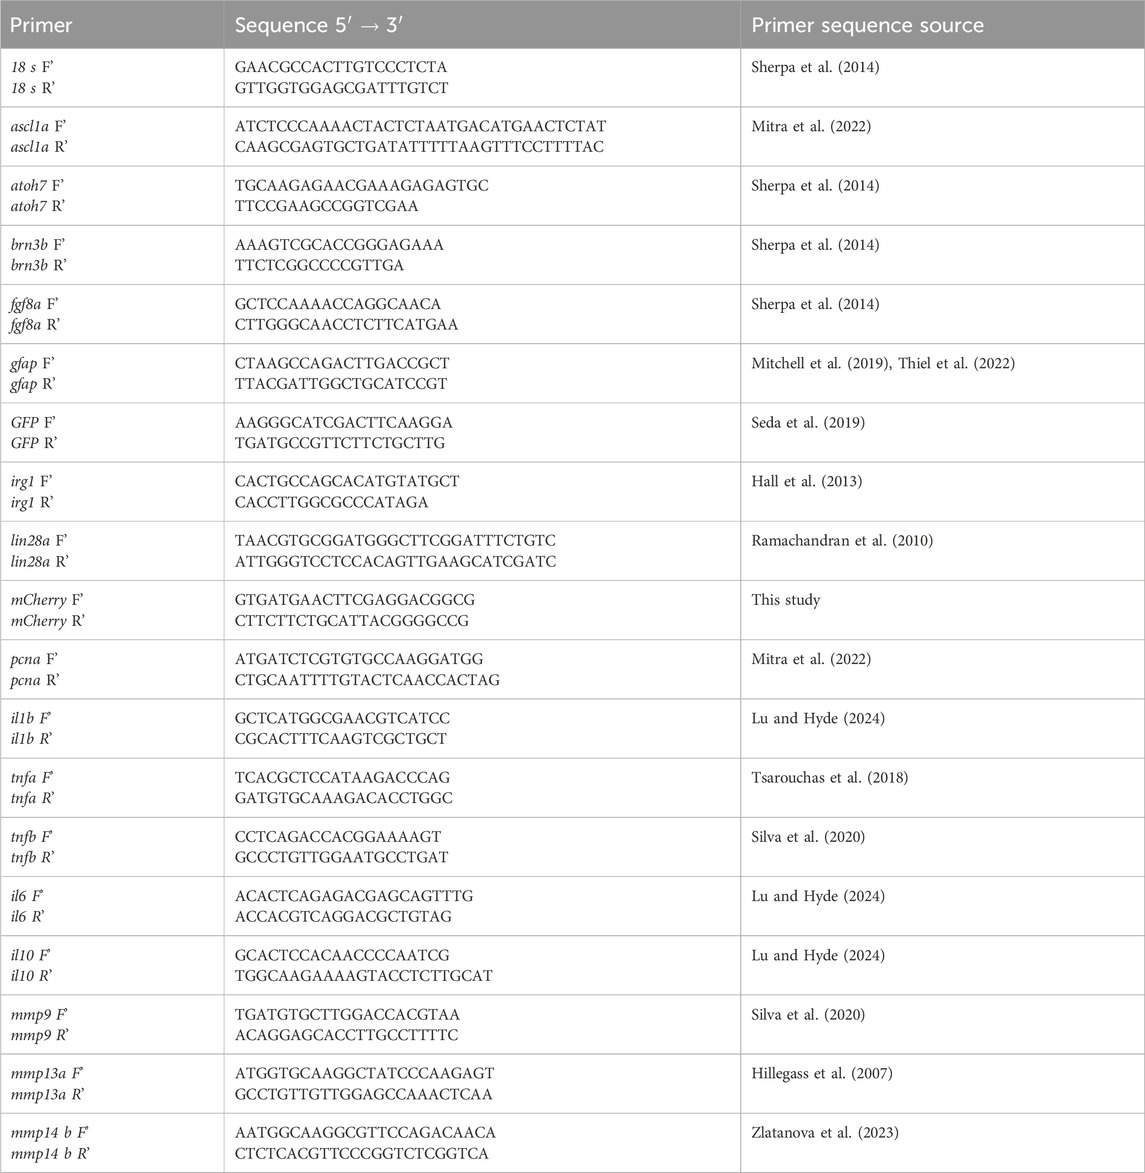
Table 1. Primer sequences used in qPCR.
Statistical analysisStatistics were performed in the R coding environment. For pairwise comparisons, non-parametric Welch’s tests were performed. For multiple groups, Kruskal–Wallis test was used, followed by Conover’s posthoc. Statistically significant differences are annotated in the figures.
ResultsIncreased inflammatory signaling by forcing expression of myd88 in microglia upon retinal damageWe previously interrogated gene expression of mpeg1+ cells (microglia/macrophages) isolated from regenerating zebrafish retinas at 7 days post injury (DPI) following ouabain-induced cytotoxic lesion using RNA-sequencing (Mitchell et al., 2019). Examining normalized gene expression of mpeg1+ cells in our dataset (Mitchell et al., 2019) compared to that of mpeg1+ cells isolated from undamaged zebrafish brain in a separate published study (Oosterhof et al., 2017) indicated that microglia in regenerating retinas downregulate expression of myd88 (Figure 1A). We also found that mpeg1+ cells in regenerating retinas upregulate nfkbiaa and maintain high levels of nfkbiab, which encode two inhibitors of Nfkb activation (Figures 1B,C), suggesting that there is inhibition of the MyD88/Nfkb signaling pathway in microglia during retinal regeneration. In addition, by examining myd88 mRNA levels for other samples in the Oosterhof et al. (2017) transcriptomic study, we found that mpeg1+ cells downregulate myd88 by 1 day post brain injury (Figure 1D). This downregulation of myd88 is accompanied by upregulation of nfkbiab through 2 days post injury, with less obvious changes in nfkbiaa (Figures 1E,F). Collectively, these results suggest that there is temporal regulation of the MyD88 signaling pathway in microglia/macrophages after central nervous system damage.
Given that MyD88/Nfkb signaling is known to induce gene expression of inflammatory factors, and the recent evidence that inflammation regulates retinal regeneration in zebrafish (Zhang et al., 2020; White et al., 2017; Silva et al., 2020; Iribarne and Hyde, 2022; Bludau et al., 2024), we hypothesized forcing inflammatory signals from microglia via sustained MyD88 signaling during retinal regeneration would alter the outcome of Müller glia-mediated regenerative responses. As an experimental tool to test our hypothesis, we generated a transgenic zebrafish line in which the myd88 cDNA sequence is expressed under control of the mpeg1 promoter, linked with viral T2A peptide-mCherry (mpeg1:myd88-2A-mCherry). The stable line selected for experiments displayed mCherry fluorescence in microglia in larvae (Figures 2A,A’) though fluorescent mCherry expression in adult retinas was extremely weak/difficult to detect. In adult retinas, mRNA levels of myd88 in whole adult retinas were slightly elevated in some samples compared to non-transgenics (but not statistically significant, Figure 2B). Microglia are a fraction of all retinal cells, and reporter protein expression from viral 2A polycistronic expression systems can vary (Ryan and Drew, 1994; Kim et al., 2011). Collectively, these data suggest low expression of the transgene by microglia in the undamaged adult retina. In these mpeg1:myd88-2A-mCherry (here after referred to as mpeg1:myd88) transgenic fish, microglia differentiated and populated the adult retina (Figures 2C,D’) and retinal lamination was found to be grossly normal (Figures 2C’, D’).
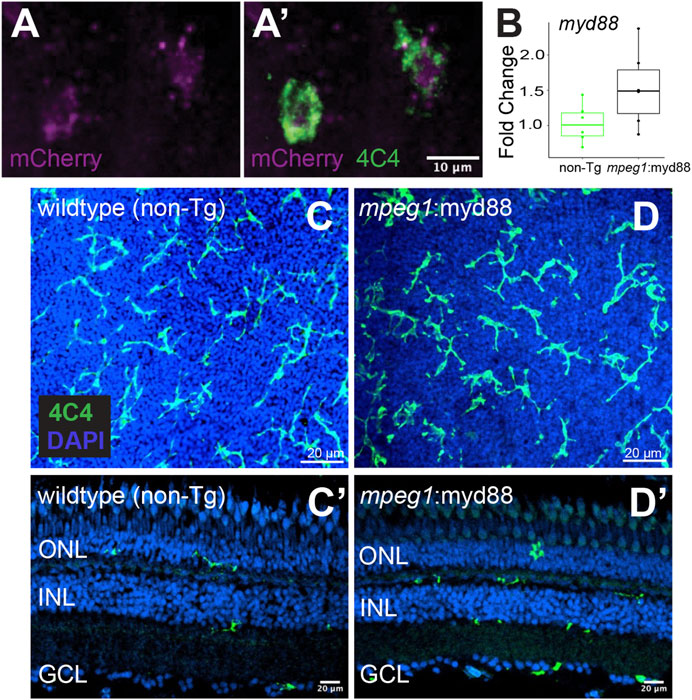
Figure 2. Creation of transgenic zebrafish with forced myd88 expression in microglia/macrophages. Tol2 transgenesis followed by several generations of outcrossing was used to generate a zebrafish line in which the mpeg1 promoter drives expression of myd88 cDNA followed by a 2A-mCherry sequence. (A, A’) mCherry fluorescence in 4C4+ microglia visualized from mpeg1:myd88-2A-mCherry zebrafish eyes/retinas at 3 days post fertilization (dpf). Through the remainder of the manuscript, we refer to this line as mpeg1:myd88 for simplicity. (B) Fold change of myd88 transcripts measured by RT-qPCR in whole retinas from non-transgenic (non-Tg) and mpeg1:myd88 adult fish. Each dot represents result of one single adult retina. Differences were not statistically significant (p = 0.08). (C, D) Microglia stained and visualized with the 4C4 antibody using whole, flat mounted adult zebrafish retinas. Nuclei stained with DAPI. (C’, D’) Retinal cryosections (adult) stained and visualized with 4C4 antibody and DAPI. ONL = outer nuclear layer, INL = inner nuclear layer, GCL = ganglion cell layer.
To determine the effects of myd88 overexpression in microglia/macrophages on retinal regeneration, we utilized a system of retinal damage by intravitreal injection with the neurotoxin ouabain (Mitchell et al., 2019; Mitchell et al., 2018; Mitchell and Stenkamp, 2023). As controls for mpeg1:myd88 fish, we used mpeg1:GFP or mpeg1:mCherry transgenics, to control for expression of mpeg1-driven transgenes. Throughout the manuscript we refer to samples from these mpeg1-reporter lines as “mpeg1:FP” since their results represent outcomes following retinal damage to which to compare samples with mpeg1-driven myd88 expression. At 4 days post ouabain injection (4DPI), myd88 in whole, homogenized retinal samples was increased in mpeg1:FP samples compared to saline injected samples (Figure 3A), suggesting that regulation of myd88 expression is dynamic and could involve other cell types besides microglia/macrophages. Consistent with this, published single cell RNA-seq datasets show myd88 expression is not limited to microglia and is detectable in cell types such as Müller glia and retinal pigment epithelium in undamaged and degenerating retinas (Santhanam et al., 2023). As expected, mpeg1:myd88 retinas had increased expression of myd88 relative to mpeg1:FP, consistent with forced expression via the integrated mpeg1-driven transgene (Figure 3A). Further, we were able to reliably detect expression of mCherry mRNA at 4DPI in samples from mpeg1:mCherry and mpeg1:myd88-2A-mCherry by RT-qPCR (Supplementary Figure S1), confirming transgene expression and suggesting that retinal damage may trigger higher levels of transgene expression in the mpeg1:myd88 line.
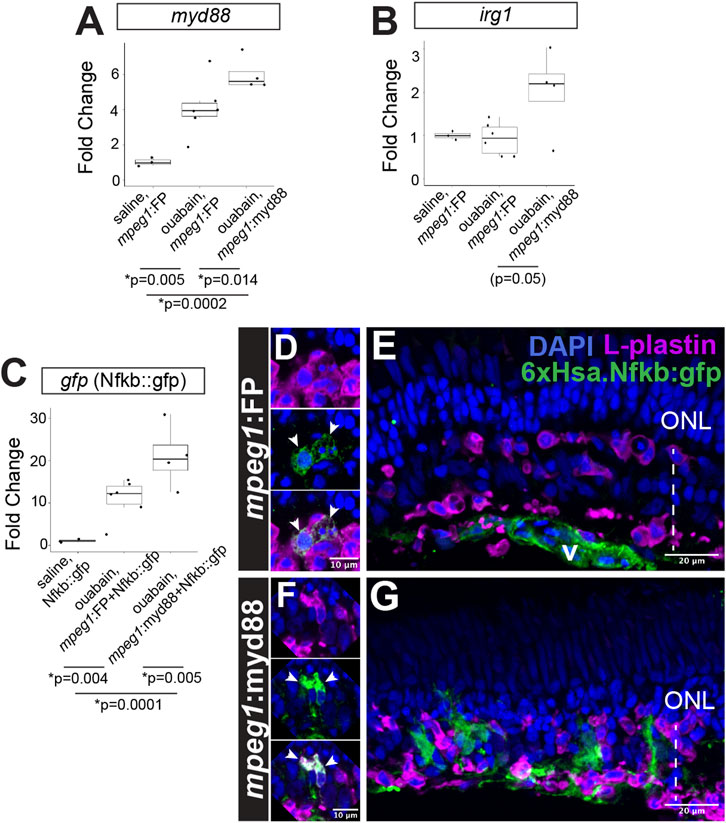
Figure 3. Prolonged inflammatory signaling in retinas with forced myd88 signaling in microglia/macrophages. RT-qPCR was used to measure transcripts for (A) myd88, (B) irg1, and (C) gfp after intravitreal injection of ouabain. (A, B) Fold change of each transcript in ouabain injected samples relative to saline injected samples. (C) Fold change of gfp in retinas also carrying the Nfkb::gfp transcriptional reporter. (A–C) p-values shown below the graphs indicate statistically significant differences between the indicated groups (Kruskal–Wallis, followed by Conover’s posthoc). (D, E) Visualization of GFP in Nfkb::gfp reporter line at 4 days post-ouabain injection (4DPI). (D) Enlarged panels show GFP signal detected in a subset of responding L-plastin+ cells within the damaged inner retina (arrowheads). (E) GFP expression also detective in vascular (v) structures. (F, G) Visualization of GFP in mpeg1:myd88 transgenics also carrying Nfkb::gfp reporter. (F) Enlarged panels show strong GFP expression visible in a subset of responding L-plastin+ cells within the damaged inner retina (arrowheads). (G) GFP expression also seen in regions of the inner nuclear layer that is consistent with Müller glia and Müller glia-derived progenitors at 4DPI. ONL = outer nuclear layer; the vertical dotted line indicates inner retinal region damaged by ouabain.
Prolonged/forced expression of myd88 in mpeg1+ cells was also associated with increased expression of irg1 (also called acod1), which is associated with inflammatory macrophage/microglia activation state (Li et al., 2023; Thomas et al., 2006) and interacts with MyD88 (Chen et al., 2022), Figure 3B. Consistent with increased (or prolonged) expression of myd88 and induction of the downstream signaling pathway, we also detected increased activity of Nfkb transcriptional activity in the 6xHsa.Nfkb::gfp reporter line by qPCR (Figure 3C). Examining 6xHsa.Nfkb::gfp (referred to as Nfkb::gfp) retinal cryosections for GFP reporter fluorescence revealed that a subset of L-plastin+ leukocytes, which represent microglia/macrophages as determined by our previous studies (Mitchell et al., 2019; Mitchell et al., 2018), express the Nfkb transcriptional reporter at 4DPI in both mpeg1:FP (mpeg1:mCherry used in these experiments) and mpeg1:myd88 tissue (Figures 3D,F), with apparently stronger signal in the mpeg1:myd88 line (Figures 3D,F). Throughout the mpeg1:FP retinal sections, besides the subset of microglia/macrophages, GFP was detected in regions/structures putatively representing the vasculature but not significantly found in other retinal cells or regions (Figure 3E). However, in mpeg1:myd88 retinal sections, patches of GFP signal were visible in the regenerating inner nuclear layer (INL) that did not colocalize with L-plastin and are consistent with Müller glia and/or newly generated, MG-derived progenitors (Figure 3G).
We also measured expression of selected cytokines (il1b, il6, tnfa, tnfb, il10) by RT-qPCR (Supplementary Figure S2) in samples prepared from whole retina RNA at 4DPI after saline or ouabain injection. These cytokine genes were selected because they have been shown to be regulated in zebrafish retinas after injury and during regeneration (Silva et al., 2020; Lu and Hyde, 2024; Nelson et al., 2013), and some may have a role in regenerative responses (Lu and Hyde, 2024). Of the cytokines evaluated, expression of il1b and tnfa were increased in both mpeg1:FP and mpeg1:myd88 at 4DPI ouabain compared to saline at similar levels. Although increased relative to saline controls in both lines, tnfb had lower expression in mpeg1:myd88 samples compared to mpeg1:FP. The cytokine il10 was upregulated only in mpeg1:myd88 retinas compared to both mpeg1:FP and saline controls, possibly reflecting counter-balance to pro-inflammatory signals. We also examined expression of selected matrix metalloproteinase genes (Supplementary Figure S2) because inflammatory signals can modulate expression and activity of this class of enzymes. We examined mmp9 because it has been shown to have a role in retinal regeneration in zebrafish (Silva et al., 2020). We also examined expression of mmp13a and mmp14b because these were shown to be expressed in a subpopulation of microglia in published single-cell transcriptome datasets from zebrafish retina after injury (Hoang et al., 2020). Of these, mmp13a trended towards higher expression in mpeg1:myd88 samples compared to mpeg1:FP and saline controls. While mmp9 and mmp14b both were increased in ouabain damaged samples from both lines compared to saline controls, their expression levels were not different between mpeg1:FP and mpeg1:myd88 samples. Collectively, these RT-qPCR results indicate that forced/prolonged expression of myd88 in microglia/macrophages alters microglia/macrophage activation state and influences inflammatory signaling within the regenerating retina.
Effects of forced MyD88 expression in microglia/macrophages on response to retinal damageWe examined lesioned retinas from control and mpeg1:myd88 fish for microglia/macrophage responses and the cell death marker TUNEL, at 2 and 6DPI (Figure 4), to determine if cell death and/or responding microglia/macrophage were affected by the overexpression of myd88. These timepoints were selected because they represent induced inner retinal neuron death and microglial/macrophage responses (2DPI) and when Müller glia/neuronal progenitors are actively proliferating (6DPI). The number of TUNEL+ cells were no different at 2 and 6DPI (Figures 4A–F), indicating that cell death was not increased (or decreased) as a result of prolonged myd88 expression. Further, apparent regions of retinal damage remained similar between mpeg1:FP and mpeg1:myd88 retinas with regions of degeneration predominantly localized to the inner retina (Figures 4A,B,D,E).

Figure 4. Leukocyte responses and cell death levels in acutely damaged and regenerating retinas. (A, B) TUNEL staining of retinal cryosections from mpeg1:FP or mpeg1:myd88 fish at 2 days post ouabain injection (2DPI, acute damage). (C) TUNEL counts in retinal cryosections from mpeg1:FP or mpeg1:myd88 fish at 2DPI. (D, E) TUNEL staining of retinal cryosections from mpeg1:FP or mpeg1:myd88 fish at 6DPI. (F) TUNEL counts in retinal cryosections from mpeg1:FP or mpeg1:myd88 fish at 6DPI. No statistically significant differences were found between mpeg1:FP and mpeg1:myd88 groups (Welch’s test). (G, H) Retinal cryosections at 2DPI stained and imaged for L-plastin and DAPI. (I) Quantification of L-plastin+ cells at 2DPI. (J, K) Retinal cryosections at 6DPI stained and imaged for L-plastin and DAPI. (L) Quantification of L-plastin+ cells at 6DPI. No statistically significant differences were found between mpeg1:FP and mpeg1:myd88 groups (Welch’s test). ONL = outer nuclear layer; the vertical dotted line indicates inner retinal region damaged by ouabain.
To label microglia/macrophages, we used the pan-leukocyte marker L-plastin. We selected this marker because our previous work showed that essentially all leukocytes responding to ouabain lesion at these timepoints are microglia and macrophages (Mitchell et al., 2019; Mitchell et al., 2018), and staining retinal cryosections with the commonly used antibody “4C4” revealed that only a subset of L-plastin+ cells at 2DPI stain with 4C4 (Supplementary Figure S3). Interestingly, the antigen recognized by the 4C4 antibody is thought to be LGals3bp (Rovira et al., 2022), suggesting that this gene is differentially expressed in microglia/macrophages responding to widespread retinal lesion. Alternatively, this marker may differentially label populations of microglia versus infiltrating macrophages. We therefore selected L-plastin to label responding microglia/macrophages for the remainder of this study. At 2DPI, L-plastin+ microglia/macrophages were found to densely populate the damaged inner retina in both mpeg1:FP and mpeg1:myd88 samples (Figures 4G,H), consistent with our previous work (Mitchell et al., 2019; Mitchell et al., 2018). Numbers of L-plastin+ cells were slightly elevated in mpeg1:myd88 retinal sections compared to mpeg1:FP, but this difference was not statistically significant (Figure 4I). L-plastin+ cells were detected in the regenerating inner retina in both lines at 6DPI (Figures 4J,K) and on average at similar numbers (Figure 4L). These results indicate that there was not a significant increase in the initial responding microglia/macrophage numbers and forced expression of myd88 does not result in increased neuronal death or degeneration.
During a regenerative response in the zebrafish retina, Müller glia transiently enter a gliotic phase after retinal damage (Thomas et al., 2016). We therefore measured expression of gfap, an intermediate filament protein known to be upregulated in gliotic neuroglia (Bringmann et al., 2006). At 4-6DPI ouabain injection, gfap was increased in both mpeg1:FP and mpeg1:myd88 retinas compared to saline injected retinas (Figure 5A). At 4DPI, levels of gfap in damaged mpeg1:FP retinas were higher than those in mpeg1:myd88 retinas; although this difference was surprisingly not statistically significant the trend was strong (Figure 5A). At 5-6DPI, levels of gfap were similar between damaged mpeg1:FP and mpeg1:myd88 samples (Figure 5A). Immunostaining for GFAP in retinal cryosections was largely consistent with the RT-qPCR results (Figures 5B–E). Signal intensity appeared stronger in mpeg1:FP compared to mpeg1:myd88 retinas at 4 DPI (Figures 5B,C), but was similar at 6DPI (Figures 5D,E).
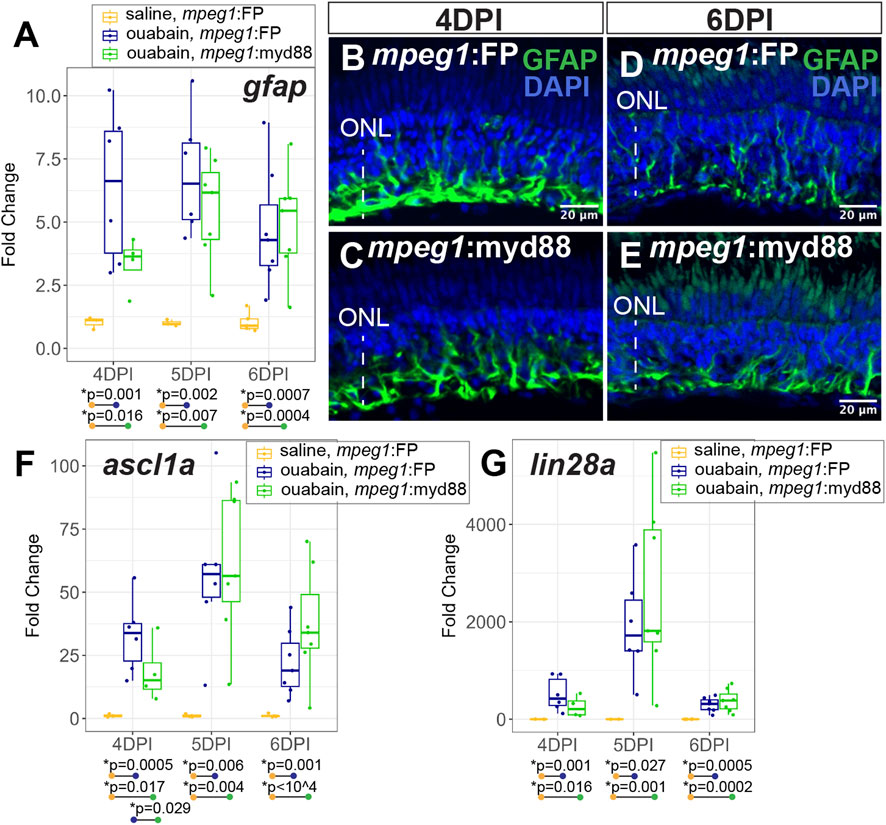
Figure 5. Analysis of Müller glia reactivity and induction of stem-like genes in damaged retinas. (A) RT-qPCR was used to examine upregulation of gfap in mpeg1:FP and mpeg1:myd88 retinas at 4-, 5-, or 6-days post ouabain injection (4-6DPI), fold change was determined relative to saline injected samples. Statistically significant differences between groups are shown by the p-values reported at the bottom of the plot. B-E. Retinal cryosections stained for GFAP and DAPI at 4DPI (B, C) or 6DPI (D, E). ONL = outer nuclear layer; the vertical dotted line indicates inner retinal region damaged by ouabain. (F, G) RT-qPCR was used to examine upregulation of ascl1a (F) and lin28a (G) in mpeg1:FP and mpeg1:myd88 retinas; fold change was determined relative to saline injected samples. Statistically significant differences between groups are shown by the p-values reported at the bottom of the plot (Kruskal–Wallis, followed by Conover’s posthoc).
Induction of the gene ascl1a and its transcriptional target lin28a are known to be induced in zebrafish retina during a regenerative response (Ramachandran et al., 2010; Fausett et al., 2008; Ramachandran et al., 2011). Expression of these genes are thought to induce a stem-like state of Müller glia and the MG-derived progenitors. Both ascl1a and lin28a were induced in mpeg1:FP and mpeg1:myd88 retinas from 4–6 days post ouabain damage (Figures 5F,G), with a transient peak in expression at ∼5DPI. However, levels of ascl1a were lower in mpeg1:myd88 retinas compared to mpeg1:FP at 4DPI (Figure 5F). By 6DPI, levels of ascl1a were slightly elevated in mpeg1:myd88 samples compared to mpeg1:FP (trending but not statistically significant at 6DPI, Figure 5F). Trends of expression from 4 to 6DPI were similar for lin28a in terms of induction of expression in both mpeg1:FP and mpeg1:myd88 lines. Though a trend but not statistically significant, lin28a transcripts were lower in mpeg1:myd88 compared to mpeg1:FP at 4DPI (Figure 5G). It is also worth noting that lin28a was only just detectable in saline injected samples, with high Ct readings and with 1-2 saline samples returning “non-detect” in one or more technical replicates. This would be expected given that this gene is not strongly expressed in undamaged retinas. When also considering results described for gfap above, these stem-like gene expression differences suggest a delay in reactivity and induction of a stem-like state in MG/MG-derived progenitors in mpeg1:myd88 retinas compared to mpeg1:FP.
We examined proliferation of MG/MG-derived progenitors by examining induction of the S-phase marker PCNA (Figure 6). We again analyzed retinas at 4, 5, and 6DPI since these timepoints are when MG/MG-derived progenitors are actively dividing and readily labeled by PCNA expression (Nagashima et al., 2013; Fimbel et al., 2007; Mitchell et al., 2019; Mitchell et al., 2018). As expected, RT-qPCR revealed that both mpeg1:FP and mpeg1:myd88 retinas strongly increased pcna expression relative to saline controls from 4-6DPI (Figure 6A). Levels of pcna were similar between mpeg1:FP and mpeg1:myd88 samples at 4 and 5DPI. At 6DPI, levels of pcna in mpeg1:myd88 retinas trended higher than mpeg1:FP (though this was not statistically significant), Figure 6A. Immunostaining for PCNA at 6DPI showed dense clusters of PCNA+ cells in the regenerating inner retina in both mpeg1:FP and mpeg1:myd88 retinas (Figures 6B,C). Quantifications of total PCNA+ cells in the inner retina revealed a trend consistent with that of RT-qPCR results at 6DPI, where numbers of PCNA+ cells were increased in the mpeg1:myd88 retinas compared to mpeg1:FP (Figure 6D, though again not statistically significant). Some of the PCNA+ cells were surrounded by Glutamine Synthetase (GS) signal, which is a known marker of Müller glia, and therefore likely representing S-phase+ MG (Figures 6B’,B’’). However, many of the PCNA+ cells in the inner retina at 6DPI are likely MG-derived progenitors because most PCNA+ nuclei did not co-localize with GS (Figure 6B’, B’’) or L-plastin (Figures 6C’,C’’). To better understand differences in total PCNA quantifications, we counted PCNA+ L-plastin+ cells (likely representing dividing microglia/macrophages). In contrast to total PCNA counts, the numbers of PCNA+ L-plastin+ cells were reduced in mpeg1:myd88 retinas compared to mpeg1:FP (Figures 6C’, C’’). These results further suggest that there are more PCNA+ MG/MGPCs in mpeg1:myd88 retinas at 6DPI compared to mpeg1:FP.
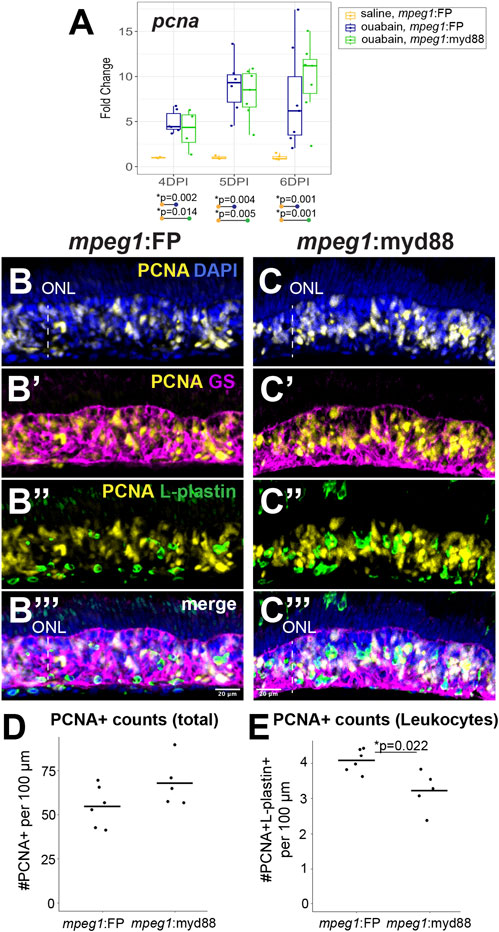
Figure 6. Analysis of proliferative response in damaged retinas. (A) RT-qPCR was used to examine upregulation of pcna transcript in mpeg1:FP and mpeg1:myd88 retinas at 4-, 5-, or 6-days post ouabain injection (4-6DPI); fold change was determined relative to saline injected samples. Statistically significant differences between groups are shown by the p-values reported at the bottom of the plot (Kruskal–Wallis, followed by Conover’s posthoc). (B, C’’’) Retinal cryosections were stained for PCNA, Glutamine Synthetase (GS), L-plastin, and DAPI. Selected overlays for mpeg1:FP and mpeg1:myd88 samples are shown in (B-B’’’) and (C-C’’’). ONL = outer nuclear layer; the vertical dotted line indicates inner retinal region damaged by ouabain. (D) Quantification of total PCNA+ cells in retinal cryosections; PCNA+ DAPI+ nuclei were counted for this analysis. (E) Quantification of PCNA+ L-plastin+ cells in retinal cryosections; L-plastin+ cells with PCNA+ DAPI+ nuclei were counted for this analysis. Statistically significant difference is indicated by the shown p-value (Welch’s test).
Effects of forced MyD88 expression in microglia/macrophages on regeneration of inner retinal neuronsWe assessed early production of regenerated inner retinal neurons at 4-6DPI by examining selected genes known to drive ganglion cell differentiation, along with markers of differentiated ganglion cells (Figure 7). RT-qPCR showed induction of the transcription factor atoh7, which is known to be important for ganglion cell neurogenesis (Kay et al., 2001), in both mpeg1:FP and mpeg1:myd88 retinas (Figure 7A). Expression is initially increased at 4DPI, then further and strongly increased at 5 and 6DPI consistent with the initiation of ganglion cell neurogenesis (Figure 7A). Interestingly, levels of atoh7 were higher in mpeg1:myd88 retinas compared to mpeg1:FP at 5 and 6DPI (Figure 7A). However, when we examined levels of the genes brn3b and fgf8a, which are expressed in specific subsets of differentiated or newly generated ganglion cells, respectively (Picker and Brand, 2005; Martinez-Morales et al., 2005; Mu et al., 2004; Erkman et al., 1996; Gan et al., 1996), levels of these genes were not different between mpeg1:FP and mpeg1:myd88 samples (Figures 7B,C).
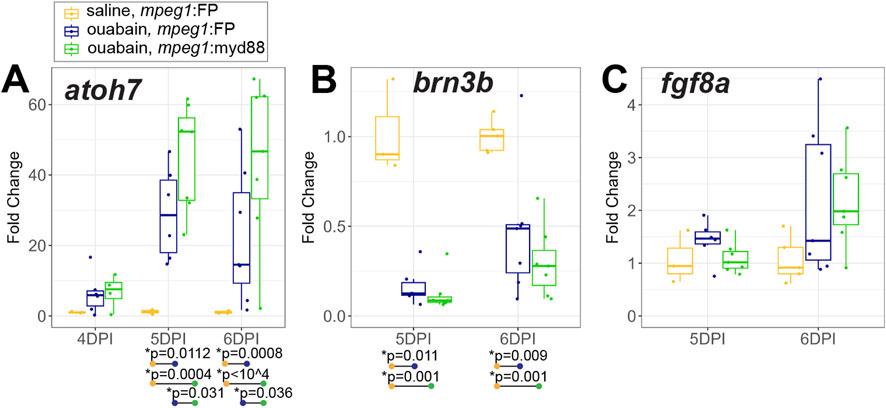
Figure 7. Analysis of transcripts associated with ganglion cell neurogenesis. A-C. RT-qPCR was used to examine expression of genes atoh7 (A), brn3b (B), and fgf8a (C), which are associated with ganglion cell neurogenesis, in mpeg1:FP and mpeg1:myd88 retinas at 4-, 5-, or 6-days post ouabain injection (4-6DPI). Fold change was determined relative to saline injected samples. Statistically significant differences between groups are shown by the p-values reported at the bottom of the plot (Kruskal–Wallis, followed by Conover’s posthoc). Differences in fgf8a were not statistically significant for any comparisons.
We next stained retinal cryosections for the marker HuC/D to label selected populations of regenerated inner retinal neurons, since HuC/D is expressed in differentiated ganglion cells and amacrine cells (Fimbel et al., 2007; Marusich et al., 1994). Though HuC/D+ neurons were detected at 6DPI as previously reported following ouabain lesion (Nagashima et al., 2013), their distributions were highly irregular with regions completely lacking HuC/D+ neurons, regions with sparse labeling, and regions with dense clusters making quantifications of HuC/D+ cells unreliable at this timepoint (Supplementary Figure S4). By 10DPI, HuC/D+ cells were more consistently detected in the basal regenerating inner retina of both mpeg1:FP and mpeg1:myd88 samples (Figures 8A,B). Quantification of HuC/D+ neurons at 10DPI revealed that these putatively regenerated neurons were reduced in number in mpeg1:myd88 retinas compared to mpeg1:FP (Figure 8C). To examine death of neurons at 10DPI, which could provide an explanation for these differences, we quantified the number of TUNEL+ cells in the inner retina. As described previously, cell death levels were not significantly different between groups at 2 or 6DPI (Figures 4C,F), and when examined over time both groups showed a similar trend where TUNEL+ counts were elevated upon ouabain injection then reduced over time (Supplementary Figure S5). However, at 10DPI
留言 (0)