
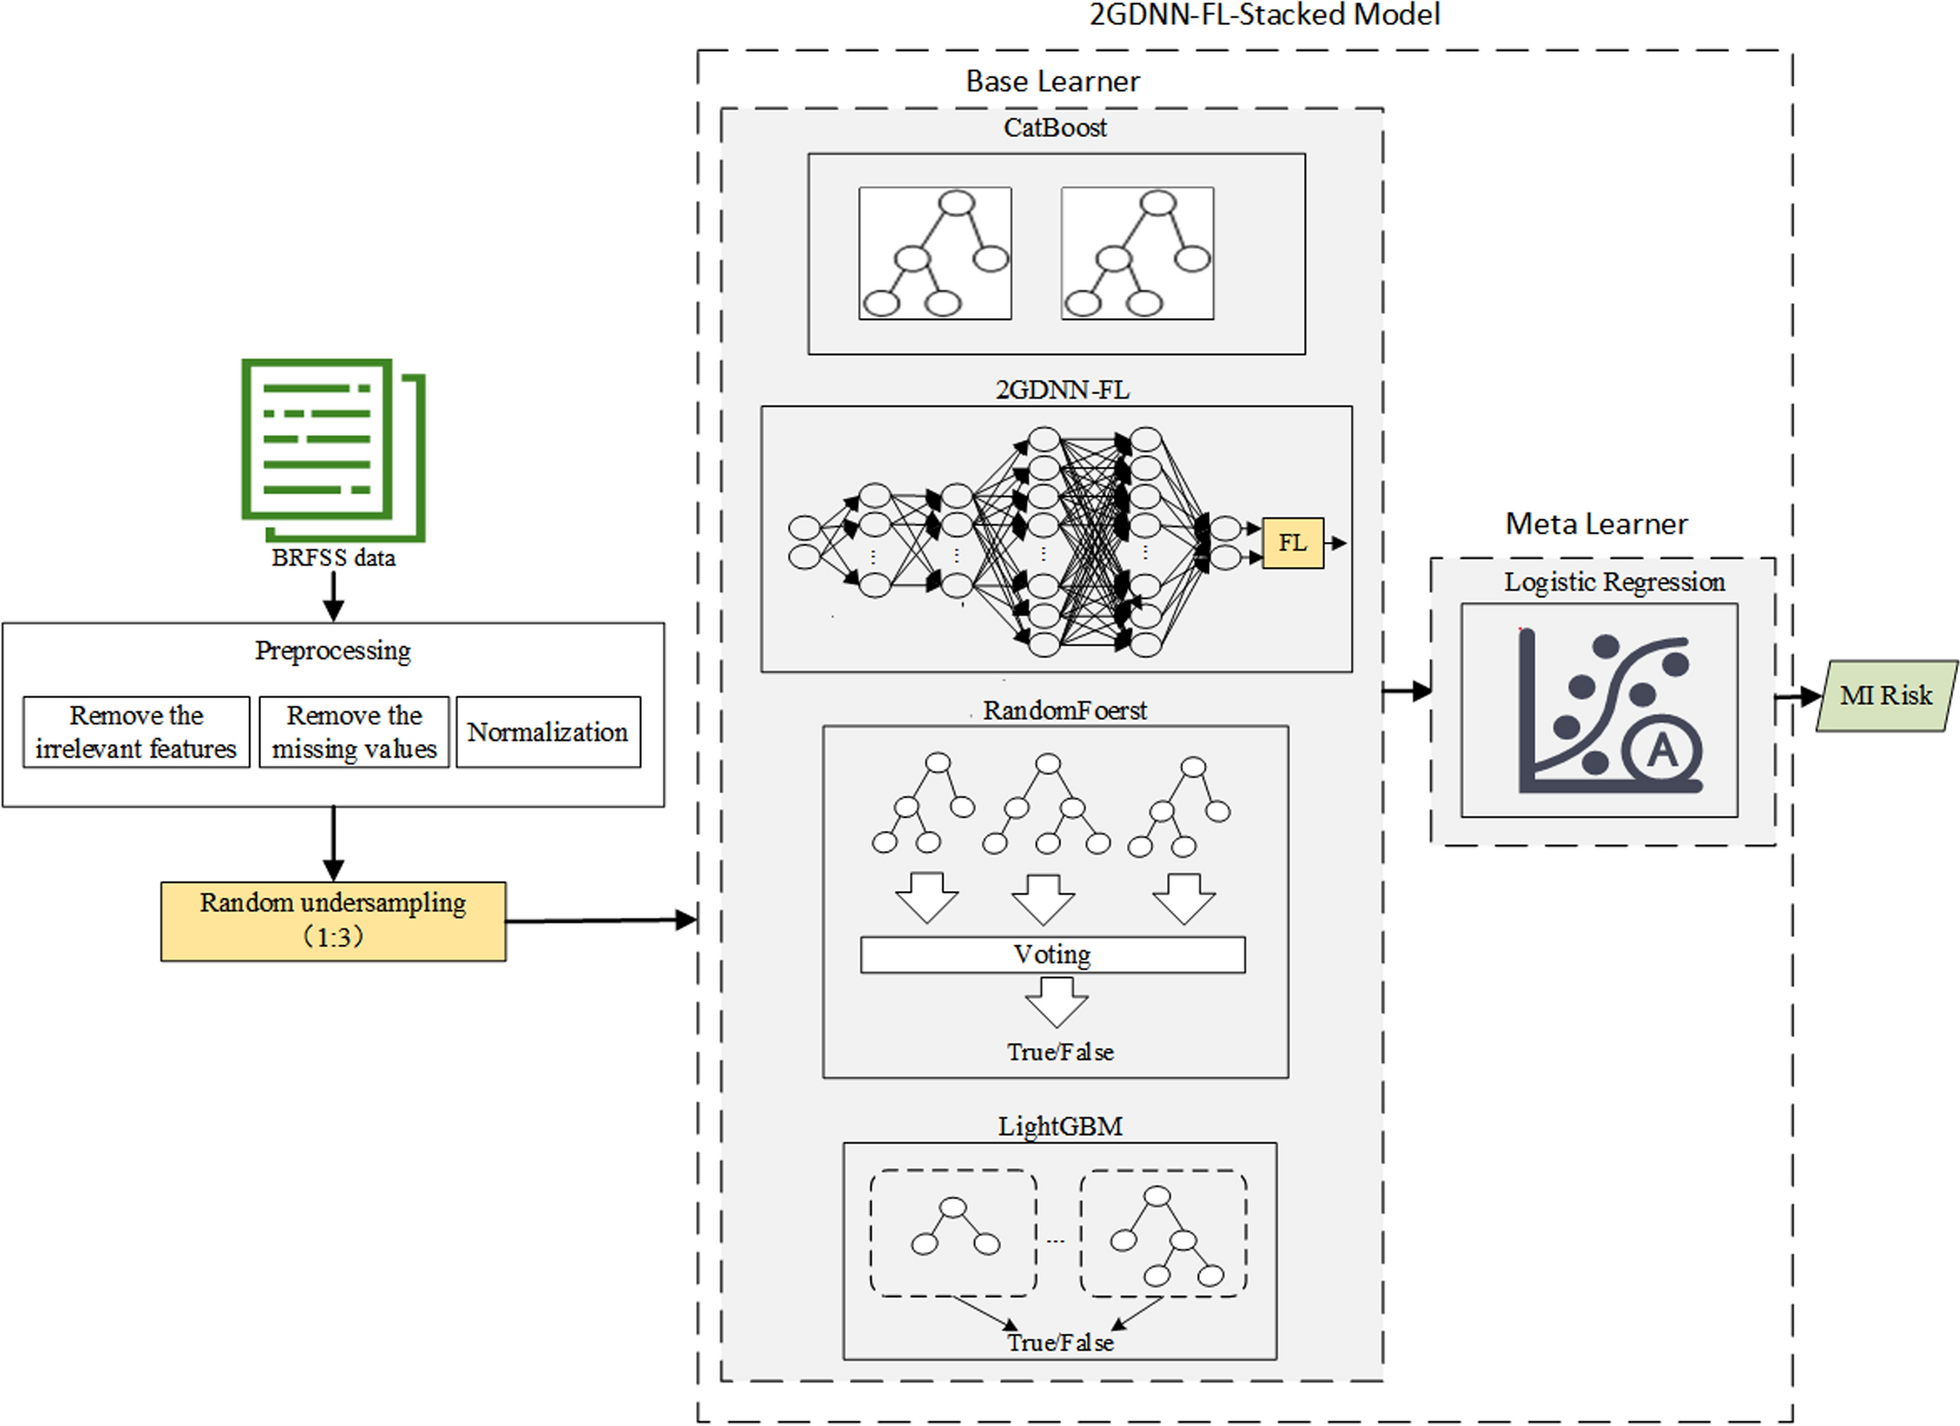
記住我


From December 5, 2022, to January 26, 2023, this study recruited 22 undergraduate and graduate students, comprising 11 men and 11 women. The experimental procedures were approved by the Ethics Review Committee on Research with Human Subjects of Waseda University, Japan (Approval Nos. 2018-092 and 2022-436) and were conducted in accordance with the Declaration of Helsinki for experiments involving humans. All participants provided written informed consent. The data collection was divided into two parts. The first part was conducted in a laboratory at Waseda University, where Traditional Chinese Medicine (TCM) staff conducted weekly observations, questioning, and pulse data collection to assess TCM health scores (TCMHS) on a scale from 1 to 10 based on TCM-related data. This approach merges predictive medicine with the TCM principle of "Preventive Treatment of Diseases," providing a new perspective on identifying health risks through health data collected from various sensors and devices [23].
The second part was conducted in the participants’ daily lives. Participants were asked to wear wearable devices to monitor their daily activities and health indicators, such as heart rate, step count, and sleep quality. The wearable device, Huawei Band 7, which is a smart bracelet worn on the wrist, records 16 health indicators, as presented in Table 1. Participants were instructed to wear the device for 24 h a day, except while showering or charging. The device continuously transmitted health data via Bluetooth to a paired smartphone, which stored the data in the cloud.
Table 1 Feature description of WD-health datasetOpen dataset for diabetesWe also used an open dataset comprising data from 442 diabetes patients [24]. The dataset included variables such as age, sex, body mass index (BMI), average blood pressure (ABP), total cholesterol (TC), low-density lipoprotein (LDL), high-density lipoprotein (HDL), total cholesterol/HDL (TCH), logarithm of serum triglyceride level (LTG), blood glucose value (GLU), and the target variable, which indicated disease progression one year after baseline (Target).
Determining important health featuresSelecting features based on WTSTo integrate multiple feature selection methods, we used Pearson correlation (Pearson), distance correlation (Distance), Lasso regression (Lasso), random forest (RF-MDA), and stability selection (Stable). Each method was applied to generate rankings of feature importance. Furthermore, we assigned equal weights (0.2) to each method (Average Weight) to obtain the average weight scores and obtained rankings based on this average weight. Then, we explored the optimal set of weights to obtain WTS by using our proposed approach. The top k features from each method were selected to construct models for predicting outcomes. The optimal number of features, k, was identified by comparing the MSE and \(R^2\) scores. In addition, we evaluated the root mean square error (RMSE), mean absolute error (MAE), and explained variance (EV) to ensure that the selected feature sets were consistent across different evaluation metrics.
We conducted the evaluation experiments using two datasets. First, with the WD-health dataset, our approach resulted in an optimal k value of six, with an MSE of 0.008, RMSE of 0.090, MAE of 0.046, \(R^2\) of 0.536, and EV of 0.539. These results are summarized in Table 2. We reduced the number of selected features, and the model’s metrics outperformed those of single methods and the average weight method. The WTS values for the WD-health dataset are listed in Table 3, and the selected features were used for constructing causal graphs.
For the open diabetes dataset, our approach resulted in an optimal k value of seven, with an MSE of 0.021, RMSE of 0.145, MAE of 0.116, \(R^2\) of 0.647, and EV of 0.648, as summarized in Table 4. The WTS rankings for each variable are presented in Table 5, highlighting the seven features with the highest WTS: LTG, BMI, TC, ABP, LDL, sex, and GLU. These seven most important features were used in causal graphs owing to their important impact on the target variable.
Table 2 Comparison of proposed approach and baselines on WD-health datasetTable 3 Weighted total score (WTS) for WD-health datasetTable 4 Comparison of proposed approach and baselines on open dataset for diabetesTable 5 Weighted total score (WTS) for open dataset for diabetesInvestigating multicollinearity on selected featuresTo prevent multicollinearity, we conducted a correlation analysis on the selected features. Figure 2(a) shows a heat map of the Spearman correlation coefficients among the features from the WD-health dataset. For instance, Step Number (StepN) and Step Distance (StepD) showed strong positive correlations (r = 0.95), indicating potential multicollinearity. We assessed multicollinearity using variance inflation factors (VIFs), which revealed that StepD and StepN had VIFs of 15.34 and 15.25, respectively, indicating significant multicollinearity. After removing StepD, the VIFs for the remaining features dropped below 10. Therefore, the selected features are Wake Up Counts (WUC), Stress Score (StressS), StepN, Breathing Quality (BreathQ), and Total Sleep Duration (TSD).
The correlation heatmap between the selected features from the open diabetes dataset is shown in Fig. 2(b). A positive correlation exists between any pair of indicators, indicating that key factors influencing the progression of diabetes tend to increase together. Among them, TC and LDL levels showed a strong positive correlation (r = 0.88), suggesting potential multicollinearity between these two features. To further analyze this, we investigated the VIF for each indicator. The VIF values for the seven selected indicators-LTG, BMI, TC, ABP, LDL, Sex, and GLU-are all below the acceptable threshold of 10.
Fig. 2
Correlation heatmaps for WD-health experiment dataset and open dataset for diabetes
Fig. 3
Causal graphs with WD-health experiment dataset and open dataset for diabetes
Construction and validation of causal graphsConstruction of causal graphsIn this study, we employed DirectLiNGAM [25, 26], a causal discovery algorithm, to investigate the causal paths between selected health features and health outcomes. DirectLiNGAM excels in exploring causal relationships within non-Gaussian datasets. It determines the causal order of variables through independent tests, eliminating the need for prior knowledge. This capability is particularly pertinent for health data, which frequently deviate from Gaussian distributions. It is based on a clear mathematical model that enhances interpretability in the healthcare and medical fields. It effectively handles confounders and is robust to outliers, addressing the complexity inherent in health data relationships.
We constructed Directed Acyclic Graphs (DAGs) that estimate the causal structures linking important health features and outcomes. DAG consists of vertices (nodes) connected by directed edges without cycles, representing the relationships and dependencies between variables. In this graph, the nodes represent variables, arrows indicate the direction of influence, and coefficients along the paths quantify the strength of these relationships.
Validation of causal relationshipsThe fitting and analysis of Structural Equation Modeling (SEM) [27] models play an important role in the graph model. To validate the reliability of the causal graph, we conducted a hypothesis test using SEM. This method evaluates the consistency of a hypothesis with the collected data by modeling the relationships between variables. By comparing model predictions with real data, we could verify the validity of the hypotheses. The models were fitted and analyzed using the Python semopy library [28] to validate and evaluate the statistical significance of the paths.
Figure 3 (a) depicts the five selected health features within the causal graph of the TCMHS. In this graph, TCMHS directly affects WUC, StepN, and StressS, with path coefficients of 0.30, 0.50, and 0.31, respectively. Additionally, Fig. 3 (a) shows the complex interactions among the health features. Both BreathQ and TSD directly affect WUC, with path coefficients of 0.12 and 0.19, respectively, suggesting that WUC serves as a mediator variable influenced by multiple factors. The results of the statistical tests are presented in Table 6, where all the analyzed paths showed significance with p < 0.05 or p < 0.001.
Figure 3 (b) depicts the seven selected features in the causal graph of the target. In this graph, the target is directly affected by BMI, ABP, and LTG, with path coefficients of 0.38, 0.35, and 0.29, respectively. Additionally, Fig. 3 (b) shows the complex interactions among the independent indicators. The path from GLU to LTG, then to TC, and finally to LDL shows direct effects with path coefficients of 0.26, 1.24, and 1.00, respectively. The results of the statistical tests are summarized in Table 7, where all paths showed significance with p < 0.001.
Table 6 Results of hypothesis test on WD-health datasetTable 7 Results of hypothesis test on open dataset for diabetesDiscussionTables 2 and 4 present comparisons of our proposed approach against the baselines for the two datasets. Our approach outperformed the baselines in most metrics while determining fewer features. Specifically, the model for the WD-health dataset accounted for 53.6% of the variation in the target variable, with the remaining 46.4% attributed to other factors. Additionally, the model for the open diabetes dataset explained 64.7% of the variation in its target variables. Although the number of selected features (k) in our approach for the open diabetes dataset was not the lowest, it was the second best. Figures 3 (a) and (b) show the causal relationships within the two datasets. Figure 3 (a) highlights the connections between mental health, physical activity, sleep quality, and overall health, whereas Fig. 3 (b) highlights the importance of BMI and ABP in daily health management and suggests that LTG serves as a key indicator that interacts with other indicators.
In our previous study [29], we proposed a framework for estimating latent risk factors and health abnormalities using a domain model, which requires expert knowledge for its construction. In [30], we proposed using causal discovery algorithms to construct causal graph models as alternatives to expert-based domain models. However, selecting important features before constructing causal graphs is necessary. In this study, we proposed a combination of multiple feature selection methods to determine these important features. By using multiple feature selections, we can estimate latent risk factors and health issues without relying on domain expertise.
Our proposed framework for multiple feature selection based on an optimization strategy for causal analysis of health data has potential applications in personalized healthcare, where wearable devices are employed to continuously monitor daily health indicators such as heart rate, sleep quality, and blood oxygen. By identifying the important features and uncovering causal relationships between health indicators, individuals can manage their health in an objective manner and improve their lifestyles and behaviors. Furthermore, the early warning signs of lifestyle-related diseases such as diabetes and cardiovascular diseases can be detected. Moreover, it can be integrated within mobile healthcare applications as a personal AI health assistant, offering individuals personalized health advice based on their data through multimodal data fusion, including text, audio, or images.
However, this study has limitations, including its sensitivity to data quality and the need for large and diverse sample sizes to ensure robustness.
留言 (0)