Depot-medroxyprogesterone acetate (DMPA) and Norethisterone-Enanthate (NET-EN) are both progestin-only injectable contraceptives widely used in preventing conception and unwanted pregnancy, particularly in sub-Sharan African countries (1, 2). The high use of these injectable hormonal contraceptives (HC) overlaps with high prevalence of HIV-1 and HSV-2. A number of epidemiological and clinical studies indicate that DMPA is associated with higher risk of HIV-1 acquisition and other STI such as HSV-2 (3–8). Meta-analyses data show that DMPA is associated with a 40-50% increased risk of HIV-1 compared to women not taking hormonal contraception (1, 2). DMPA was also recently identified as a risk factor for male-to-female sexual transmission of HSV-2 (9). The World Health Organization recently (2020) reported that 102.9 million (43.9%) reproductive age (15-49 years) women in African countries and 57.7 million (24%) in the Americas are infected with HSV-2 (10). While there are fewer studies on NET-EN and STI risk, no such association has been reported (4, 11, 12). Therefore, better understanding of how DMPA and NET-EN affect susceptibility to HIV-1 and HSV-2 remains an important public health issue to offer better and safer contraceptive options to women.
Several mechanisms linking hormonal contraceptives including DMPA to increased STI susceptibility have been described (12, 13). Both DMPA and NET-EN are injectable progestins, but they have different mechanisms of action. DMPA, but not NET-EN, shows higher binding affinity to glucocorticoid receptor (GR) (12, 14, 15). In murine models of vaginal tract infection, we and others have shown that DMPA increases susceptibility to HIV-1 and HSV-2 infections by decreasing cell-cell adhesion molecules, thinning the epithelial layer, breaching barrier integrity, and increasing HIV target cells and vaginal epithelial permeability (4, 5, 16). A recent study revealed comparable susceptibility and mortality rates in DMPA and NET-EN treated wild type and humanized mice after intravaginal infection with HSV-2 and cell-associated HIV-1 (4). Several clinical and ex vivo studies have documented that DMPA is immunosuppressive and impacts both innate and adaptive immunity, which has not been shown for NET-EN (12, 17–19), although controversies exist among studies due to inconsistent results. As reviewed in Hapgood et al. (13), DMPA, but not NET-EN, was shown to suppress the production of several T cell-derived cytokines and chemokines (20). Another study showed both DMPA and NET-EN increase proinflammatory cytokines in the vaginal fluids (21). A recent study in healthy women using pharmacological concentration of DMPA and NET-EN did not show broad immunosuppression effects but did find DMPA and not NET-EN usage resulted in decreased IFN-γ and TNF-α-producing CD4+ and CD8+ T cells after prolonged exposure (22, 23). Furthermore, MPA at physiological concentrations significantly inhibited the activation of T cells isolated from healthy premenopausal women, conversely, no immunosuppressive effects observed with NET-EN treatment (20). It is believed that some combination of CD4+ T cells and CD8+ T cells is indispensable to protect against HSV-2 infection in the lower female genital tract of women (24, 25). Both clinical and experimental studies documented that mucosal T cells play an important role in controlling HSV-2 infection (26, 27). Assessing genital pathology in HSV-2 infected women revealed that virus clearance is heavily dependent on CD8 T cells that participate in active immune surveillance at the sites of HSV-2 reactivation (24, 28). In addition, studies examining HSV-2 in the female reproductive tract (FRT) showed that 90% of HSV-2 specific CD3+ T cells detected were CD4 T cells (28, 29). Likewise, murine model studies have shown that compared to antibody responses, T helper 1 (Th1) immunity and the production of IFN-γ are critical for protection against HSV-2 (28, 30, 31).
In the female reproductive tract, the epithelium of the cervix and its glands secrete mucins that act as a physical and chemical barrier against pathogens in the uterus and vagina. Mucin glycoproteins are key components of innate immunity. These high molecular weight and highly glycosylated proteins are either located at the cell membrane (MUC1, MUC4, MUC13 and MUC16) or are secreted extracellularly (MUC5AC, MUC5B and MUC6) to form mucus gel that covers the moist epithelium. Mucus hydrates, lubricates and acts as the first line of defense against pathogenic bacteria and viruses (32). Evidence indicate that mucin glycoproteins comprise a large proportion of the female reproductive tract tissue epithelial surface. Of these mucins, Muc1 is persistently expressed throughout the reproductive tract mucosa including uterus, cervix and vagina. It plays important roles in normal reproductive functions and in protection from infections (33). Muc1 has also been shown to be a crucial component of innate immunity playing an important anti-inflammatory role during airway infection caused by bacterial and viral pathogens (34–36). Steroid hormones control Muc1 expression which has been studied in mice where estrogen stimulates the mouse Muc1 gene expression at the apical surface of the reproductive tract mucosal epithelium, progesterone in contrast, antagonizes the stimulatory action of estrogen (37, 38). Mucins have emerged as one of the important components of the immune regulatory arsenal which can suppress immune cell recruitment and cytokine production in vivo (39, 40). Purified mucins from human breast milk inhibit HIV-1 infection as assessed in an in vitro HIV-1 p24 assay and SARS-CoV2 in an infectivity assay using Vero E6 cells (41, 42). Even though the available evidence indicates that the cervical mucus is regulated by hormones and it can pose a significant barrier to entry of pathogens, the effect of hormonal contraceptives on mucus production needs to be studied since it could affect protection against HSV-2 in FRT.
To address the gaps in the field, we performed a comprehensive study using a murine model, to assess in vivo the effects of NET-EN and DMPA on HSV-2 susceptibility and the underlying mechanisms with major focus on T cell immune response and vaginal mucus production. We demonstrate that NET-EN slows down HSV-2 infection, compared to DMPA treatment. We further show that DMPA treatment appeared to significantly decrease the number of T cells in the vagina while selectively enhancing the frequency of TNF-α producing CD4 and CD8 T cells. NET-EN, on the other hand, appeared to significantly enhance the frequency of IFN-γ producing CD4 and CD8 T cells. Among splenic lymphocytes, NET-EN enhances the frequency of CD8 T cells and IFN-γ producing CD4 and CD8 T cells, while DMPA selectively decreases frequencies of CD4 T cells and enhances percentages of TNF-α+ CD4 T cells. Importantly, we show that DMPA treatment, but not NET-EN, diminishes mucin production and higher mucin, cell-associated mucin in particular, in NET-EN treated mice correlated with lower HSV-2 infection in the vaginal tract.
2 Materials and methods2.1 MiceEight- to ten-week-old C57BL/6 female mice were purchased from Charles River Laboratories (Saint-Constant, Quebec, Canada). All mice were maintained under specific-pathogen-free and standard temperature-controlled conditions that followed a 12 h light and 12 h dark cycle. To ensure that mice remained specific pathogen free, routine quality assurance was conducted by serology and PCR, and this included testing dirty bedding, sentinels, direct resident animals, and exhaust air duct samples of racks. All animal studies were approved by, and in compliance with, the Animal Research Ethics Board at McMaster University in accordance with the Canadian Council of Animal Care guidelines.
2.2 Ovariectomy surgeriesTo remove the influence of any endogenous hormones in mice they underwent ovariectomy (OVX), according to previously published protocols (43). Briefly, mice were administered an injectable anesthetic preparation of ketamine and xylazine intraperitoneally. Ovaries were removed by making two bilateral incisions, followed by small incisions through the peritoneal wall, and excising them through the incisions. Peritoneal muscle incisions were closed by sutures and subcutaneous incisions were closed using surgical clips. All mice recovered for 10 to 14 days before the start of experiments.
2.3 Hormone treatments and measurementTo examine the effect of NET-EN and DMPA, two weeks after OVX, mice were treated by subcutaneous injection of Medroxyprogesterone acetate (DMPA, 2 mg) and subcutaneous insertion of NET-EN hormone pellets (2.5 mg) (experimental design in Figure 1E) manufactured by Innovative Research of America (Sarasota, FL, USA), according to previously published protocols (43). In a separate sets of experiments (experimental design in Figure 1A), a group of wild-type naïve C57BL/6 mice and OVX mice were implanted with NET-EN 2.5 mg pellets subcutaneously as a hormone intact model to represent the preclinical scenario in fertile women who receive hormonal contraceptive. These hormone pellets are designed to release 476 ng/day/mouse for 21 days. Briefly, 2 weeks following OVX surgery, mice were anesthetized with isoflurane and implanted subcutaneously with NET-EN pellets. The level of serum MPA and NET resulting from this dose are shown in Supplementary Figure S1. These serum levels correspond to those shown previously with physiological doses of DMPA and NET-EN in women (44, 45).
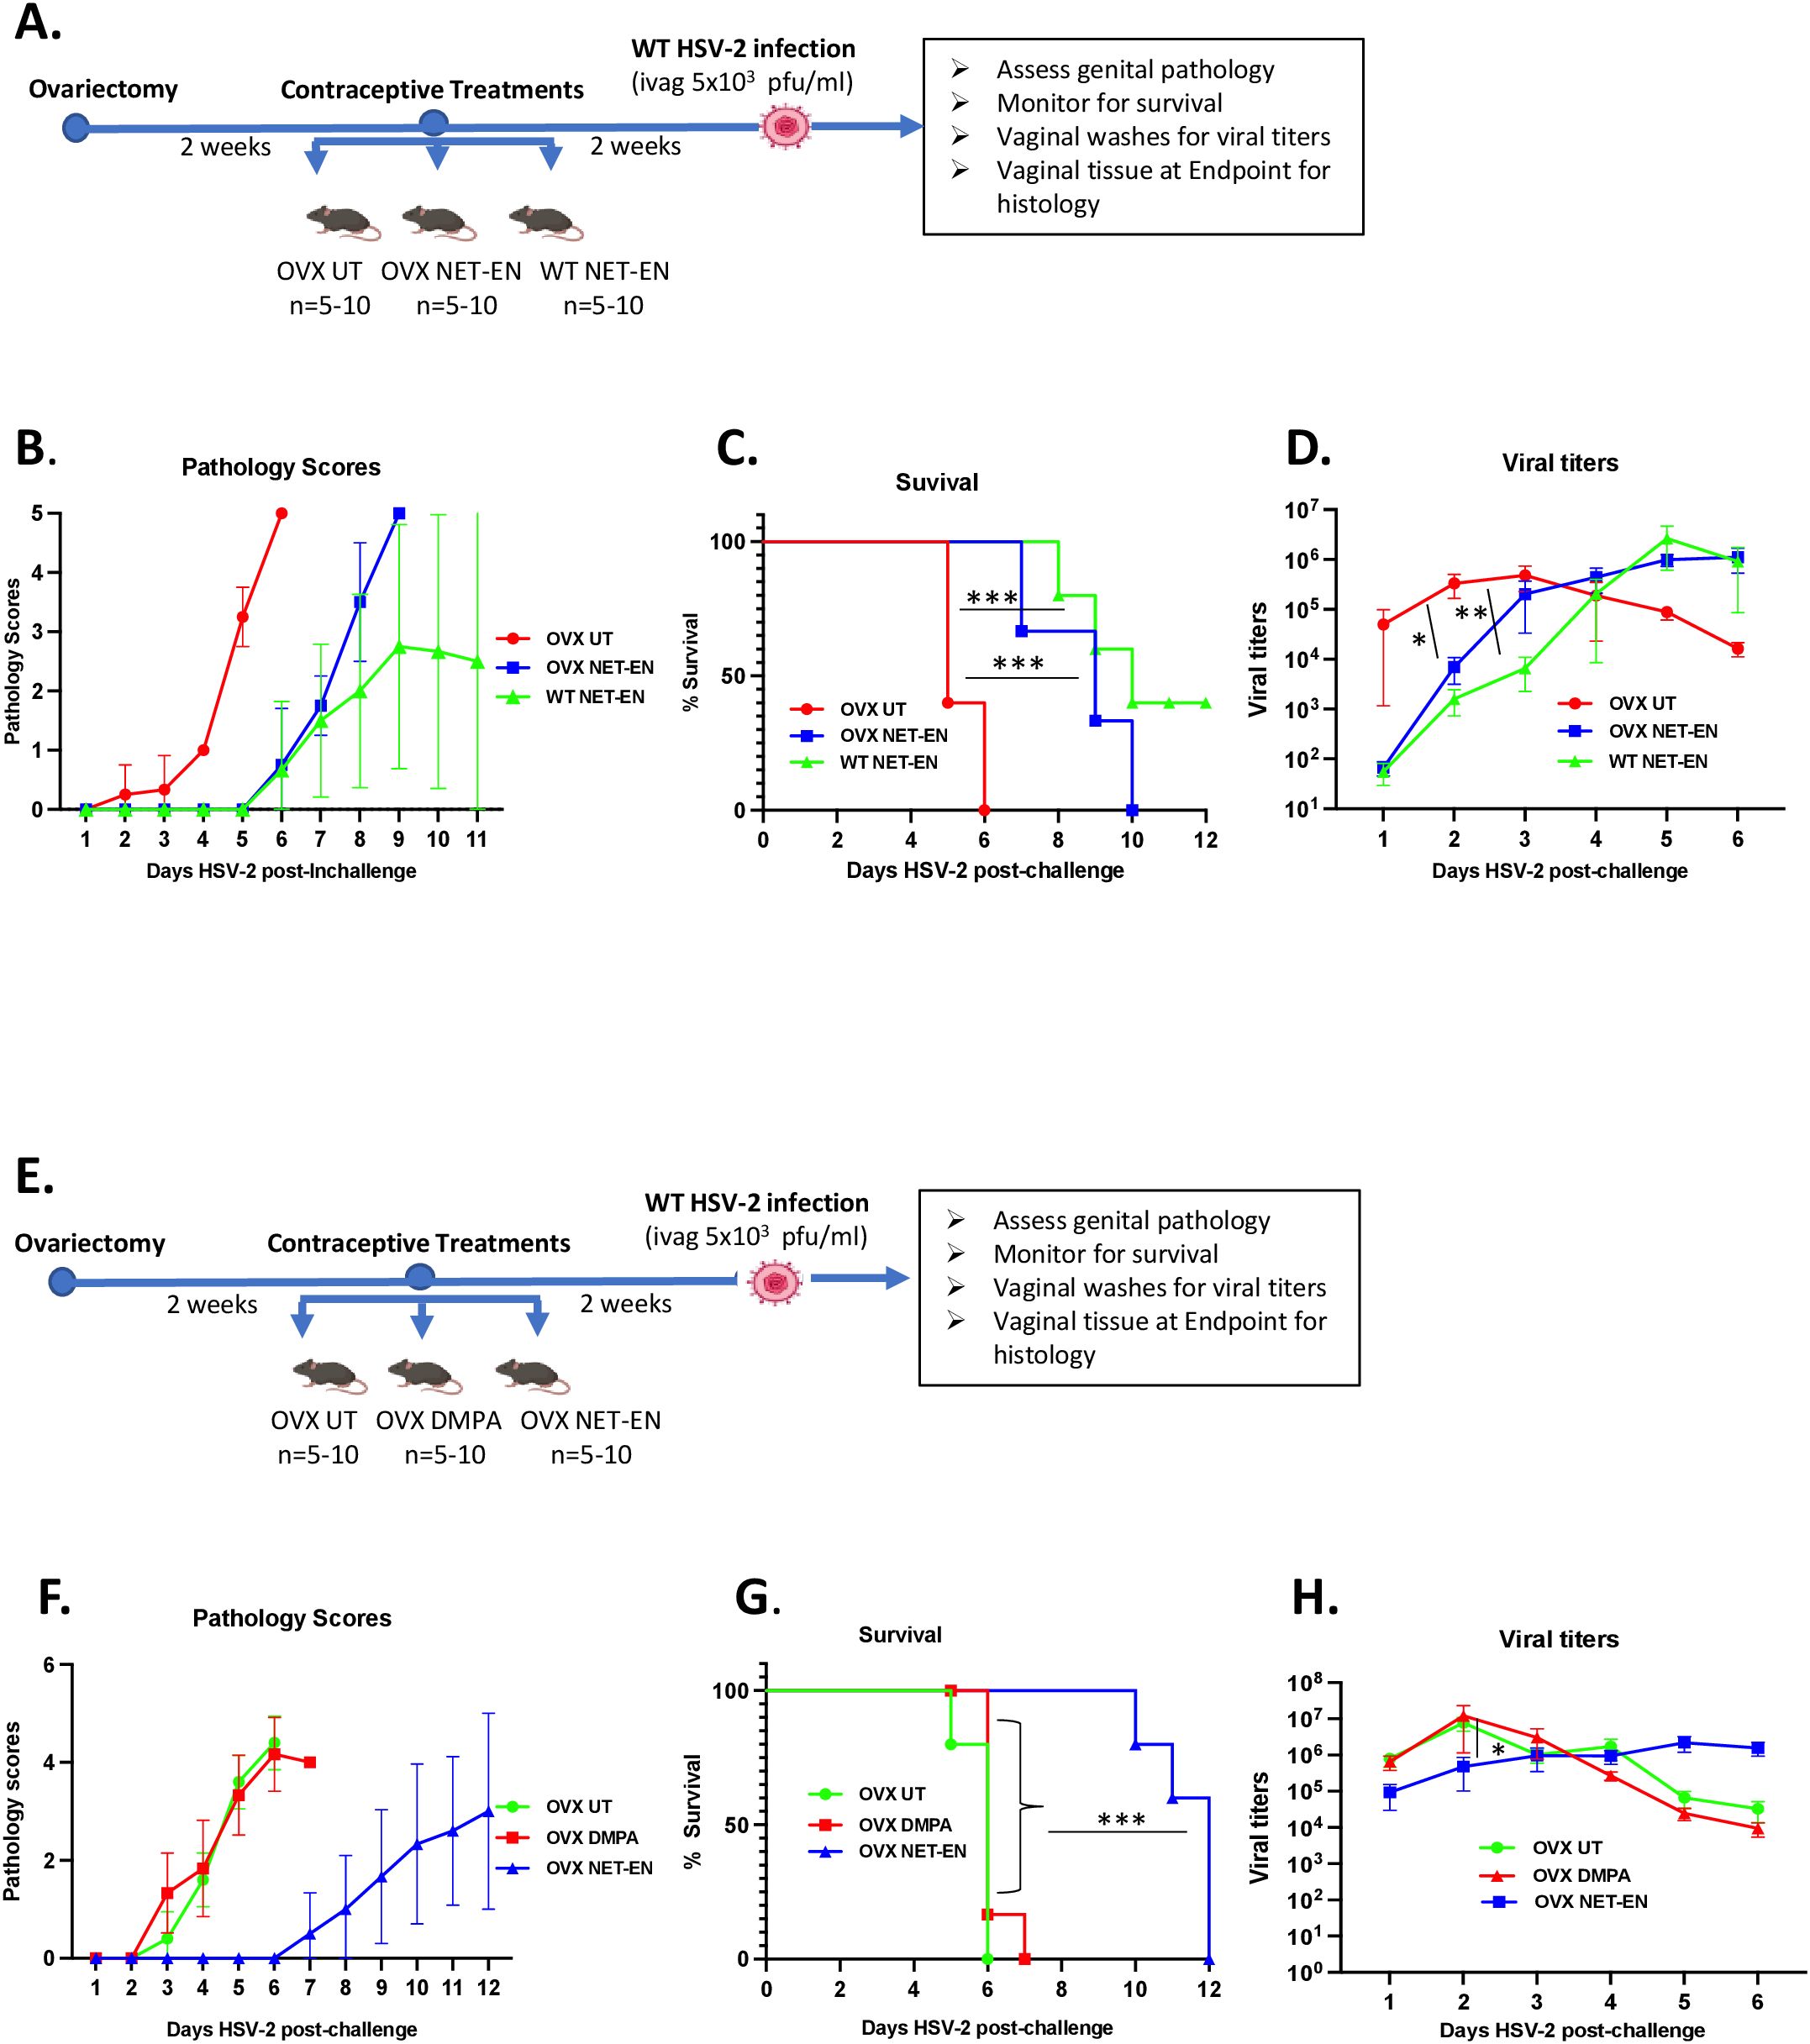
Figure 1. Analysis of survival rates, pathology and HSV-2 virus titers in the vaginal tract following NET-EN, DMPA, or no treatment of WT naïve and OVX mice. C57BL/6 wild-type or OVX mice (n=5/group) were treated with NET-EN, DMPA or were untreated (UT) for 2 weeks prior to intravaginal challenge with HSV-2 (5 x 10³ PFU/mouse). After challenge, vaginal washes were collected daily for up to 6 days to determine viral titers. Mice were also monitored for survival, and pathology scores recorded daily for up to 12 days. (A) Schematic depiction of experimental design. (B) Average pathology scores for OVX UT, OVX NET-EN and WT NET-EN treatment groups are depicted. (C) Survival of mice among the aforementioned treatment groups. (D) Data shown represent the average viral load per group (mean ± SEM) for each day. (E) Schematic demonstration of experimental design. (F) Average pathology scores for OVX UT, OVX DMPA and OVX NET-EN treatment groups are shown. (G) Survival of mice among OVX UT, OVX DMPA and OVX NET-EN treated groups. (H) Data shown represent the average viral load per group (mean ± SEM) for each day. Significance of difference in survival (C, G) was calculated using the log rank (Mantel-Cox) test (***, P < 0.001). Significance of differences in viral load (D, H) were analyzed using a one-way ANOVA with Tukey’s multiple-comparison test. *, P < 0.05, **, P<0.01.
NET and MPA concentrations in serum samples were measured by a combination of Ultra Performance Liquid Chromatography paired with Mass Spectrometry (UPLC-MS) at the Small Molecule Biomarker Core facility at the University of Pittsburgh School of Pharmacy (Pittsburgh, Pennsylvania, USA), as described previously (46). Briefly, Testerone-d3 was added as in internal control to each serum samples and liquid-liquid extraction performed with N-butyl chloride. After centrifugation (4000 RPM) the supernatants were collected and dried with nitrogen at 40 deg C and then reconstitution in 50:50 acetonitrile:water. An Acquity UPLC system with BEH C18 column (Waters) to perform a gradient liquid chromatography. A TSQ Quantum Ultra triple quadrupole mass spectrometer (Thermo Scientific) with a heated electrospray ionization (HESI) source was used to perform Tandem mass spectrometric (MS/MS) analyses. Data acquisition and processing was performed with Xcalibur software v4.0 (Thermo Scientific, San Jose, CA, USA).
2.4 Intravaginal HSV-2 challengeHormone treated mice were challenged intravaginally with HSV-2. Two weeks after hormone treatments, mice were anaesthetized intraperitoneally with ketamine/xylazine and infected with 10 µL WT HSV-2 strain 333 (5x10³ PFU/mouse) intravaginally. After inoculation, mice were placed on their backs for approximately 30 to 45 min to allow for the inoculum to infect the vaginal tract.
2.5 Collection of vaginal washesVaginal washes were collected for up to 6 consecutive days post-challenge by pipetting 30 µL of phosphate-buffered saline (PBS) into and out of the vagina 5 to 6 times. This was repeated twice to collect a total volume of 60 µL/mouse that was stored at -80°C until required.
2.6 Genital pathology scoringGenital pathology was monitored daily post-challenge based on a five-point scale, as described previously (47): no infection (0), slight redness of external vagina (1), swelling and redness of vagina (2), severe swelling and redness of vagina and surrounding tissues (3), genital ulceration with severe redness and hair loss (4), and severe ulceration extending to surrounding tissues, ruffled hair, and lethargy (5). Animals were sacrificed before they reached stage 5. To compare groups, cumulative pathology scores were determined by tabulating the number of mice with the highest score of pathology they achieved and the number of days that score was observed. Mice that did not survive the challenge/reached endpoint and had to be euthanized were given the highest pathology score for the duration of the experiment to accurately reflect overall pathology for each group. The sum of these scores for all the mice was the total level of pathology for each group, and the average pathology score per mouse for each group was then calculated.
2.7 Viral titrationViral shedding in vaginal washes was determined by conducting viral plaque assays on Vero cell (ATCC, Manassas, VA) monolayers, as described previously (47). Vero cells were grown in α-MEM (Gibco Laboratories, Burlington, ON, Canada) supplemented with 5% fetal bovine serum (FBS; Gibco Laboratories), 1% penicillin-streptomycin (Invitrogen, Burlington, ON, Canada), L-glutamate (Bio-Shop Canada Inc., Burlington, ON, Canada), and 1% HEPES (Invitrogen). Cells were grown to confluence in 12-well plates, and vaginal washes were serially diluted in serum-free α-MEM and then added to monolayers. Infected monolayers were incubated at 37°C for 2 h with intermittent shaking in every 20 to 30 minutes and then overlaid with 10% FBS-α-MEM. The plates were then incubated at 37°C for 48 h to allow infection to occur. Next, cells were fixed and stained with crystal violet, and viral plaques were enumerated under a microscope. The number of PFU per milliliter was calculated by taking a plaque count for every sample and accounting for the dilution factor.
2.8 Single cell isolation from tissues and culturesSpleen cells were isolated by mechanically disrupting the spleen on a 40 µm filter a 6-well plate, centrifuged and red blood cells lysed by ACK lysis buffer (0.15 M Ammonium chloride, 0.01M Potassium bicarbonate, 0.0001 M Disodium EDTA in 1 L distilled water (pH 7.2), our laboratory made). The remaining cells were washed and resuspended in RPMI 1640 medium supplemented with 10% FBS, 100 IU/ml penicillin, 100 g/ml streptomycin, 1% L-glutamine, 0.1% 2-mercaptoethanol, 1% nonessential amino acids, and 1% sodium pyruvate (Gibco Life Technologies, Burlington, ON, Canada). For vaginal tissue analysis, vaginal tracts were removed, pooled, cut lengthwise, washed to remove mucous, and minced into 2- to 4 mm pieces. The vaginal tissue pieces were enzymatically digested in 15 ml of RPMI 1640 containing 0.00157 g/ml collagenase A (Roche Life Science, USA) at 37°C on a stir plate for 2 h and filtered through a 40 µm filter to obtain a total tissue cell suspension (48). Vaginal cell samples were then centrifuged for 10 min (1,200 rpm) at 4°C.
Single-cell suspensions from different tissues were resuspended in 1 to 5 ml of RPMI medium. Finally, mononuclear cells were counted, and cell preparations were seeded in a 96-well plate at 1 x 10⁶ cells/well for spleen and 5x10⁵ cells/well for vaginal samples; the total volume in the well was topped up to 200 µL with complete RPMI 1640 medium. Cells were either left unstimulated or cultured with a T cell stimulation cocktail plus protein transport inhibitors (500x) (cocktail of PMA, ionomycin, brefeldin A, and monensin (eBioscience, San Diego, CA, USA) for up to 16 h.
2.9 Flow cytometryFollowing 12 to 16 h of incubation with the stimulation cocktail at 37°C, cells were collected, washed and incubated for 15 min with 50:l of Fc block (anti-mouse CD16/32; BD Bioscience) to reduce nonspecific Fc receptor staining. Cells were then stained for cell surface markers using the following antibodies at concentrations based on manufacturer’s instructions: anti-CD4-PerCP-Cy5.5, anti-CD3-PE-CF594 and anti-CD8-BV786 (Invitrogen). Cells were incubated with these antibodies for 30 min and washed. Cells were then stained with allophycocyanin (APC)-ef780 viability dye (eBioscience) for 20 mins and washed. Cells were permeabilized and fixed for 20 mins using the BD Cytofix/Cytoperm buffer set (BD Biosciences) according to the manufacturer’s protocol. Cells were then stained for intracellular markers using the following antibodies: anti-IFN-γ-BV421 and anti-TNF-α-FITC (Invitrogen). All antibodies were validated and titrated for optimal conditions before their application in the experiments. The accuracy of staining positive cutoffs was verified by fluorescence minus one (FMO) controls. Data was collected for mononuclear lymphocytes populations isolated from spleen and vaginal tract by flow cytometric analysis using CytoFLEX flow cytometer system (Beckman Coulter Life Sciences, Indianapolis, USA), and results were analyzed using FlowJo software (Tree Star, Ashland, USA).
2.10 Histology, PAS staining and Muc1 protein and HSV-2 ImmunohistochemistryVaginal tissues were collected from OVX mice after 1 week and 3 weeks of NET-EN and DMPA treatments, and at the end point following HSV-2 challenge. Tissues were fixed in 10% formalin or methacarn solution (60% methanol, 30% chloroform and 10% glacial acetic acid) for 48-72 h. Vaginal tracts were then cut into two pieces, placed in cassettes and transferred to 70% ethanol. The McMaster Immunology Research Center (MIRC) Histopathology Core Facility processed tissues and performed, PAS (Periodic Acid Schiff) staining, Muc1 and HSV-2 immunohistochemical staining. Briefly, Muc1 protein was detected in vaginal tissue sections with Muc1 monoclonal hamster antibody (MH1, CT2, Invitrogen, ThermoFisher Scientific, Canada) and HSV-2 was detected by monoclonal mouse anti-HSV-2 antibody (AP1 (B019) (Novus Biologicals, Cedarlane, Burlington, Canada) staining following antigen retrieval in citric acid using a standard biotin-streptavidin detection system and 3,3’-diaminobenzidine tetrahydrochloride as chromagen, then counter staining with hematoxycilin. Slides were scanned using the Leica Aperio Scanscope XT and viewed using Aperio ImageScope software. In order to verify the specificity of the Muc1 antibody in our system, we ran positive and negative controls (49) by testing vaginal tissue sections collected from normal mice in estrus as negative control and that of normal mice in diestrus as positive control. Signal intensities of both PAS and Muc1 images were quantified using Fiji ImageJ software (NIH, Bethesda, MD, USA).
2.11 Muc1 ELISAVaginal washes were collected from OVX mice one week or three weeks after placebo, NET-EN or DMPA treatments and stored at -80 °C. Muc1 concentrations in the vaginal washes was measured by mouse Muc1 ELISA kit (Novus Biologicals, Cedarlane, Burlington, ON) according to the manufacturer’s instruction.
2.12 Statistical analysisStatistical analysis and graphical representation were performed using Graph-Pad Prism 10 (GraphPad Software, San Diego, CA). The Mantel-Cox log rank test was used to calculate significant differences in survival. Data are expressed as means with standard errors of means (SEMs) error bars, typically derived from a minimum of 3 independent experiments, with n=5-10 mice/group. Significance was calculated by comparing means using one-way analyses of variance (ANOVA) or t tests, with appropriate additional tests, as indicated in the figure legends. Data were considered statistically significant if the P values were <0.05. Significant differences are indicated as *P<0.05, **P<0.01, ***P<0.001 or, ****P<0.0001.
3 Results3.1 NET-EN treatment extends survival and delays genital pathology in OVX mice intravaginally infected with HSV-2, in comparison to DMPA treatmentWe and others have previously reported that DMPA-treated mice show enhanced genital pathology and mortality following wild type (WT) HSV-2 virus challenge (4, 5, 50–52). Studies have shown that DMPA enhances the susceptibility of wild-type mice to genital HSV-2 infection by disrupting mucosal barrier functions (16, 50) and a more recent study found comparable mortality rates and increased genital mucosal permeability between DMPA versus NET-EN treated wild-type mice, but slower onset of genital pathology with NET-EN treatment (4).
In this study we compared the effects of NET-EN and DMPA on intravaginal HSV-2 infection utilizing ovariectomized (OVX) mice to exclude any internal hormonal influence. To optimize delivery of physiologically relevant doses of hormones, we compared serum levels in mice at varying doses (Supplementary Figures S1A, B). Of note, NET or MPA was not detected in serum samples of OVX untreated mice that we used as negative controls by the highly sensitive and robust hormonal assay system (Supplementary Figures S1A, B). The levels of hormone were comparable to that found in women using those contraceptives, based on published pharmacokinetic studies for NET-EN and DMPA in women that showed serum NET concentration of ~33 ng/ml and MPA concentration level 2.3-4.6 ng/ml (44, 45). Thus, these doses were used throughout this study: NET-EN (2.5 mg pellet, 21-day release) and DMPA (2 mg s.c. injection).
Experimental designs for two separate experiments are depicted in Figures 1A, E. OVX mice were subcutaneously treated with NET-EN or DMPA and compared to untreated (UT) controls (Figure 1E). In a separate set of experiment, wild-type naïve mice and OVX mice were treated subcutaneously with NET-EN to compare the effects of NET-EN in hormone intact versus hormone deficient mice and a group of OVX untreated mice used as controls (Figure 1A). Two weeks later, mice were challenged intravaginally with HSV-2 (5x10³ pfu), and then monitored for survival, genital pathology and with vaginal washes collected to assess viral titers. Although the major purpose of this study was to understand the mechanistic insights as to how hormonal contraceptive NET-EN regulates the susceptibility to HSV-2 infection compared to well-studied DMPA, we first assessed the impact of NET-EN on wild-type naïve mice versus OVX mice (experimental design shown in Figure 1A). Here we observed lower levels and delayed genital pathology starting at day 5 post-challenge and 40% survival in NET-EN treated wild-type mice. NET-EN treated OVX mice showed delayed onset of genital pathology (day 5) similar to WT naïve mice, however, all mice succumbed to infection by day 10 post-challenge. In contrast, OVX untreated control mice showed genital pathology as early as day 2 and all mice reached end-point by day 6 post-challenge (Figures 1B, C). Further, NET-EN treated WT and OVX mice showed significantly lower virus shedding on day 2 but higher shedding on day 5/6 post challenge compared to OVX UT mice (Figure 1D).
We then evaluated the effects of NET-EN and DMPA in OVX mouse model (experimental design depicted in Figure 1E). We found that NET-EN-treated mice had a delayed onset of genital pathology starting around day 6 post-challenge and survived up to day 12 (20% mortality at day10 and day 11, and 60% mortality at day 12) (Figures 1F, G). In contrast, DMPA-treated mice and untreated control mice developed genital lesions starting from day 2 and all mice reached endpoint by day 7 (DMPA group) or day 6 (UT OVX) post-challenge (Figures 1F, G). The differences seen in pathology and mortality time course in NET-EN and DMPA-treated mice was clearly quantitated by the calculated cumulative pathology scores shown in Table 1. The untreated and DMPA-treated mice had similar scores (31.8 and 30, respectively) while NET-EN was much lower (7.0). Vaginal washes collected daily from days 1 to 6 post-challenge were assessed for viral titers. NET-EN-treated mice exhibited significantly lower virus shedding at day 2 post-challenge compared to DMPA- and untreated mice that showed the highest virus titers on day 2 (Figure 1H). Collectively, NET-EN-treated OVX mice show delayed mortality, delayed onset of genital pathology and delayed viral shedding after primary HSV-2 infection compared to DMPA treated mice.

Table 1. Cumulative pathology scores1 12 days after HSV-2 challenge of untreated, DMPA and NET-EN treated OVX mice (n=5 mice per treatment groups).
3.2 NET-EN and DMPA have differential effects on the frequencies and numbers of CD4 and CD8 T cells in the vaginal tractRecent murine model studies indicate that both DMPA and NET-EN increase genital mucosal permeability to activated leukocytes, although the effect of NET-EN was less pronounced (4). A few human studies have shown that DMPA enhances T cell IFN-γ and TNF-α production (22, 23), but others found no difference between NET-EN and DMPA on T cell responses in women (21). Definitive data on the effects of DMPA or NET-EN on frequencies and functions of CD4 and CD8 T cells, particularly in murine model is lacking. To address the paucity of data on T cell responses with NET-EN and DMPA, we compared their effects on CD4 and CD8 T cell frequency, number and cytokine responses in mice, both in local FRT tissue and systemic spleen tissue. Ovariectomized mice were treated subcutaneously with DMPA (2 mg) or NET-EN (2.5 mg) and 3 weeks later cells were isolated from the vaginal tract and were stimulated with PMA/Ionomycin and analyzed by flow cytometry for cytokine production (protocol described in Supplementary Figure S2). For analysis, cells were first gated on lymphocyte populations, followed by single cells and finally gated on live lymphocytes expressing CD3 (gating strategy depicted in Supplementary Figure S3). Next, CD3+ T cell populations were further gated to identify the percentages of CD4+ and CD8+T cells present in the vaginal tract (Figure 2A). Total counts of CD8 or CD4 T cells for each subpopulation were calculated based on the number of viable cells per mL of isolated VT cells run on flow cytometer, times the number of viable CD4 or CD8 T cells displayed in the flow cytometry result (31).
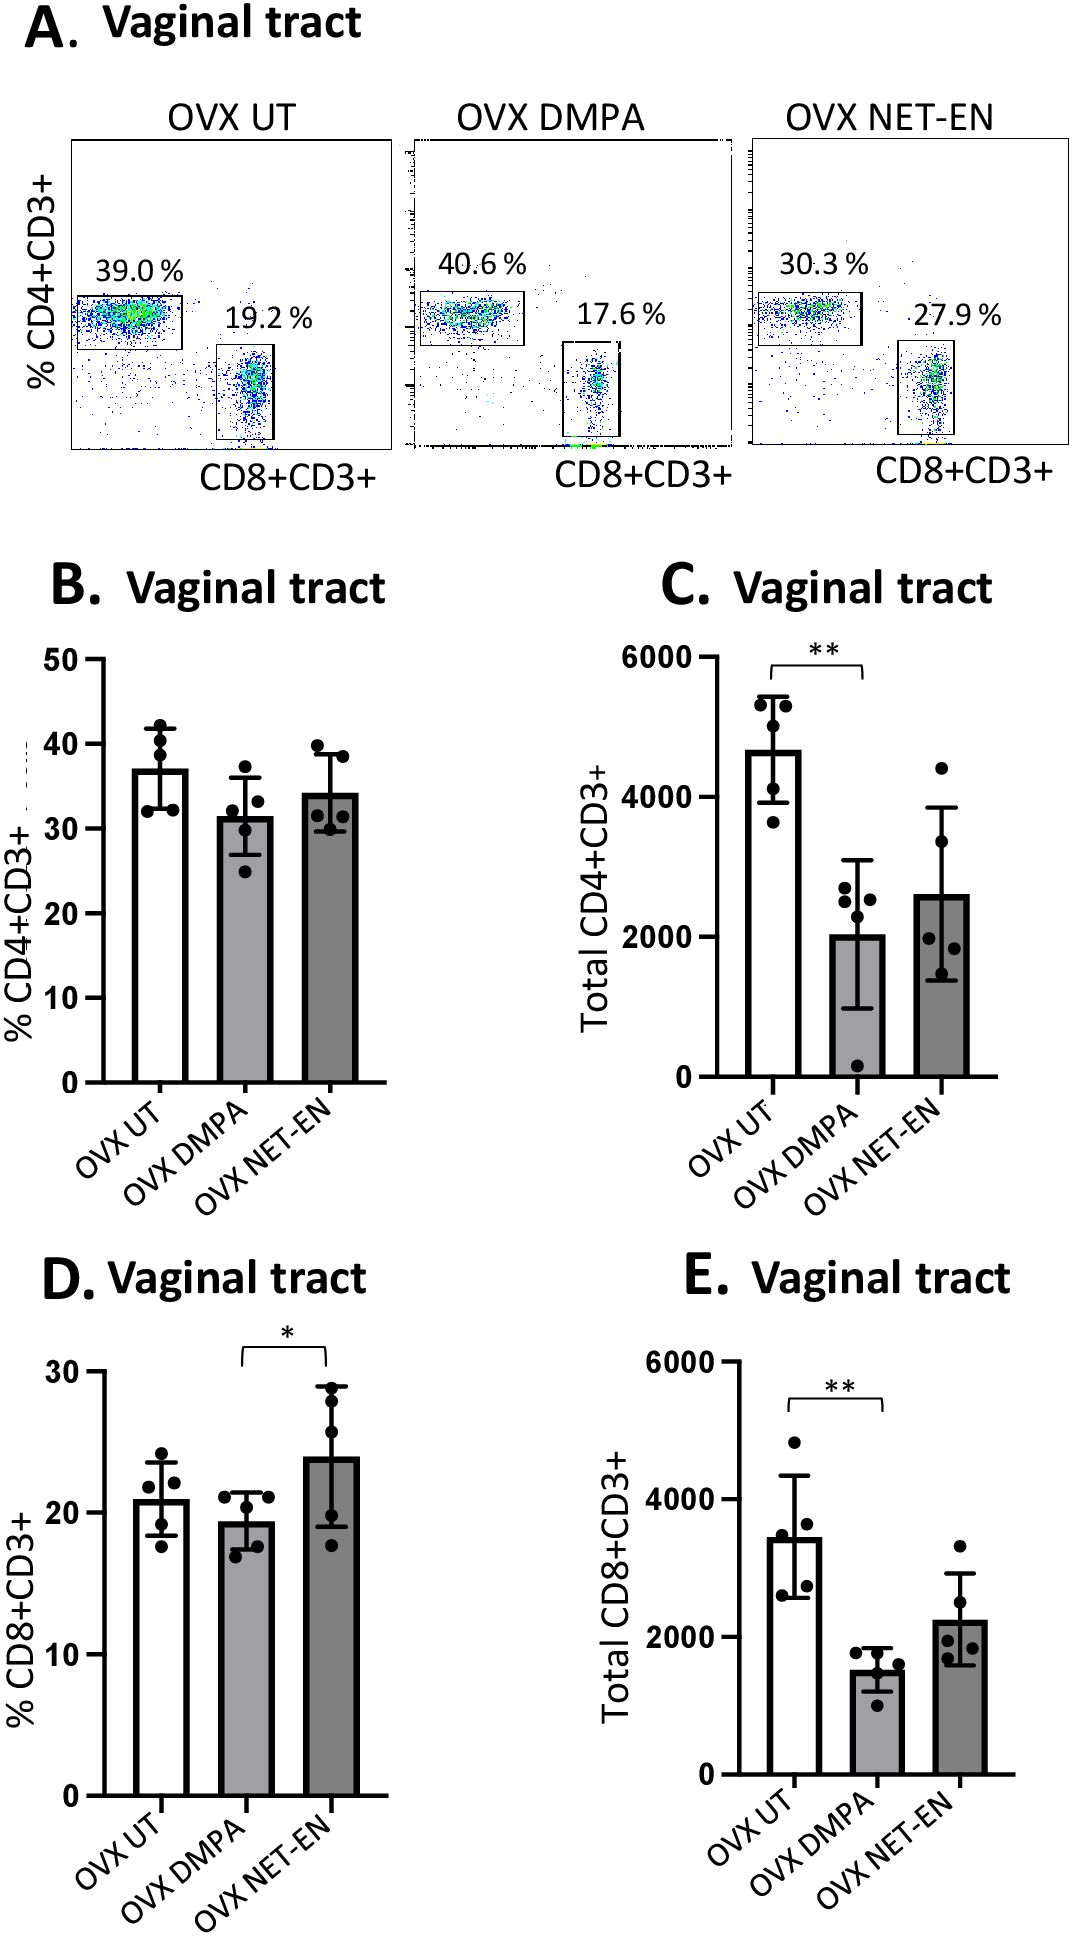
Figure 2. Analysis of vaginal tract CD4 and CD8 T cell frequencies in NET-EN-treated, DMPA-treated and untreated OVX mice. OVX mice were treated with NET-EN (2.5 mg) or DMPA (2 mg) or left untreated (UT) for 3 weeks. Mice were then sacrificed, VT tissues were collected, and single cell suspensions were isolated. The cells were then stimulated with the T cell stimulation cocktail up to 16 h, followed by fluorescence antibody staining for extracellular markers including CD3, CD4 and CD8 prior to analysis by flow cytometry. A primary gating strategy (Supplementary Figure S3) allowed analysis of viable, single CD3 positive lymphocytes. (A) Representative dot plots showing identified CD4+ and CD8+ T cells. (B) Bar graph shows the percentage of viable CD4+ T cells, mean ± SEM (n = 5). (C) Bar graphs displaying the total number of CD4+ T cells per vaginal tissue, mean ± SEM (n = 5). (D) Bar graphs showing the percentage of CD8+ T cells, mean ± SEM (n = 5) and (E) total number of CD8+ T cells, mean ± SEM (n = 5), for each vaginal tissue isolated from NET-EN, DMPA or untreated (UT) mice. Bars indicate mean ± SEM. All data were collected from 3 independent experiments. Data were analyzed utilizing the one-way ANOVA with Tukey’s multiple comparison test. *, P <0.05; **, P <0.01.
Neither DMPA nor NET-EN treatment caused any noticeable changes in frequencies of CD4 T cells in the vaginal tissue (Figure 2B), but DMPA resulted in significant depletion of total number of CD4 T cells present in the vagina, compared to untreated control group (Figure 2C). Although neither NET-EN or DMPA treatments altered the frequency of CD8 T cells relative to control, NET-EN-treatment resulted in slightly higher frequency of CD8 cells than DMPA-treatment (Figure 2D). A reduction in total numbers of CD8 T cells in the vaginal tract was evident for both NET-EN and DMPA treatment groups compared to untreated control group, but this only reached statistical significance for the DMPA treatment group (Figure 2E).
3.3 NET-EN and DMPA have differential effects on the frequencies and numbers of IFN-γ and TNF-α producing CD4 and CD8 T cells in the vaginal tractWe next assessed IFN-γ and TNF-α expression by CD4+ and CD8+ T cells with NET-EN or DMPA treatments. We found a significant selective enhancement in the frequencies of IFN-γ+ CD4 T cells with NET-EN (Figure 3A) and TNF-α+CD4 T cells with DMPA treatments in comparison to untreated controls (Figure 3B). In terms of absolute cell numbers, there was a significant decrease in IFN-γ+CD4 T cells with DMPA treatment compared to untreated controls. NET-EN treatment displayed a trend toward reduce numbers of IFN-γ+CD4 T cells, that did not reach significance (Figure 3A). Significant increase in frequency of IFN-γ+CD8 T cells was seen with NET-EN treatment (Figure 3C) and the frequency of TNF-α+CD8 T cells in DMPA treated mice (Figure 3D). Collectively, DMPA treatment significantly decreases the number of T cells in the vagina while selectively enhancing the frequency of TNF-α producing CD4 and CD8 T cells. In contrast, NET-EN treatment significantly enhances frequency of IFN-γ producing CD4 and CD8 T cells. Table 2 summarizes the changes in frequency and total number or CD4 and CD8 T cell subsets isolated from vaginal tissue in the different treatment groups.
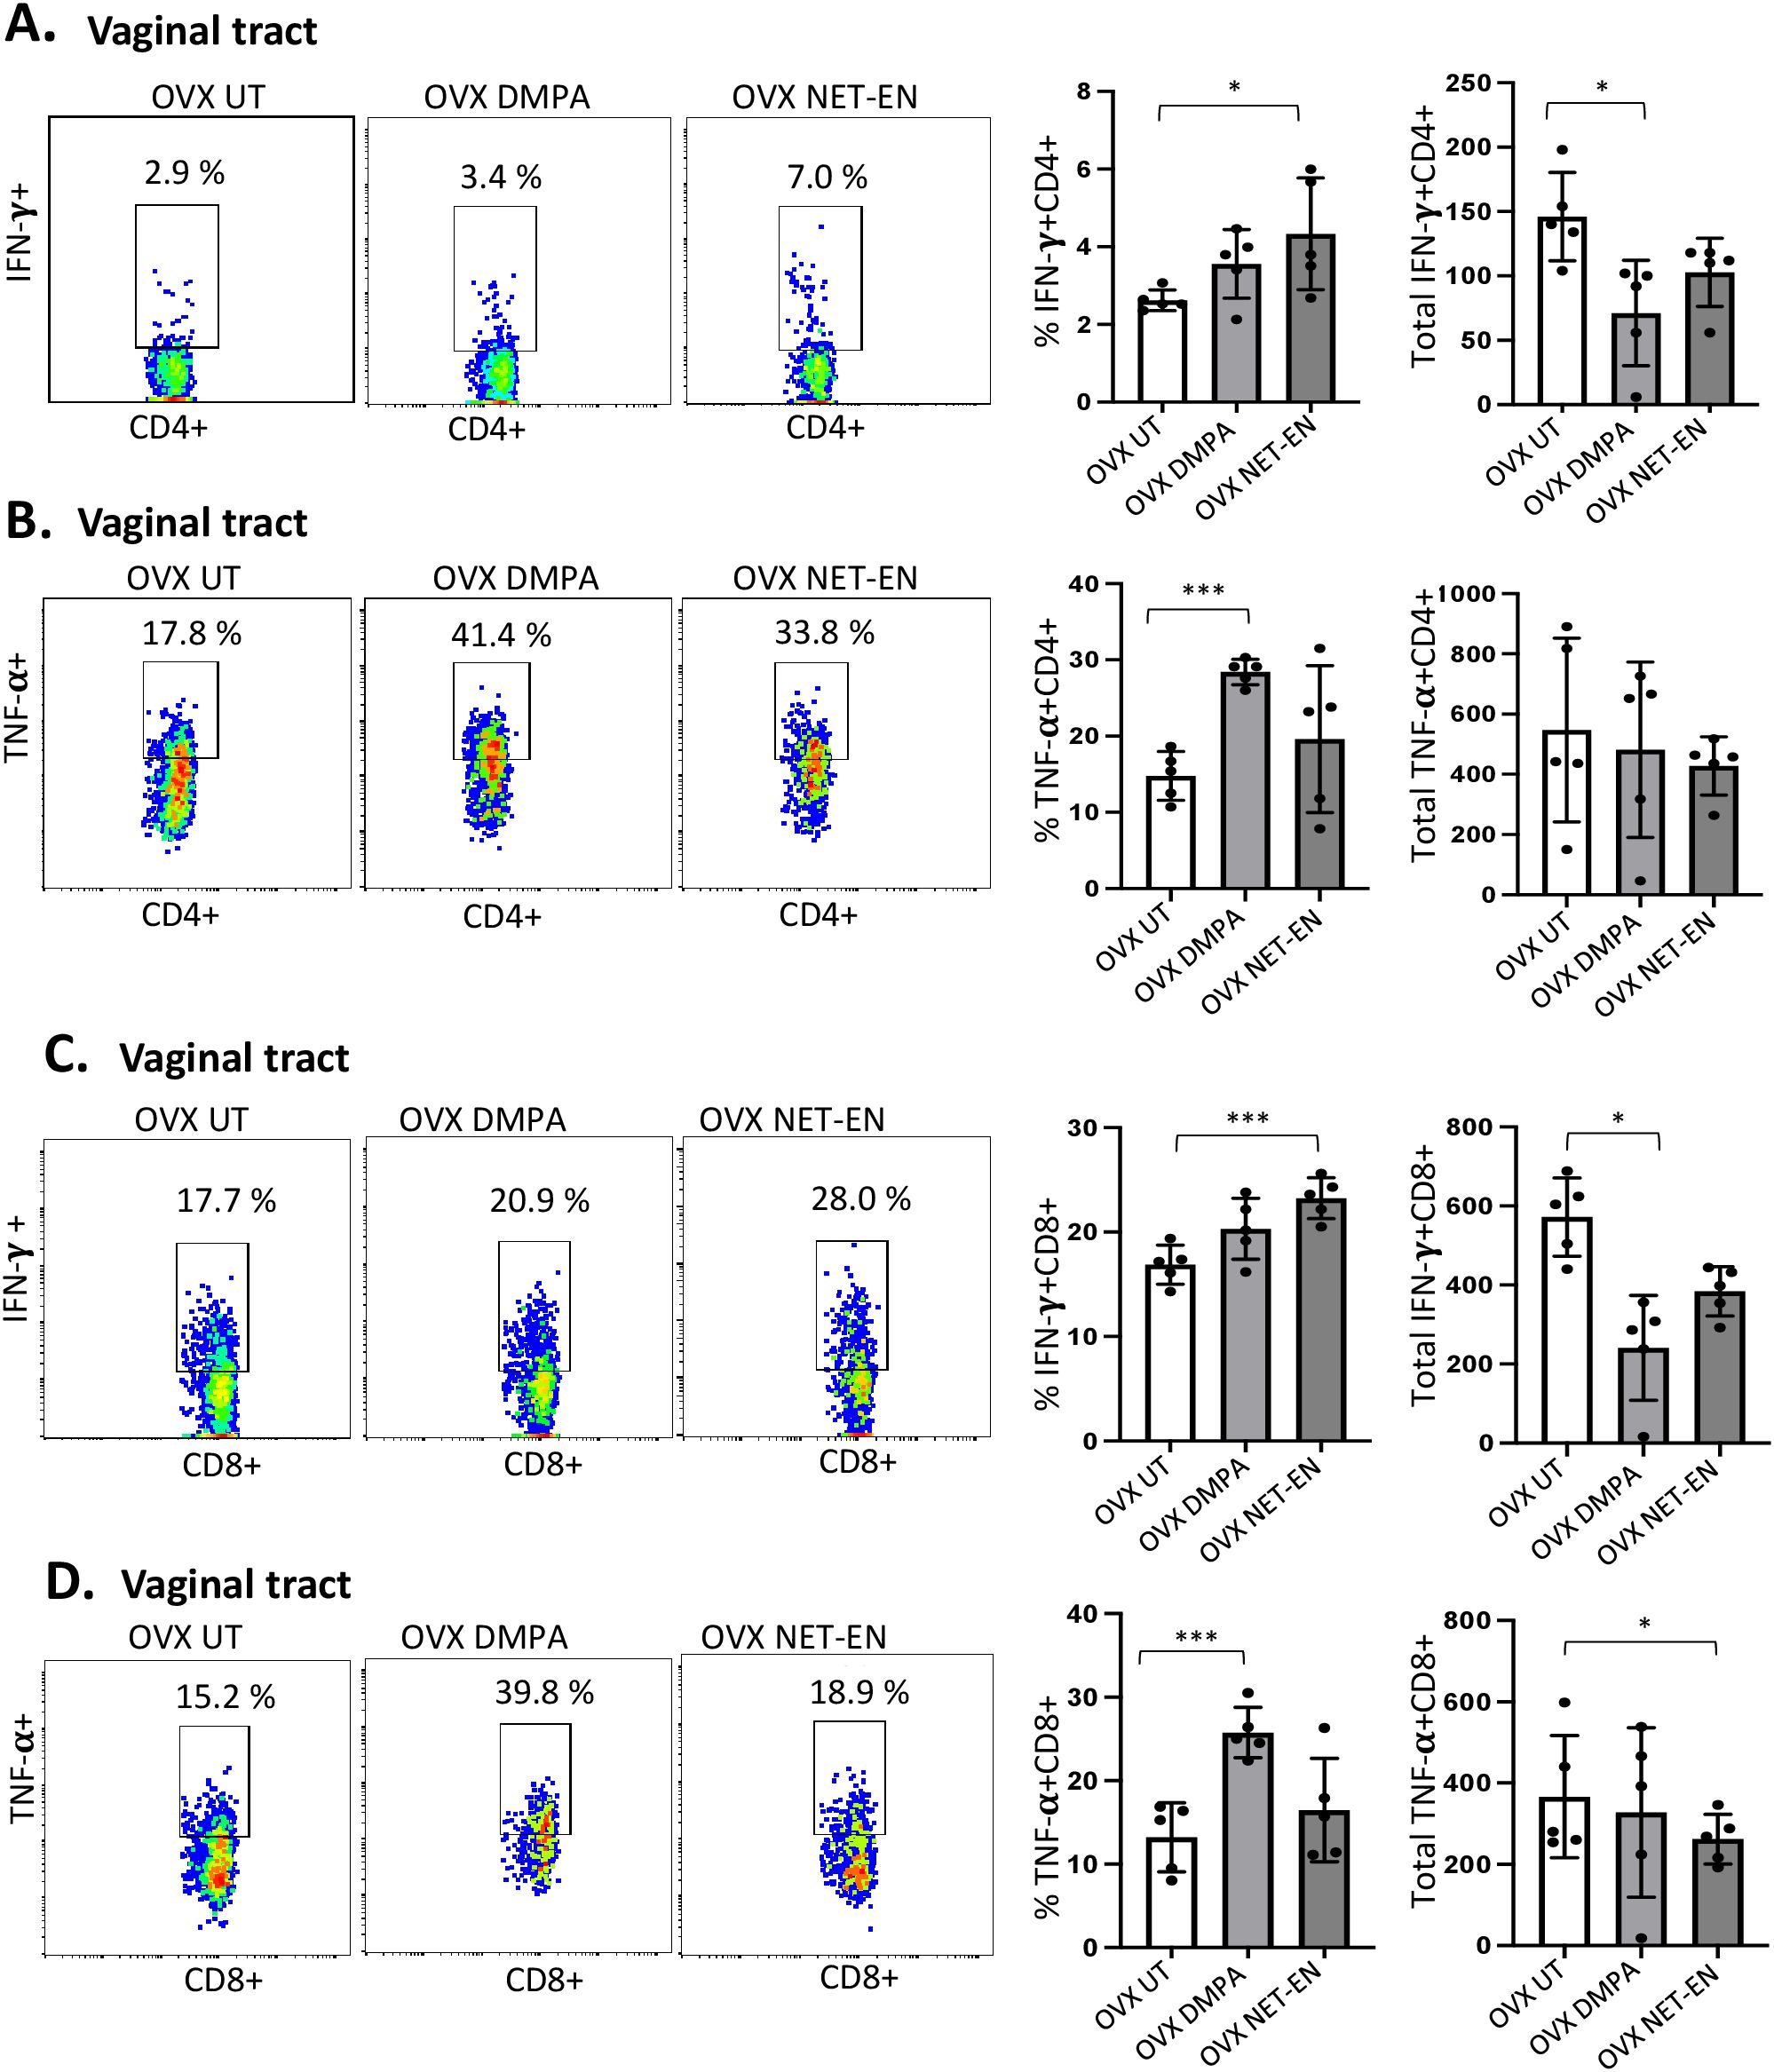
Figure 3. Analysis of vaginal tract CD4 and CD8 T cells for IFN-γ and TNF-α expression in NET-EN-treated, DMPA-treated and untreated OVX mice. OVX mice were treated with NET-EN (2.5 mg) or DMPA (2 mg) or left untreated (UT) for 3 weeks (n=5 per group). Mice were then euthanized, vaginal tracts tissues were collected, and single cell suspensions were isolated. The cells were then stimulated with the T cell stimulation cocktail up to 16 h, followed by fluorescence antibody staining for extracellular markers such as CD3, CD4 and CD8 and intracellular staining for cytokines IFN-γ and TNF-α prior to analysis by flow cytometry. A primary gating strategy (Supplementary Figure S3) allowed analysis of viable, single CD3 positive lymphocytes, then gated for CD4+ and CD8+ cells. (A) Representative dot plots showing the gated CD4+ T cells and their IFN-γ fluorescence. Inset rectangle identifies IFN-γ+ CD4 T cells with % positive shown. Bar graphs on the right display the mean ± SEM (n = 5) for the percentage of IFN-γ+ CD4 T cells (left panel) and total number of CD4+ IFN-γ+ T cells (right panel). (B) Representative dot plots showing the gated CD4+ T cells and their TNF-α fluorescence. Inset rectangle identifies TNF-α+ CD4 T cells with % positive shown. Bar graphs display the mean ± SEM (n = 5) for the percentage of TNF-α+ CD4 T cells (left panel) and total number of TNF-α+ CD4 T cells (right panel). (C) Representative dot plots showing the gated CD8+ T cells expressing IFN-γ. Inset rectangle identifies CD8+IFN-γ+ cells with % positive shown. Bar graphs show the mean ± SEM (n = 5) for the percentage IFN-γ+ CD8 T cells (left panel) and total number of IFN-γ+ CD8 T cells (right panel). (D) Representative dot plots display the gated CD8+ T cells expressing TNF-α. Inset rectangle identifies TNF-α+ CD8 T cells with % positive shown. Bar graphs show the mean ± SEM (n = 5) for the percentage TNF-α+ CD8 T cells (left panel) and total number of TNF-α+ CD8 T cells (right panel). All data are drawn from 3 independent experiments. Data were analyzed utilizing the one-way ANOVA with Tukey’s multiple comparison test. *, P <0.05; ***, P <0.001.
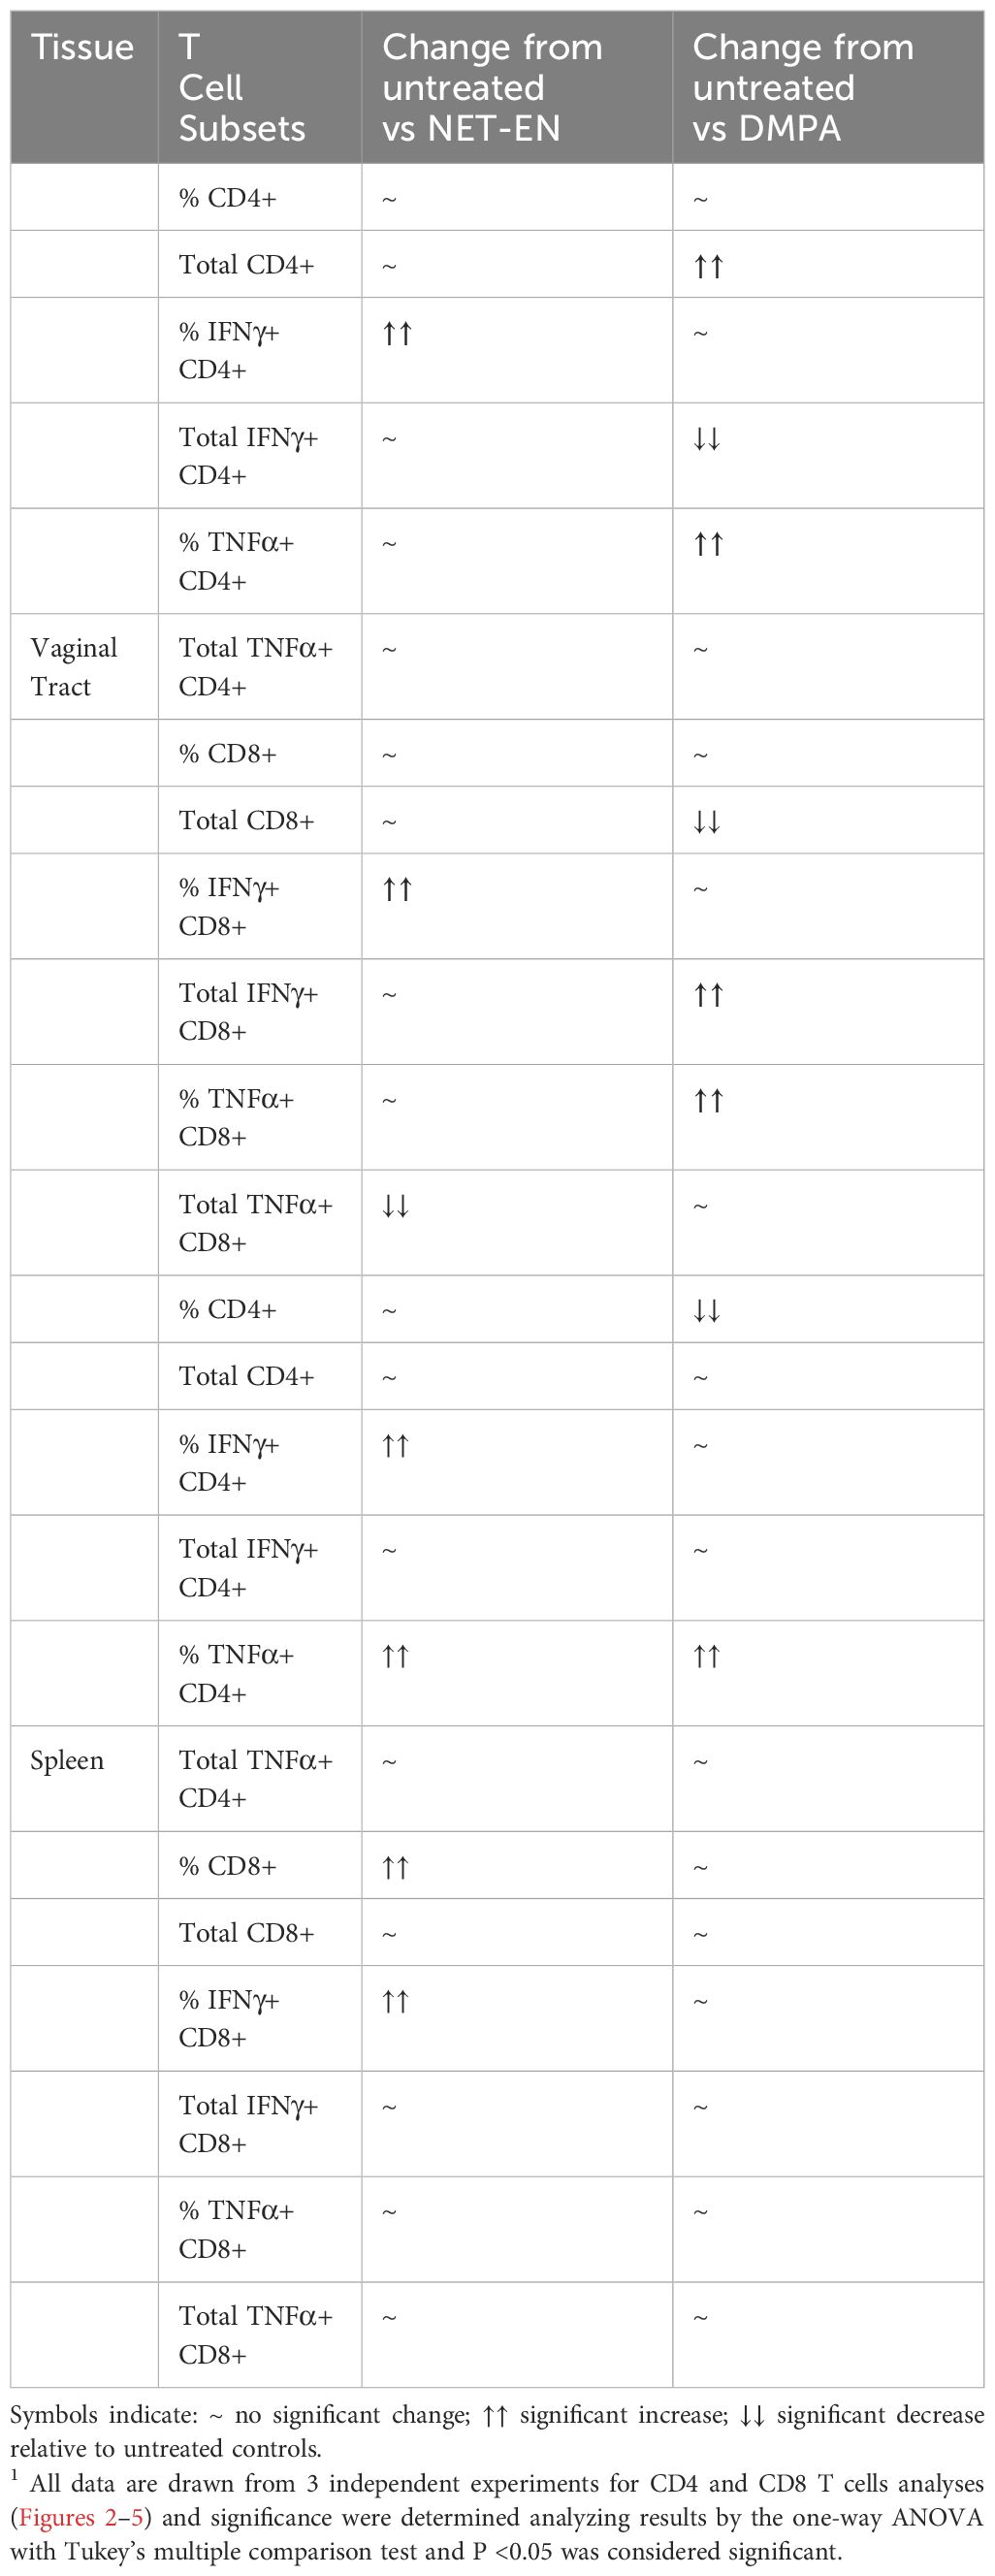
Table 2. A summary1 of results for immune cells response to no hormone treatment (UT), NET-EN vs DMPA treatments (n=5 mice for each treatment groups).
3.4 NET-EN and DMPA treatments show distinct effects on the percentages and the numbers of CD4 and CD8 T cells in the spleenAfter demonstrating the distinct differences in CD4 and CD8 T cells populations and their functions with NET-EN and DMPA treatments in the local vaginal tract tissue, we compared that response to systemic lymphocyte populations using isolated spleen cells (experimental design depicted in Supplementary Figure S2). Spleen cells were first gated on lymphocytes populations, followed by single cells and finally gated on live lymphocytes expressing CD3 (gating strategy shown in Supplementary Figure S4). Next, CD3+ T cells were further gated to identify the percentages and absolute numbers of CD4+ and CD8+T cells present in the spleen (Figure 4A). It is noteworthy to mention that we found a comparatively higher percentage of double positive CD4+ and CD8+ T cells in the spleen than the vaginal tract which is likely because the spleen has the highest numbers of multiple subsets of immune cells and respond to hormonal treatments with a more diverse magnitude than the vaginal tract cells.
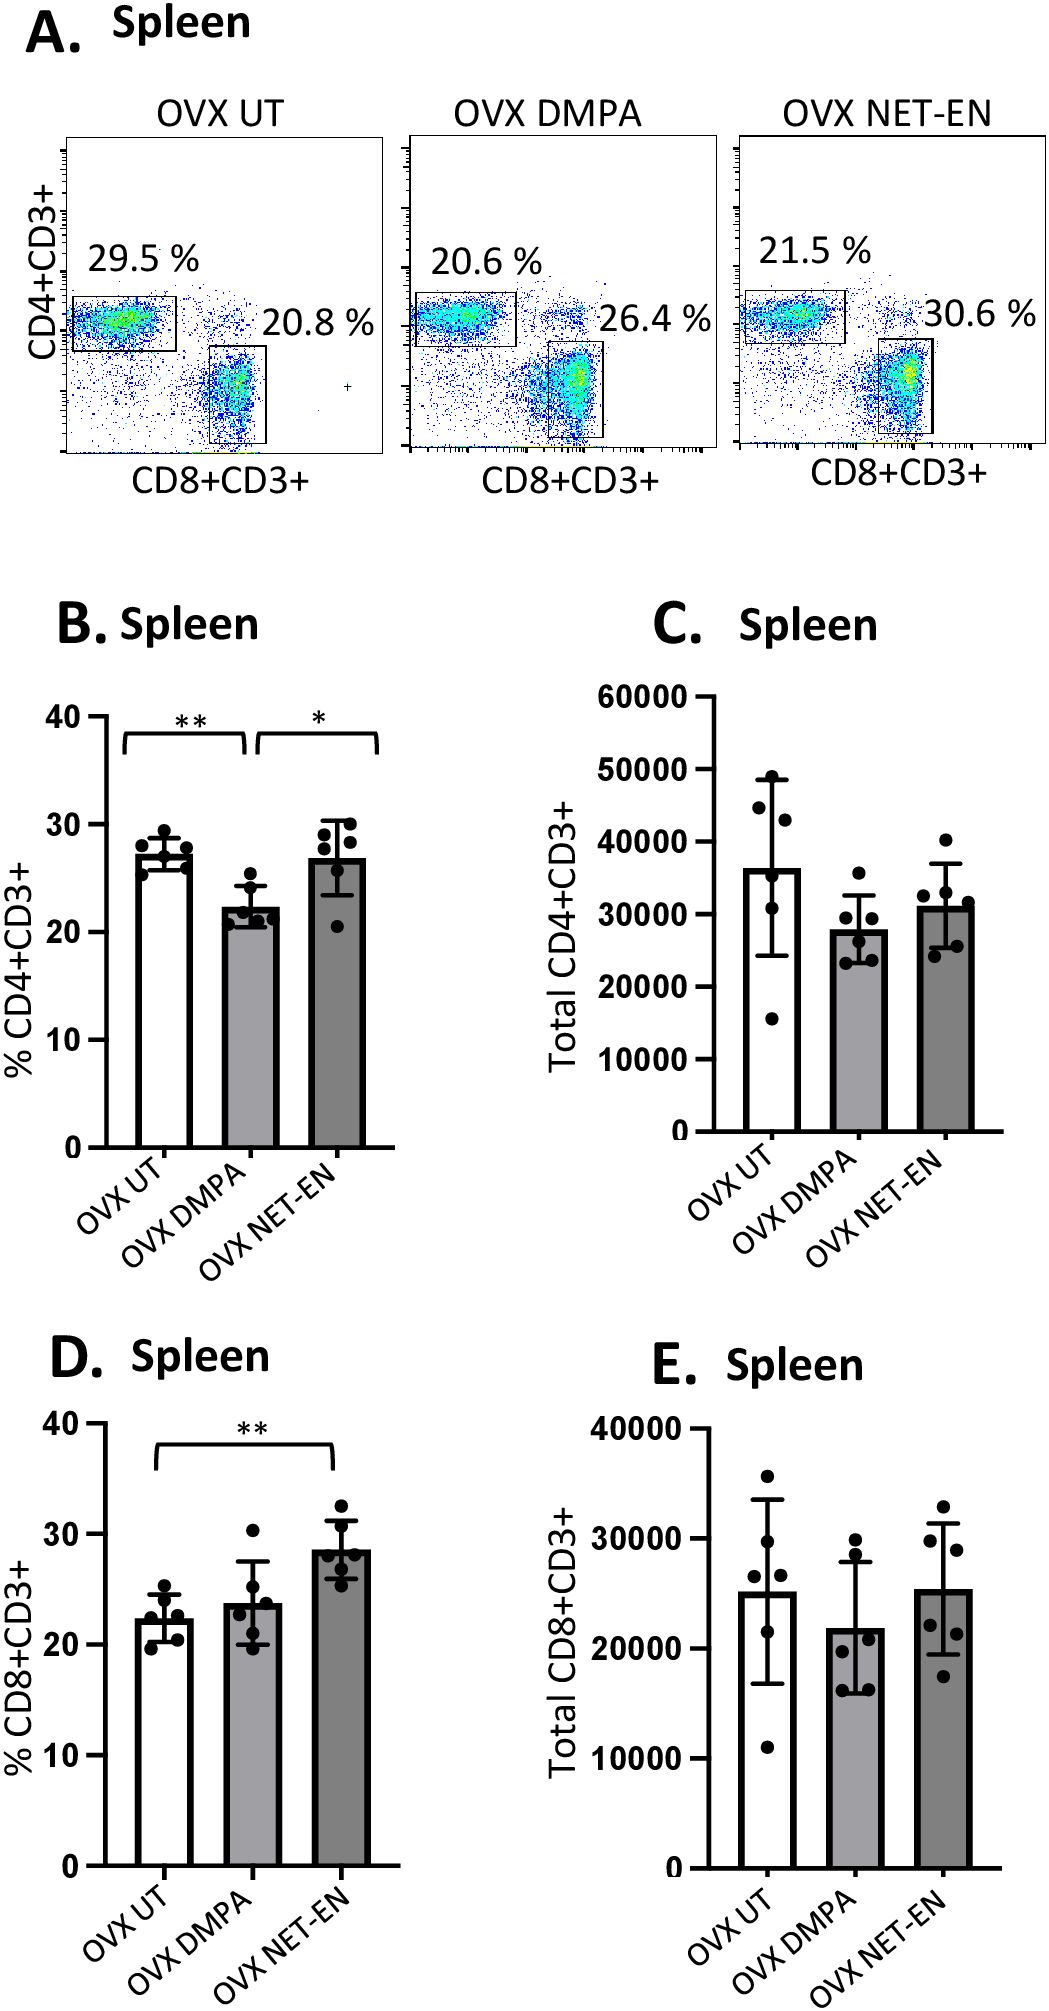
Figure 4. Analysis of splenic CD4 and CD8 T cells populations in NET-EN-treated, DMPA-treated and untreated OVX mice. OVX mice were treated with NET-EN (2.5 mg), DMPA (2 mg) or left untreated (UT) for 3 weeks. Mice were then sacrificed, their spleens collected and single cell suspensions were isolated. Cells were then stimulated with the T cell stimulation cocktail up to 16 h, followed by fluorescence antibody staining for extracellular markers, such as CD3, CD4 and CD8 and analyzed by flow cytometry. A primary gating strategy (Supplementary Figure S4) allowed analysis of viable, single CD3 positive lymphocytes. (A) Representative dot plots showing identified CD4+ and CD8+ T cells. (B) Bar graph shows the mean ± SEM (n = 5) for the percentage of viable CD4+ T cells, and (C) the number of viable CD4+T cells in spleen isolated from NET-EN, DMPA or untreated mice. (D) Bar graph showing the mean ± SEM (n = 5) for the percentage of CD8+ T cells, and (E) the total number of CD8+ T cells in the spleen. All data are drawn from 3 independent experiments. Data were analyzed utilizing the one-way ANOVA with Tukey’s multiple comparison test. *, P <0.05; **, P <0.01.
The effects of DMPA and NET-EN on decreasing the overall numbers of T cells seen in the vaginal tract were not seen systemically with splenic lymphocytes. However, the frequency of splenic CD4 T cells was significantly lower with DMPA treatment in comparison to untreated and NET-EN treatments (Figure 4B). In contrast, CD8 T cell frequency was higher with NET-EN (Figure 4D). Unlike vaginal tissue, the numbers of CD4 (Figure 4C) and CD8 T cells (Figure 4E) were not different in splenic lymphocytes for DMPA or NET-EN treated mice.
3.5 NET-EN and DMPA treatments show distinct effects on the percentages and the numbers of IFN-γ and TNF-α expressing CD4 and CD8 T cells in the spleenMost mouse model data available so far that demonstrates the effects of sex hormones and hormonal contraceptives mainly focuses on local immune responses in the draining lymph nodes or vaginal tissue. Precise information about the influence of these hormones on systemic immune modulation involving splenic immune cells remain to be studied. We therefore investigated the effects of NET-EN and DMPA on the functional phenotypes of splenic T cells, and compared that with local immune responses the effects on those phenotypes in the VT (experimental design depicted in Supplementary Figure S2). We found a greater frequency of IFN-γ producing CD4 cells with NET-EN treatment compared to untreated and DMPA-treated mice (Figure 5A). In addition, treatment with either contraceptive resulted in increased frequency of TNF-α+CD4+ T cells with more significant effects using DMPA in comparison to untreated controls (Figure 5B). We observed no statistically significant difference in total numbers of splenic IFN-γ or TNF-α expressing CD4+ T cells with either contraceptive. However, the number of IFN-γ+ CD4 T cells showed a trend of increase with NET-EN (Figure 5A) and a decrease of TNF-α+CD4 T cells with NET-EN (Figure 5B). Importantly, significantly higher frequency of IFN-γ+ CD8 T cells was observed with NET-EN treatment in comparison to untreated controls (Figure 5C). However, no difference in frequencies of TNF-α+CD8 T cells were observed for all experimental groups (Figure 5D). Table 2 summarizes the differences in frequency and total number or CD4 and CD8 T cell subsets isolated from spleens in the different treatment groups.
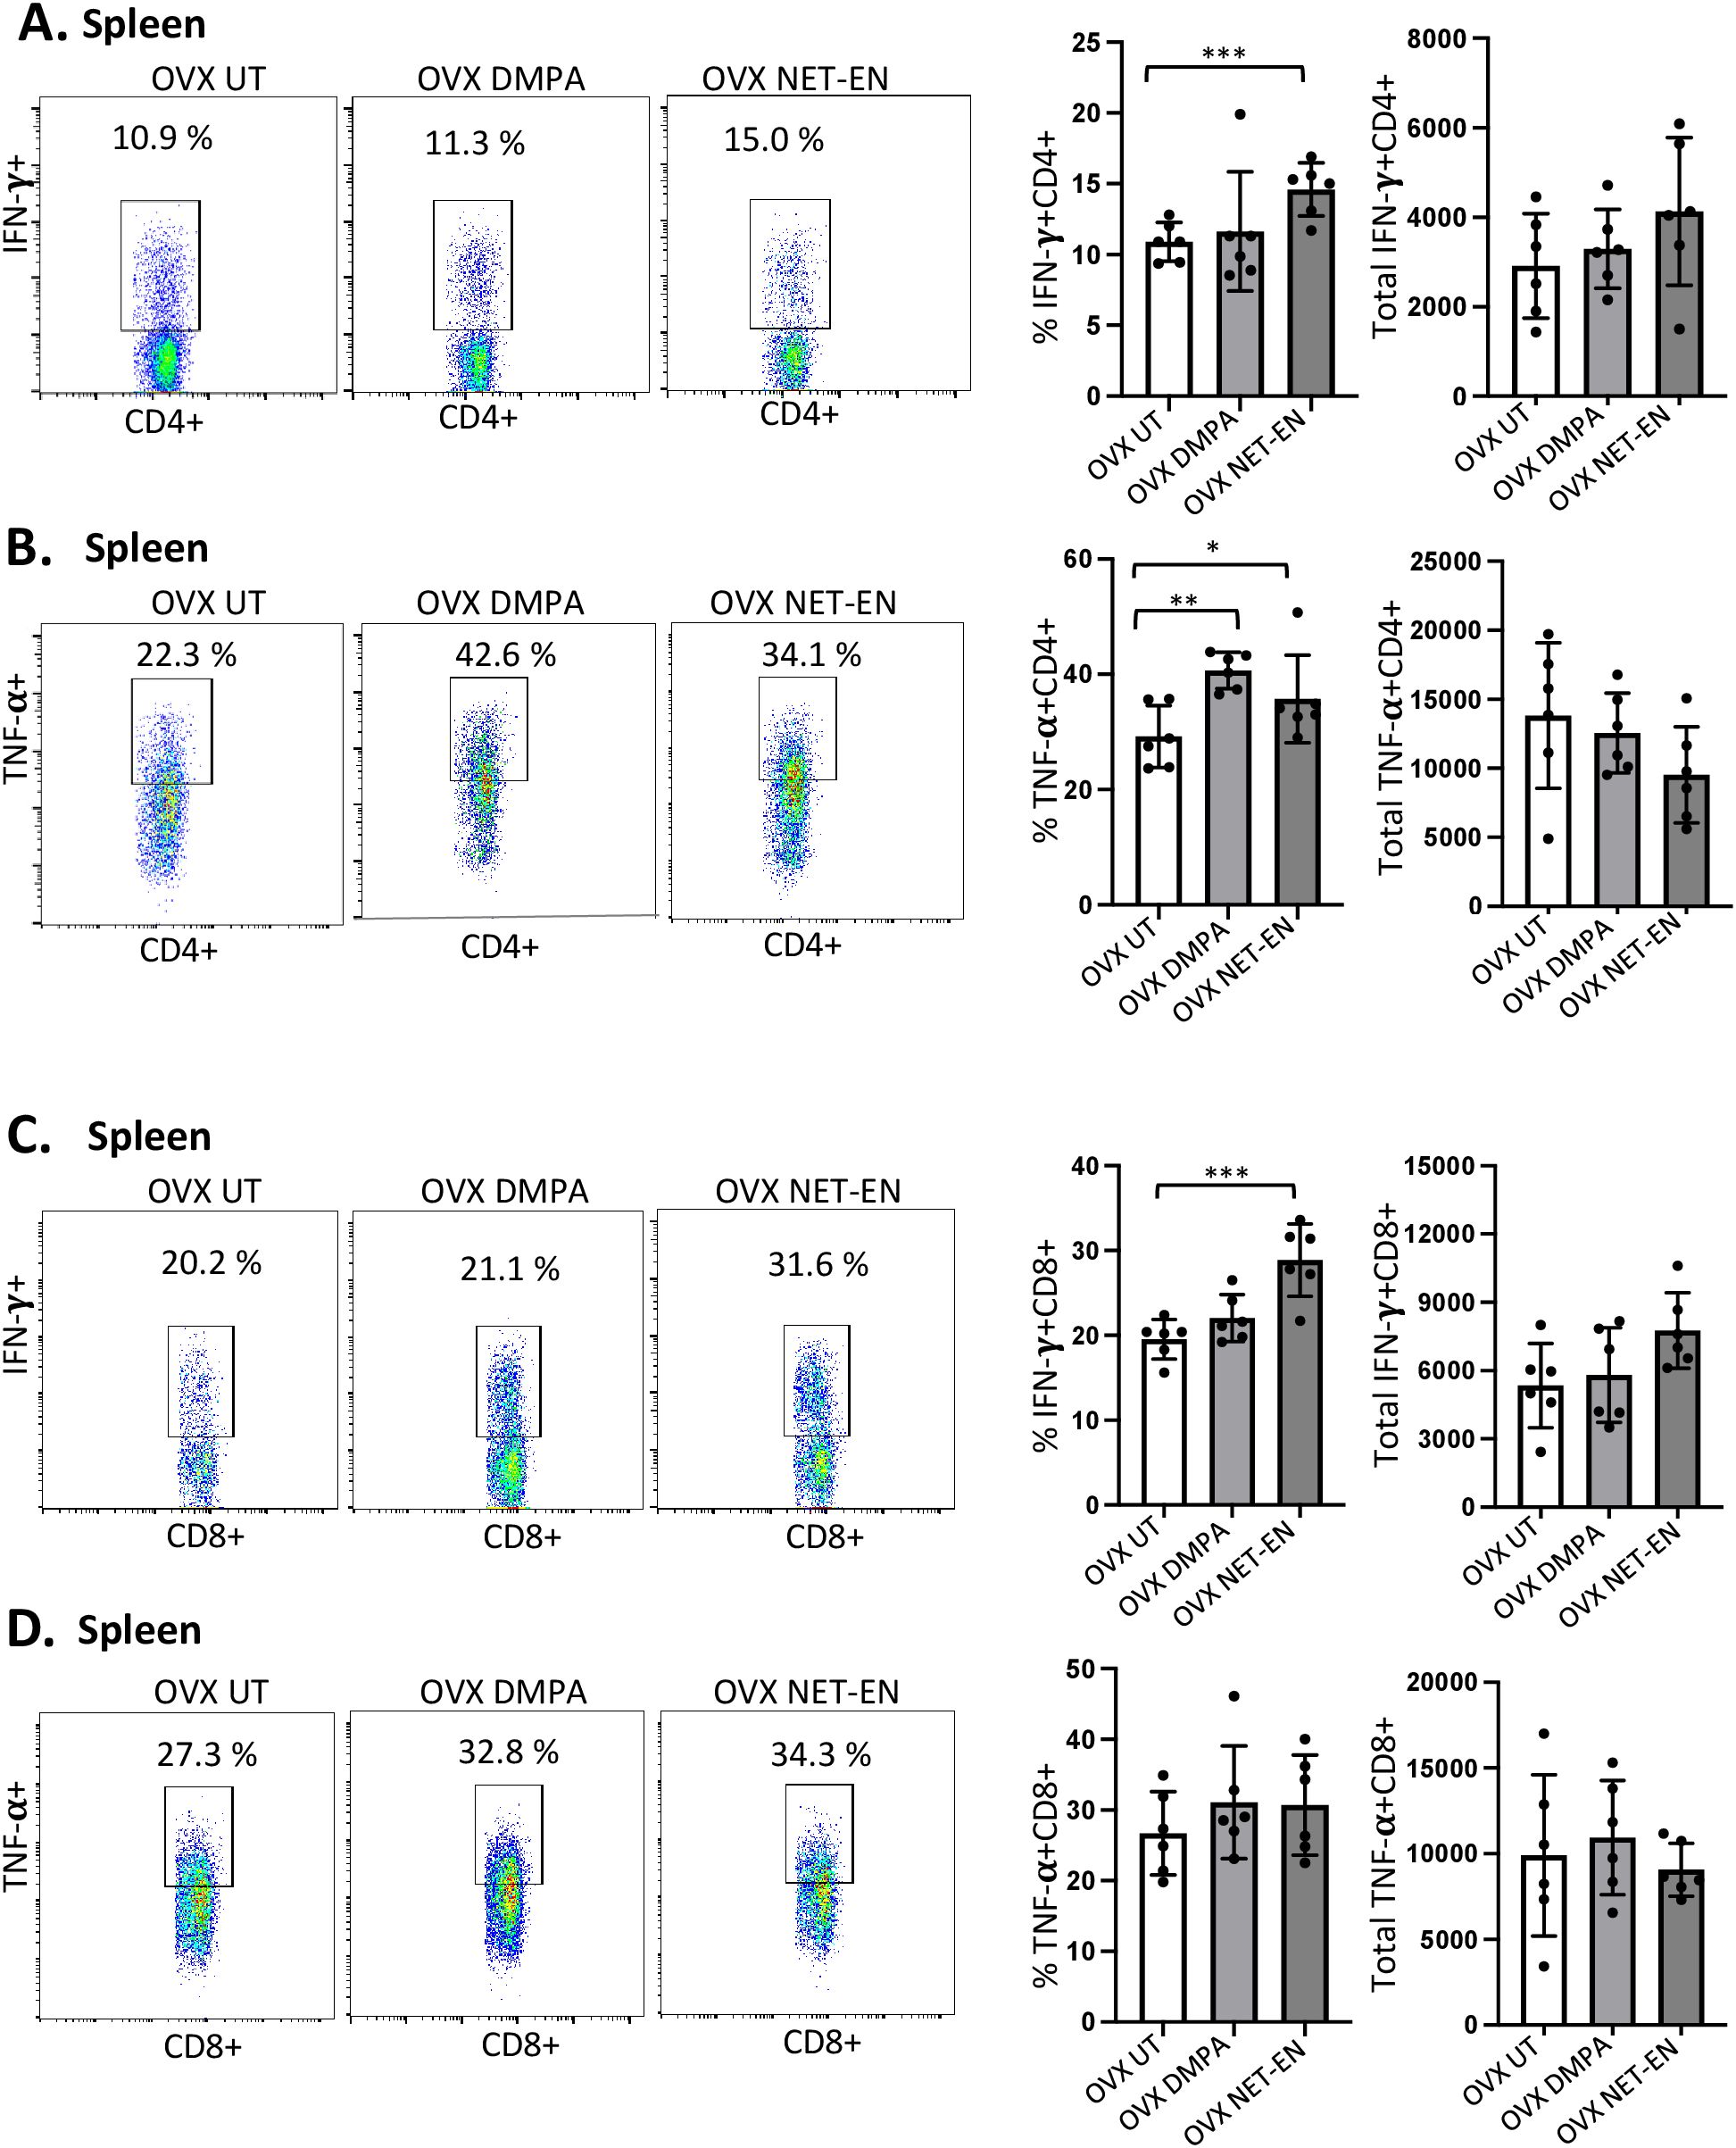
Figure 5. Analysis of splenic CD4 and CD8 T cells for IFN-γ and TNF-α expressions in NET-EN-treated, DMPA-treated and untreated OVX mice. OVX mice were treated with NET-EN (2.5 mg), DMPA (2 mg) or left untreated (UT) for 3 weeks. Mice were then euthanized, their spleens collected and single cell suspensions were isolated. Cells were then stimulated with the T cell stimulation cocktail up to 16 h, followed by fluorescence antibody staining of extracellular markers (CD3, CD4 and CD8) and then intracellular cytokine staining for IFN-γ and TNF-α before analyzed by flow cytometry. A primary gating strategy (Supplementary Figure S4) allowed analysis of viable, single CD3 positive lymphocytes and further gated for CD4+ and CD8+ T cell subpopulations. (A) Representative dot plots showing the gated CD4+ T cells and their IFN-γ fluorescence. Inset rectangle identifies IFN-γ+ CD4 T cells with % positive shown. Bar graphs on the right display the mean ± SEM (n = 5) for the percentage of IFN-γ+ CD4 T cells (left panel) and total number of CD4+ IFN-γ+ T cells (right panel). (B) Representative dot plots showing the gated CD4+ T cells and their TNF-α fluorescence. Inset rectangle identifies TNF-α+ CD4 T cells with % positive shown. Bar graphs display the mean ± SEM (n = 5) for the percentage of TNF-α+ CD4 T cells (left panel) and total number of TNF-α+ CD4 T cells (right panel). (C) Representative dot plots showing the gated CD8+ T cells expressing IFN-γ. Inset rectangle identifies CD8+IFN-γ+ cells with % positive shown. Bar graphs show the mean ± SEM (n = 5) for the percentage IFN-γ+ CD8 T cells (left panel) and total number of IFN-γ+ CD8 T cells (right panel). (D) Representative dot plots display the gated CD8+ T cells expressing TNF-α. Inset rectangle identifies TNF-α+ CD8 T cells with % positive shown. Bar graphs show the mean ± SEM (n = 5) for the percentage TNF-α+ CD8 T cells (left panel) and total number of TNF-α+ CD8 T cells (right panel). All data are drawn from 3 independent experiments. Data were analyzed utilizing the one-way ANOVA with Tukey’s multiple comparison test. *, P <0.05; **, P <0.01; ***, P <0.001.
3.6 DMPA, but not NET-EN treatment, diminishes mucin production in the vaginal tractIn the FRT, the epithelium of the cervix and its glands secrete mucins, which function as a defense against invading pathogen in the uterus and vagina. In this study, we first examined whether NET-EN and DMPA would differentially modulate mucin production in the vaginal tract. OVX mice were treated with NET-EN or DMPA and vaginal washes were collected at 1- and 3-weeks post-treatment (experimental design showed in Supplementary Figure S2). Mucin concentration was measured in vaginal washes by ELISA. We detected a significantly diminished level of mucin in the vaginal tract in DMPA treated mice compared with NET-EN treated and untreated OVX mice (Figure 6A). In another group of NET-EN and DMPA treated mice, vaginal tissues were harvested at 1 and 3 weeks of treatments, tissues were fixed and subjected to either PAS staining and immunohistochemistry for cell-associated Muc1 protein. The specificity of Muc1 monoclonal antibody staining was verified by staining vaginal tract tissues collected from normal mice in estrus and diestrus as controls (Figure 6B). No Muc1 staining was seen in vaginal sections taken from estrus stage and MUC-1 staining was visible in diestrus. Interestingly, NET-EN treated vaginal tissue displayed robust expression of carbohydrates as detected by PAS staining and cell-associated Muc1 protein as detected by immunohistochemistry staining (Figure 6C). By contrast, DMPA treatment showed minimal levels of cell-associated Muc1 protein and PAS-stained carbohydrates compared to NET-EN treatment (Figure 6C). Of note, OVX mice overall show thinning of vaginal epithelial layer for all treatment groups, however, NET-EN treatment shows increased epithelial layer thickness compared to other groups. Quantification and analyses of both PAS and Muc1 staining images showed significantly higher PAS and Muc1 signal intensities with NET-EN treatment as compared to DMPA and untreated mice. DMPA treatment, on the other hand, showed significant reduction of both PAS and Muc1 signal intensities compared to NET-EN and untreated mice (Figure 6D). Thus, these results show strong evidence that DMPA profoundly reduces mucin, whereas NET-EN treatment maintains or enhances mucin in the vaginal tract.
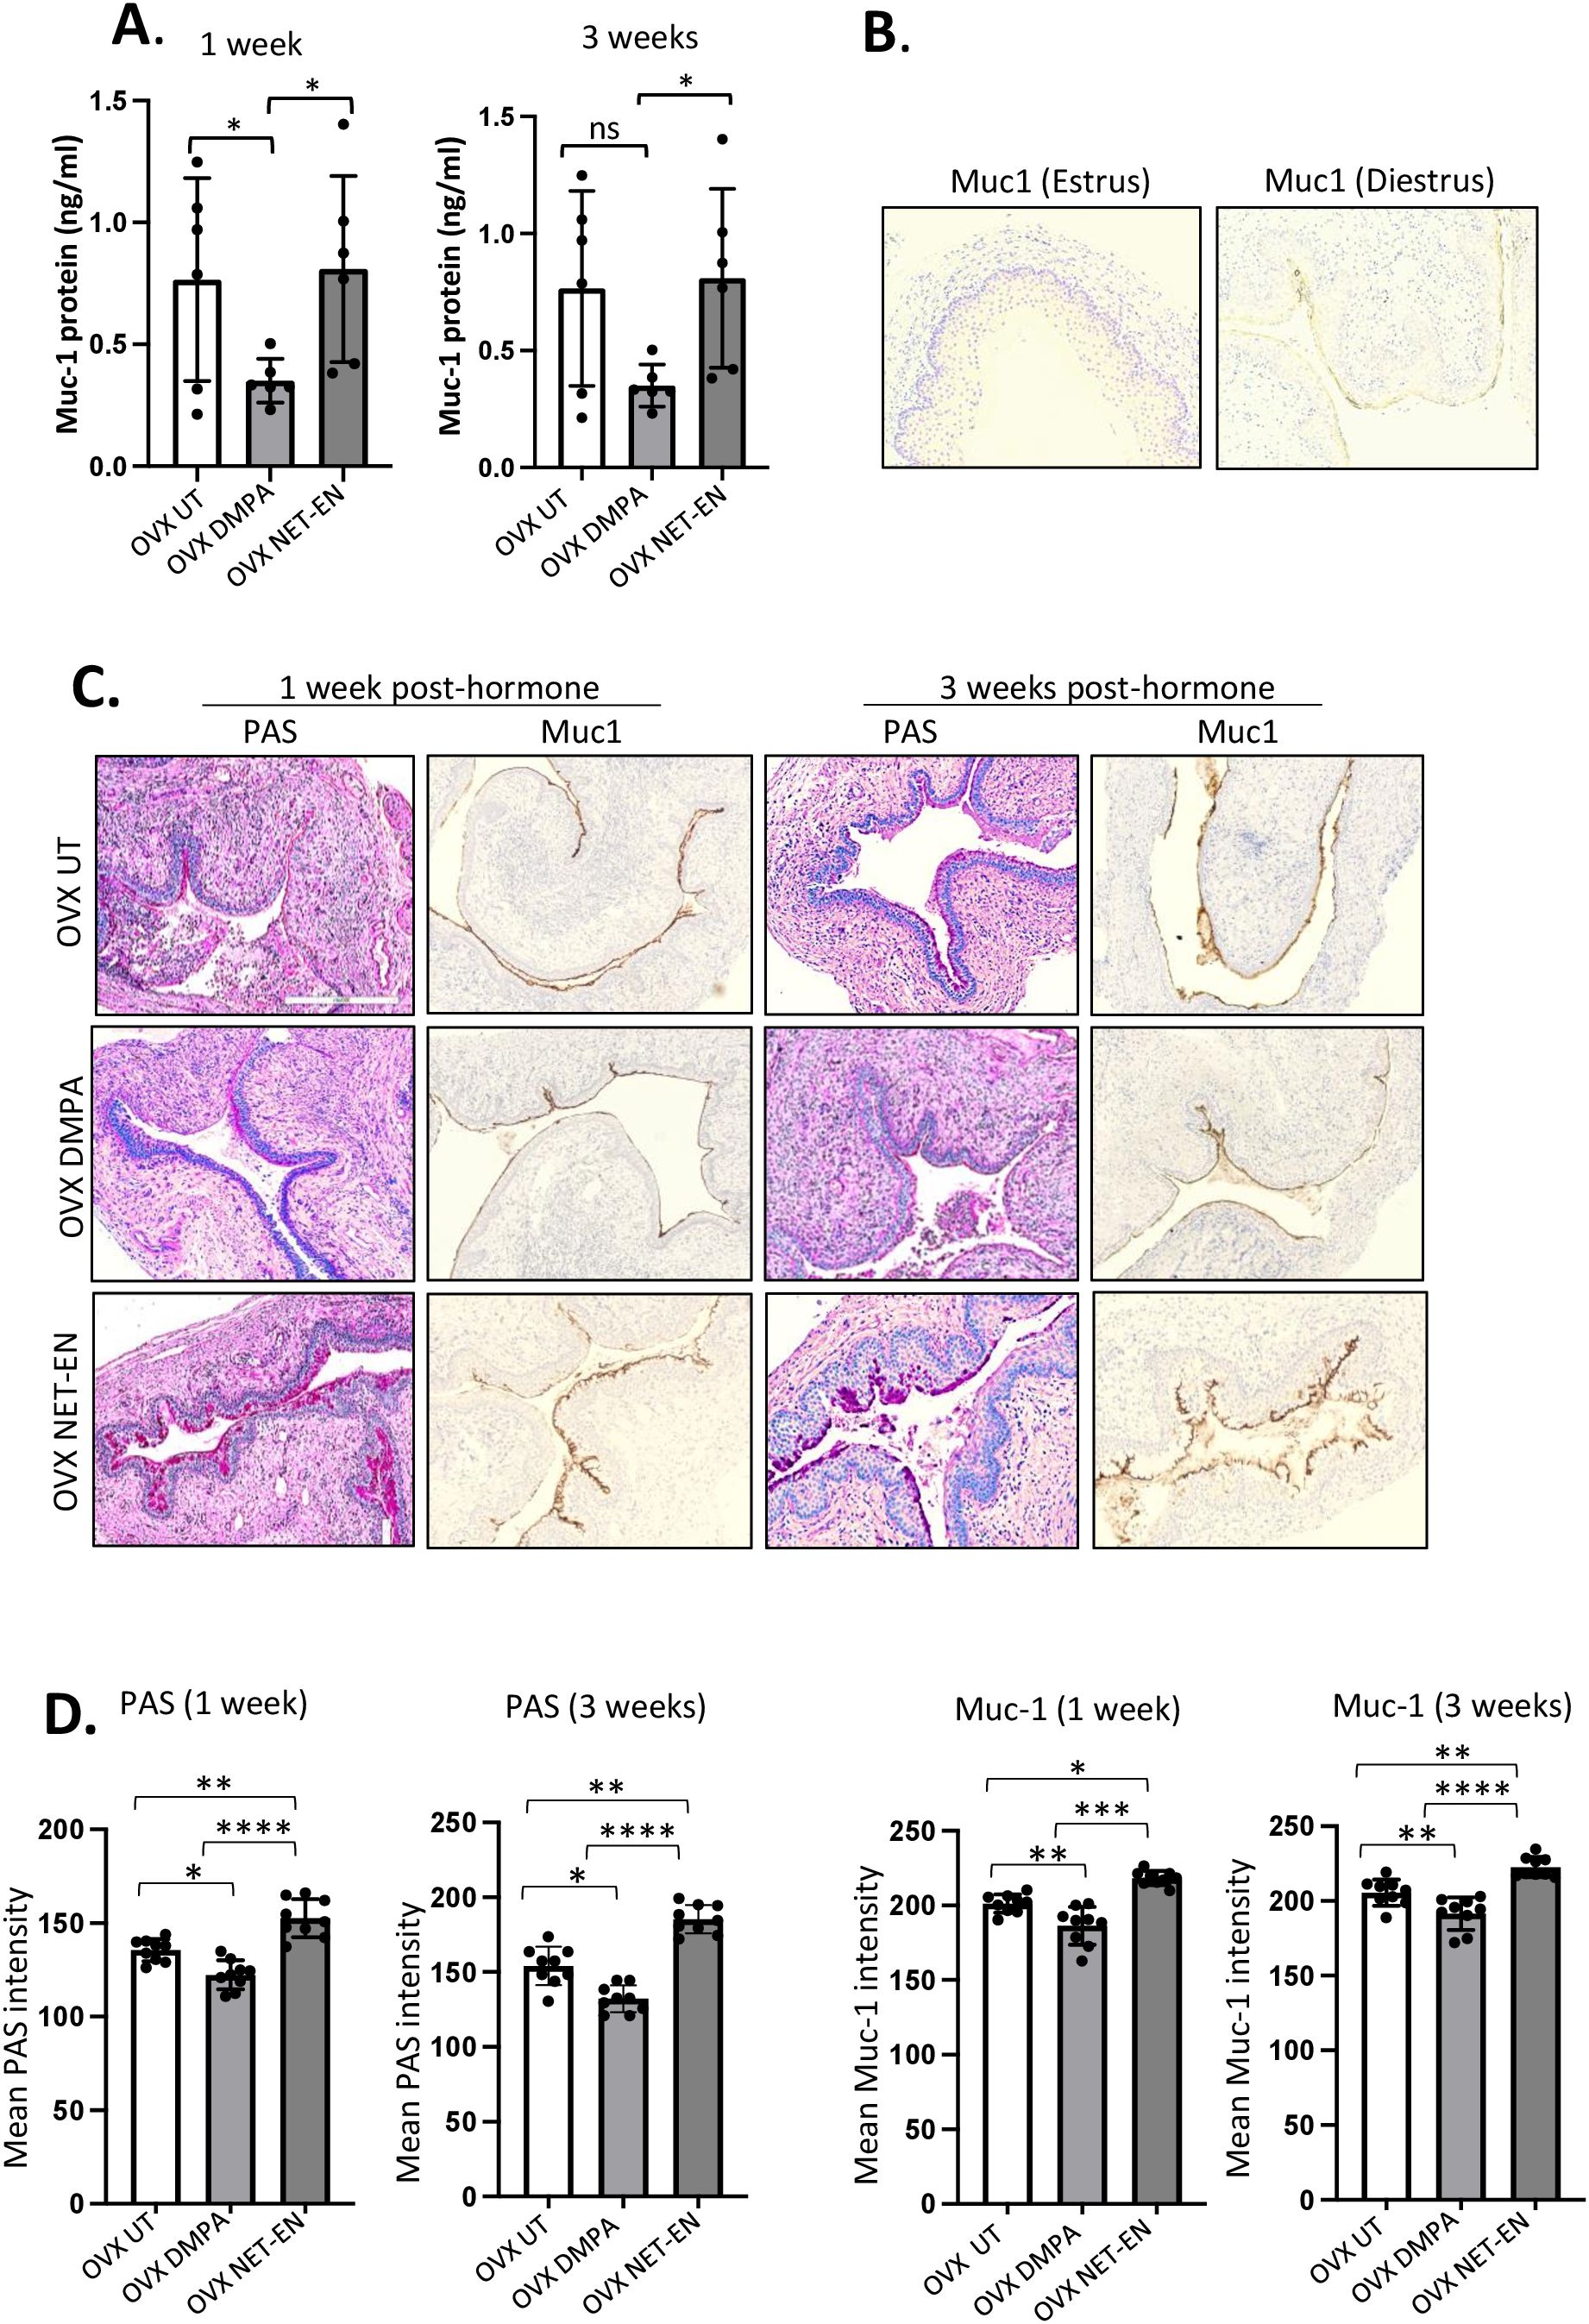
Figure 6. Analysis of mucin production in vaginal tract of OVX mice treated with NET-EN, DMPA or left untreated. OVX mice were treated with NET-EN or DMPA or left untreated (UT) and vaginal washes collected after 1 and 3 weeks of treatment. Some of the treated mice were euthanized and vaginal tissues collected and processed for histological staining with PAS and immunohistochemical staining for Muc1 to detect cell associated Mucin. (A) Vaginal washes taken at 1 and 3 weeks were assessed for secreted Muc1 protein levels by commercial mouse Muc1 ELISA kit. Bars indicate mean ± SEM for n = 6 samples. Statistical significance: *, P <0.05. (B) Vaginal tissues showing no Muc1 immunohistochemistry staining in vaginal sections taken from estrus stage serves as negative control and Muc1 staining was visible (dark brown) in diestrus used as a positive control. (C) Vaginal tissues showing different levels of cell associated mucins (multiple mucin types) as detected by intensity of PAS staining (dark pink) and Muc1 immunohistochemistry staining (dark brown) after 1 and 3 weeks of treatment. (D) PAS and Muc1 staining intensities for images of vaginal tissues for different treatments showed in panel (C) were quantified using Fiji ImageJ software as depicted in bar graphs. Bars indicate mean ± SEM for n=9 samples (3 images per mouse vaginal tissue, n=3 mice per treatment). All data are drawn from 2 independent experiments. Data were analyzed utilizing the one-way ANOVA with Tukey’s multiple comparison test. *, P <0.05; **, P <0.01; ***, P <0.001; ****, P<0.0001.
3.7 Reduced mucin levels in the vaginal tract with DMPA treatment is associated with increased levels of HSV-2 in contrast to NET-EN treated and untreated mice following HSV-2 infectionNext, we investigated whether the relationship between Muc1 production and HSV-2 levels under the influence of NET-EN and DMPA in the vaginal tract. OVX mice were treated with NET-EN or DMPA and then challenged intravaginally with WT HSV-2 (experimental design shown in Figure 1A). All mice were euthanized at day 5 post-challenge, before any mouse from any treated group reached stage 5 in pathology, and vaginal tissue were collected and processed for PAS staining and imunohistochemistry staining for HSV-2 or Muc1 protein (Figure 7A). We observed pronounced expressions of carbohydrates as detected by PAS staining, as well as significantly increased presence of Muc1 protein in the vaginal tissue only with NET-EN treated mice challenged intravaginally with wild type HSV-2 (Figure 7A). Importantly, DMPA treated mice when infected with HSV-2 showed significantly diminished mucin levels in the vaginal tract as detected with PAS and Muc1 protein staining. Quantification of PAS and Muc1 staining images displayed significantly increased levels of both PAS and Muc1 signal intensities in the vaginal tissues of NET-EN treated mice after HSV-2 infection compared to DMPA and untreated mice (Figure 7B). In contrast, DMPA treated mice following HSV-2 infection exhibited significantly reduced levels of both PAS and Muc1 signals when compared with NET-EN and untreated mice. Associated with enhanced amounts of cell-associated Muc1 protein, a diminished level of HSV-2 virus particles were detected for NET-EN treatment. Conversely, DMPA and untreated vaginal tissue displayed markedly higher levels of HSV-2 viral particles. Analysis of HSV-2 immunohistochemistry images showed significantly diminished levels of signal intensities in the vaginal tissues of NET-EN treated mice compared to DMPA and untreated mice infected intravaginally with HSV-2, while comparable levels of significantly enhanced HSV-2 signals were observed in DMPA and untreated vaginal tissues (Figure 7B, right panel). Of note, we found no significant differences in signal intensities for PAS, or Muc1 between any of the treatment groups when we compared mice that were challenged intravaginally with wild type HSV-2 versus those were not infected within the same hormone treatment (Supplementary Figure S5). This indicates a potential role for mucins in inhibiting or delaying infection of the vaginal tract by HSV-2. Collectively, this study provides novel evidence that DMPA treatment decreases Muc1 protein production, while NET-EN may enhance cell-associated Muc1 protein. It follows that the increase in Muc1 expression by NET-EN may result in decreased HSV-2 infection in the vaginal tract of OVX mice.
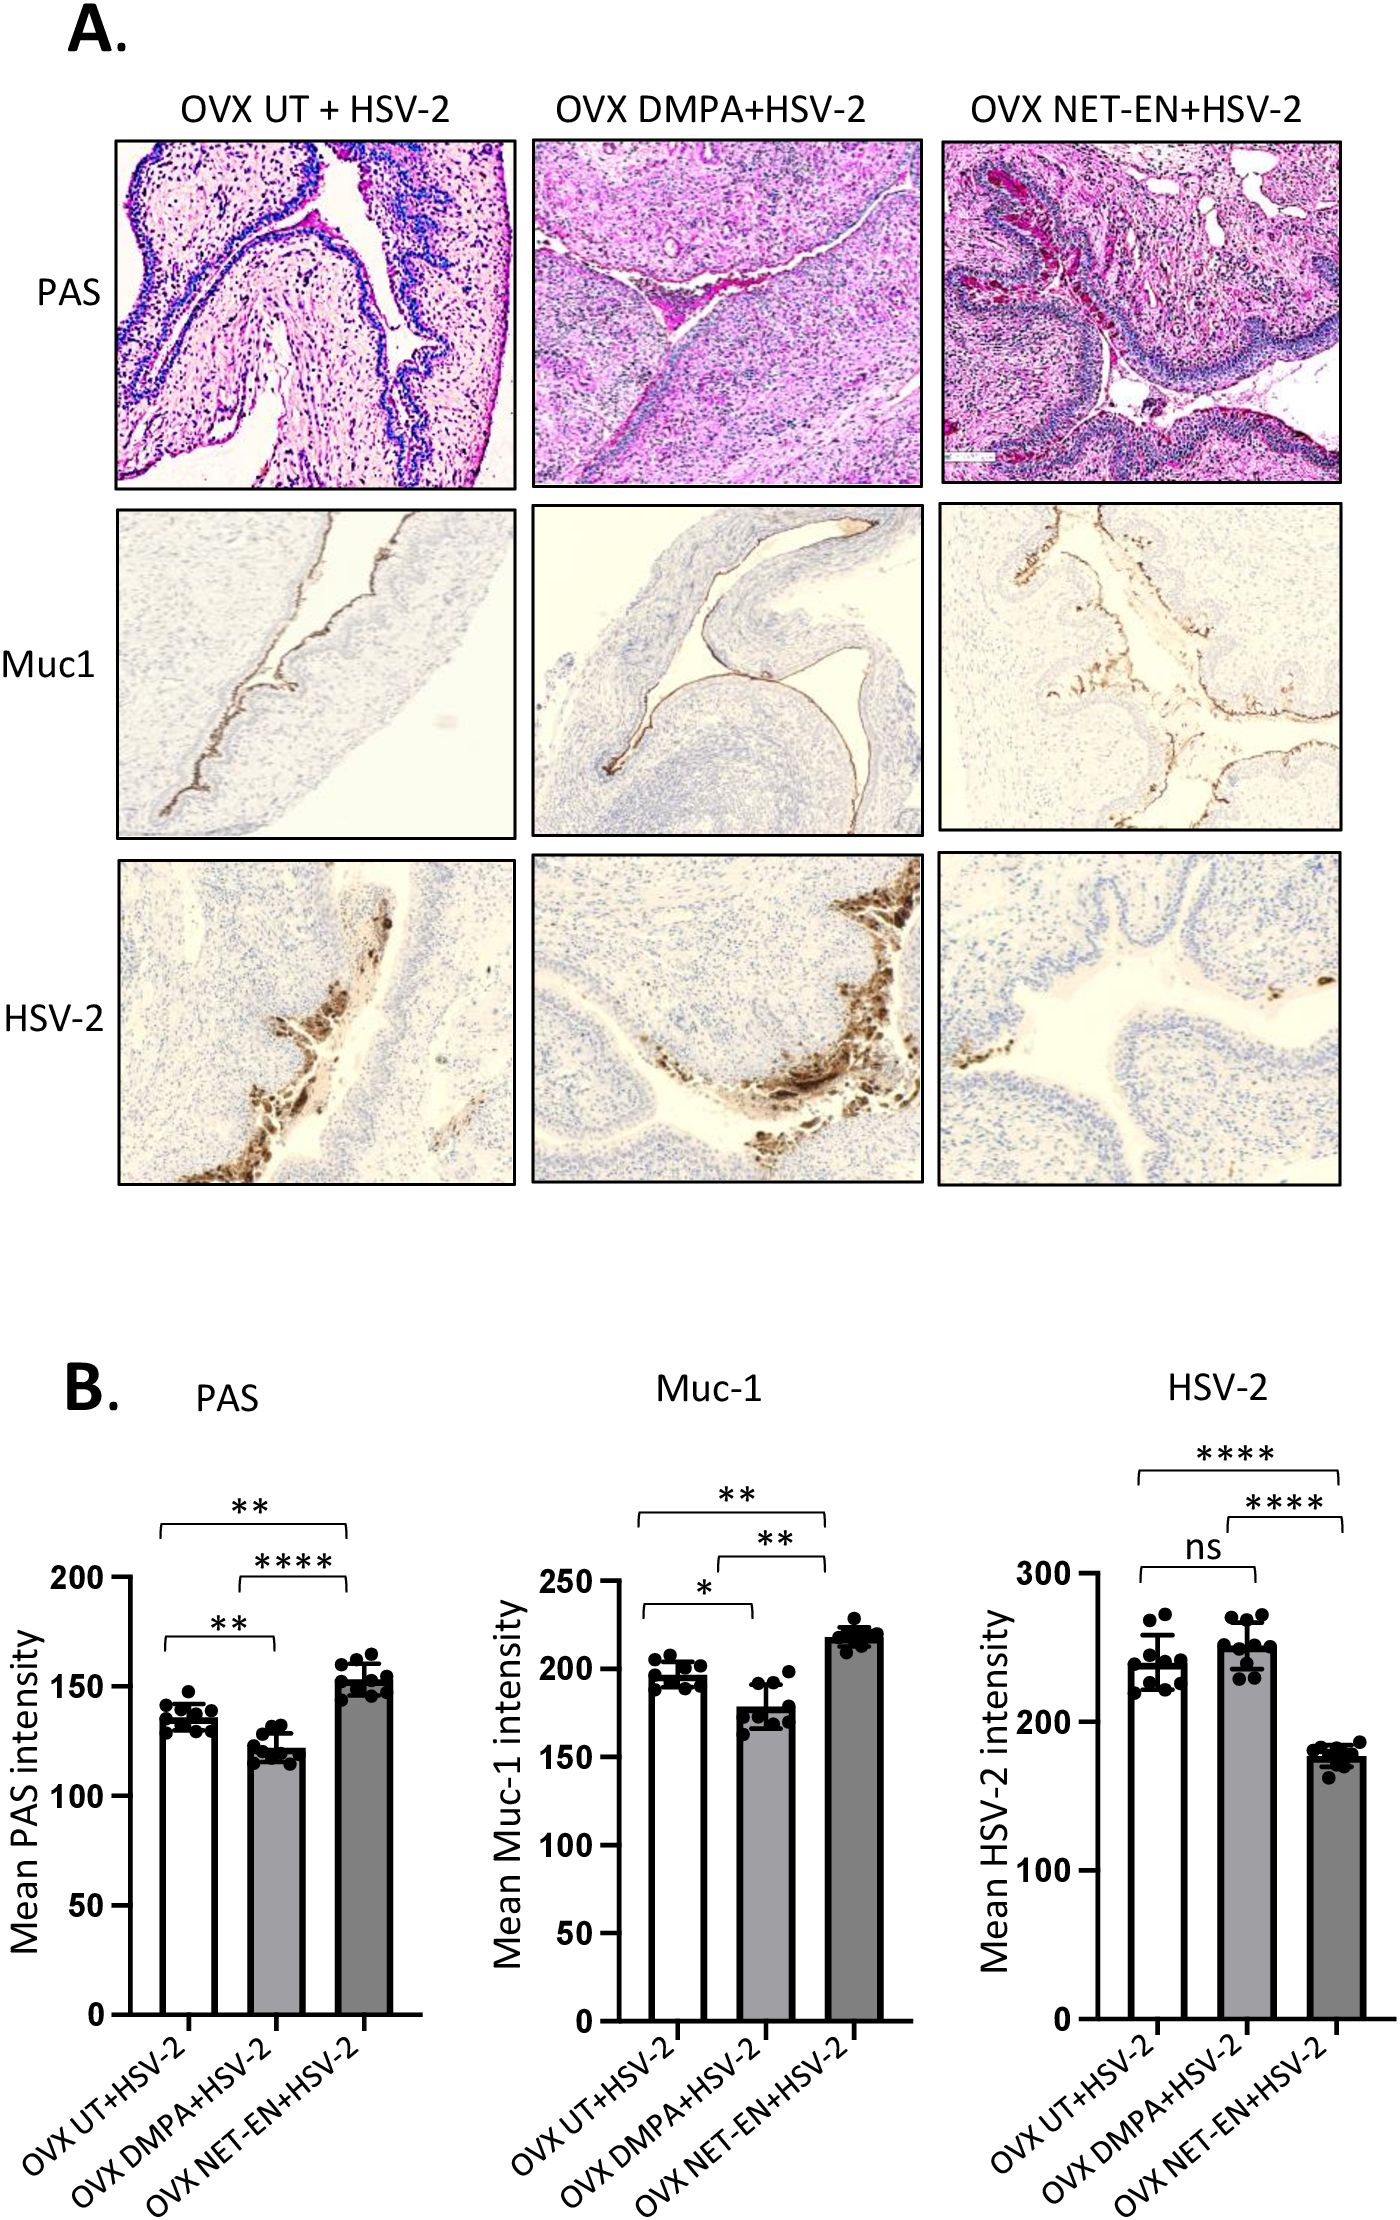
Figure 7. Immuno-histochemical analyses of mucin production and HSV-2 virus detection in the vaginal tract of OVX mice treated with NET-EN, DMPA or left untreated and subsequently infected with WT HSV-2. WT C57BL/6 OVX mice (n=5/group) were treated with NET-EN, DMPA or were left untreated (UT) for 2 weeks and then challenged intravaginally with WT HSV-2 333 (5 x 10³ PFU/mouse). Mice were monitored daily for pathology using the 0 to 5 scale (see Methods). Mice for all 3 groups were euthanized at day 5 post HSV-2 challenge when majority of the mice from DMPA and untreated groups reached stage 4/5 HSV-2 pathological score. Vaginal tissues were collected and processed for immuno-histological staining with Muc1 and HSV-2 antibodies. The experiments were repeated twice with similar results and representative slides for different treatment groups are displayed. (A) Vaginal tissues showing different levels of cell associated mucins (multiple mucin types) as detected by intensity of PAS staining (top images, dark pink stain) and Muc1 immunohistochemistry staining (middle images, dark brown stain), and HSV-2 immunohistochemistry staining (bottom images, dark brown stain). (B) PAS, Muc1 and HSV-2 immunohistochemistry staining intensities for images of vaginal tissues for different treatments exhibited in panel A were quantified by Fiji ImageJ software as shown in bar graphs. Bars indicate mean ± SEM for n=10 images (n=5 mice per treatment and 2 images per vaginal tissue). All data are drawn from 2 independent experiments. Data were analyzed utilizing the one-way ANOVA with Tukey’s multiple comparison test. *, P <0.05; **, P <0.01; ****, P <0.0001.
4 DiscussionDepot Medroxyprogesterone (DMPA) and Norethisterone Enanthate (NET-EN) are injectable pro
留言 (0)