
記住我

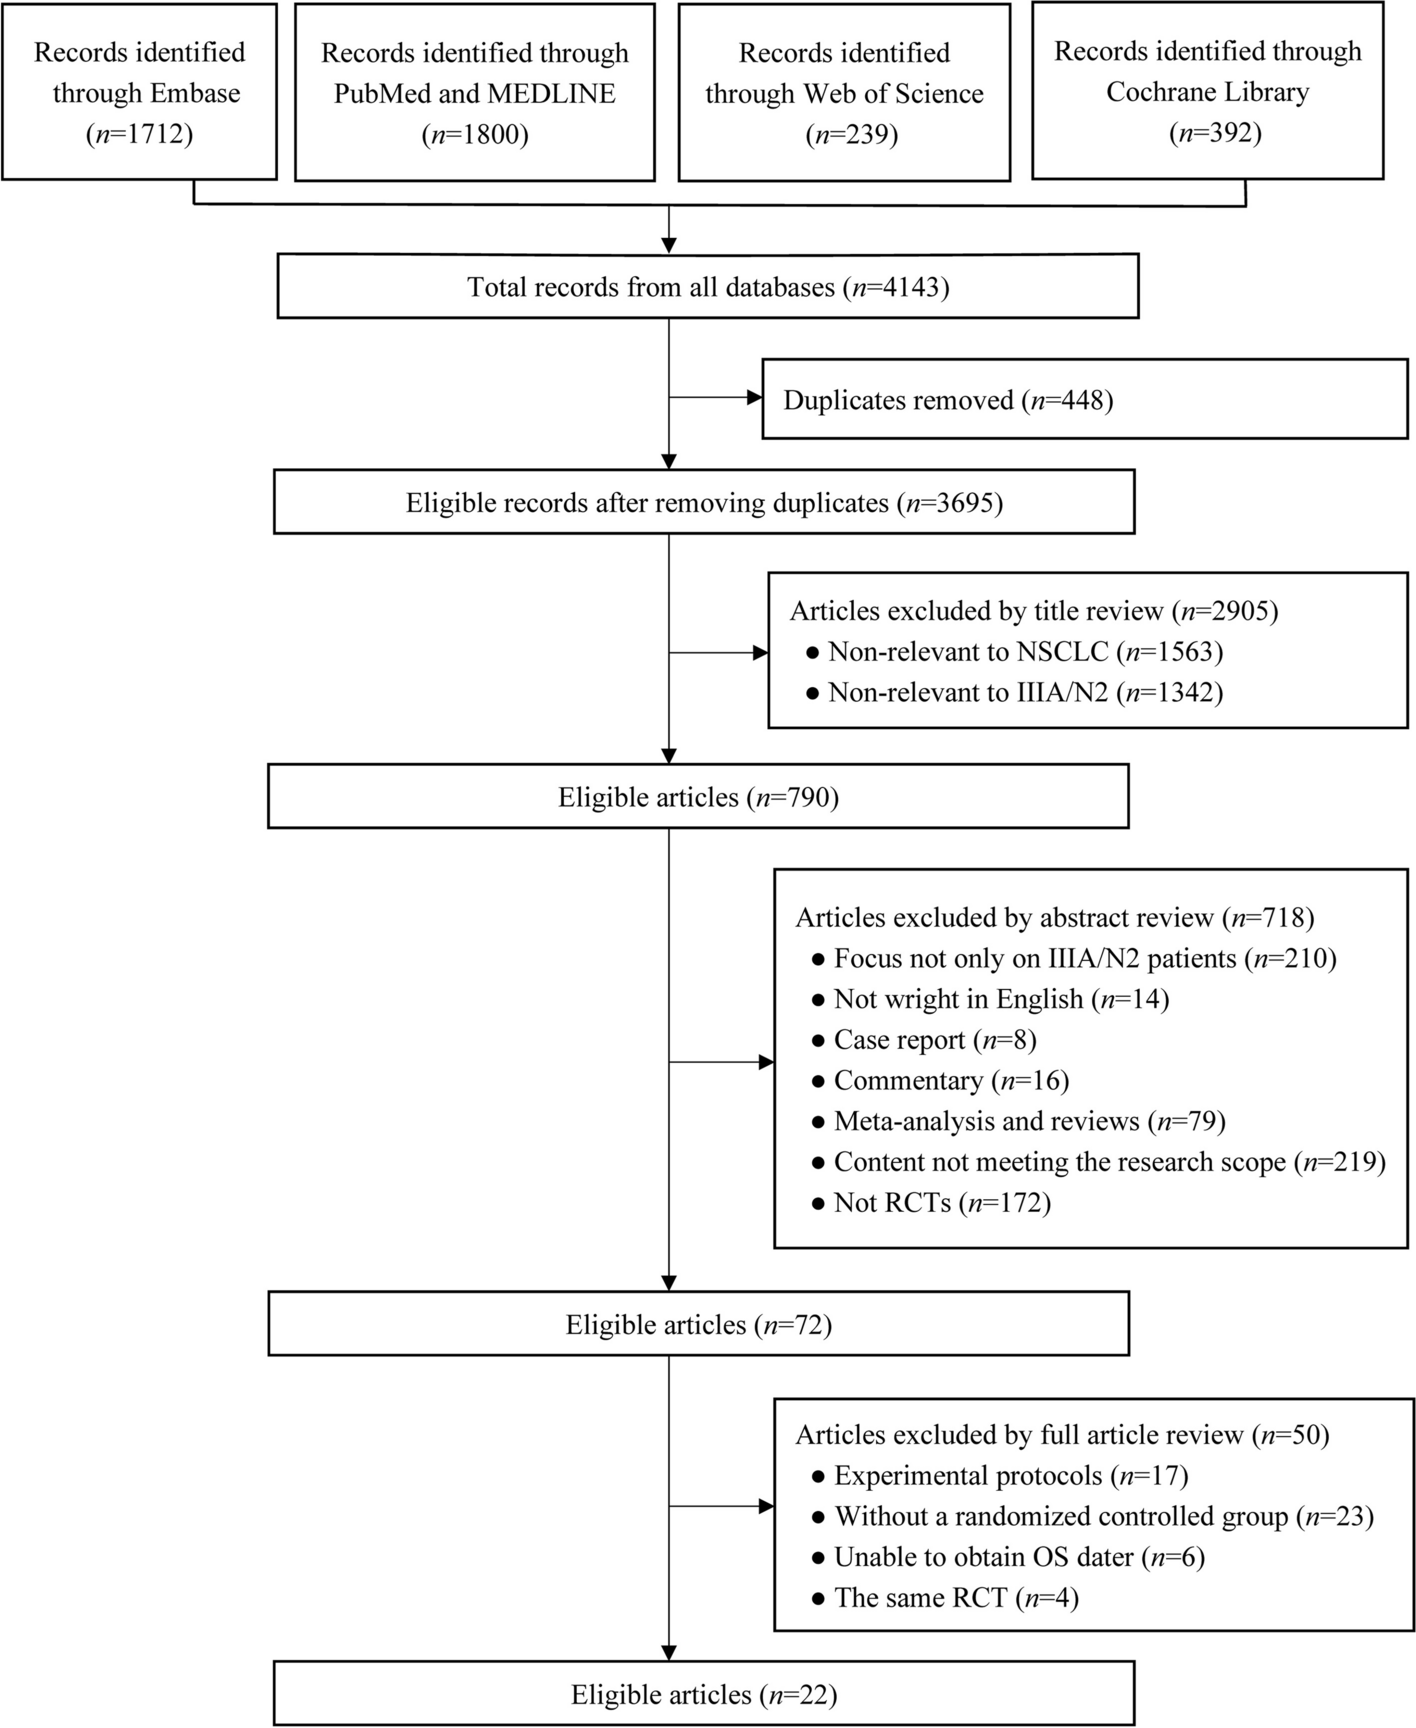


A total of 1098 cases registered between 2015 and 2020 and fulfilling the inclusion criteria could be included in the analysis (Fig. 1).
Fig. 1
Flow chart of the patient selection. It is noteworthy, that since PFS analysis requires a complete follow-up in addition to the death record, the size of the PFS group is smaller than OS one
Patient demographic and clinical informationTable 1 illustrates patient demographics and clinical information. Among the 1098 patients analysed, median age was 71 years, with a male to female ratio of 49–51%. Most tumours were located in the head of the pancreas (81%), 6% in the body and 7% in the tail, respectively. 6% had other or not specified locations. Data on TNM classification, grading and the resection status are shown in Table 1.
For tumours diagnosed in 2015 or 2016, the T category is classified according to the 7th edition of the TNM classification [21]. For tumours diagnosed starting from 2017, the T-category is classified according to the 8th edition [22].
The N category is always classified following the 8th edition of the TNM classification (pN1, metastasis in 1–3 LNs; pN2, metastasis in 4 or more LNs). There were more pT1 tumours and more patients with an N0 resection in the R0 wide group. Vice versa, the R1 group comprised more patients with pT4 and N2 tumours. Adjuvant chemotherapy was reported for 508 patients (46%). Gemcitabine-based regimens were reported for 71.6% and fluorouracil-based regimens for 28.3% of the patients. Fluorouracil-based therapy was mostly employed after 2018.
Table 1 Baseline clinical and patient characteristicsRelationship between CRM-status and overall survivalIn the whole cohort, the 3-year OS rate was significantly different between the groups: 51.5% for R0 wide/CRM- (95% CI 46.3–57.2%), 37.4% for R0 narrow/CRM+ (95% CI 32.8–72.7%) and 26.7% for R1 (95% CI 22.3–32%), respectively (Fig. 2A). Using R1 as reference, the HR for R0 wide/CRM- was 0.66 (95% CI 0.55–0.81) and 0.77 (95% CI 0.65–0.92) for R0 narrow/CRM+, respectively. A COX regression analysis (Fig. 2B) showed that apart from the R status, N-status, grading as well as adjuvant chemotherapy were important prognostic parameters.
Median OS was 37.6 months (95% CI, 30.8 to 45.8) in the R0 wide/CRM- group, 25.7 months (95% CI, 22.6 to 29.9) in the R0 narrow/CRM + group and 17.6 months (95% CI, 16.1 to 21.6) in the R1 resected group, respectively. This difference in median OS between the three groups was statistically significant (p < 0.001 for R0 wide/CRM- and R0 narrow/CRM + and p < 0.001 for R0 narrow/CRM + and R1). The results of mOS in the different subgroups are summarized in the Table 2.
Systemic adjuvant therapy modalities were equally distributed between the CRM groups.
Fig. 2
(A): 3-year-OS in R0/CRM-, R0/CRM + and R1 resected patients. Dotted lines refer to mOS for each curve. (B): Multivariate Cox regression analysis showed that apart from the R status, age, N-status, grading as well as adjuvant chemotherapy were important prognostic parameters. LVI stands for lymphovascular invasion, VI for venous invasion, and PNI for perineural invasion. 5-FU- and Gem-based refer 5-Fluorouracil- and Gemcitabine -based therapies, respectively
Role of the tumour gradingThe difference in mOS between the R0 CRM+/- and R1 groups was observed independently of tumour grading (grade 1/2: R0 wide/CRM- vs. R0 narrow/CRM + p = 0.0662; R0 narrow/CRM + vs. R1: p = 0.001; grade 3/4 tumours: R0 wide/CRM- vs. R0 narrow/CRM+: p = 0.029; R0 narrow/CRM + vs. R1: p = 0.04 (Fig. 2)). As expected, patients with grade 1/2 pancreatic cancers exhibited a longer mOS than those with grade 3/4 tumours. Median OS for grade 1/2 was 42.8 months (95% CI, 35.3 to 58.8) in the R0 wide/CRM- group, 32.5 months (95% CI, 27.2 to 39.5) in the R0 narrow/CRM + group and 21.4 months (95% CI, 17.4 to 24.8) in the R1-group (Fig. 3A). The respective mOS for grade 3/4 PDAC were 26.4 months (95% CI, 19.3 to 38.2) in the R0 wide/CRM- group, 19.6 months (95% CI, 16.9 to 23.8) in the R0 narrow/CRM + group and 16.1 months (95% CI, 12.9 to 19.3) in the R1 group (Fig. 3B). The difference in the 3-year OS rate between R0 wide/CRM- and R0 narrow/CRM + was more pronounced when tumours had a lower grading (G1/2 compared to G3/4; Fig. 2A and B; Table 2).
Fig. 3
Overall survival of patients with an R0 wide/CRM-, R0 narrow/CRM + and R1 resection according to tumour grading. Dotted lines refer to mOS for each curve. A: Grade 1/2. B: Grade 3/4
Role of tumour locationAnother important aspect is the dependence of resection status and overall survival on tumour location. A statistically significant difference in mOS between the R0 CRM+/- and R1 groups was observed in pancreatic head tumours (R0 wide/CRM- vs. R0 narrow/CRM + p = 0.013; R0 wide/CRM + vs. R1 and R0 narrow/CRM + both p < 0.001 (Table 2)). The median OS for this subgroup was 35.1 months (95% CI, 27.5 to 45.2) in the R0 wide/CRM- group, 25.7 months (95% CI, 22.6 to 30.7) in the R0 narrow/CRM + group, and 17.6 months (95% CI, 15.9 to 22.3) in the R1 group (Fig. 4A).
In tumours of the tail/body, the three-year overall survival (OS) in margin-negative patients (R0 CRM-) was significantly longer compared to margin-positive patients (R1/R0 CRM+) (59.6% vs. 41%, p = 0.01). The longest median overall survival (mOS) was observed in the R0 wide/CRM- group, where mOS was not reached. This was followed by the R0 narrow/CRM + group with a mOS of 30.4 months (95% CI, 22.0 to 60.9), and the shortest mOS of 21.4 months was seen in the R1 resection group (95% CI, 14.5 to 42.3). However, likely due to the small sample size, this difference was not statistically significant (Fig. 4B).
Fig. 4
Overall survival of patients with an R0 wide/CRM-, R0 narrow/CRM + and R1 resection for different tumour locations. Dotted lines refer to mOS on each curve. (A): pancreatic head (B): tail/body
Table 2 Median OS and mPFS according to the R status, location and tumour grading. “UCI” and “LCI” refer to the upper and lower confidence intervalsRelationship between CRM-status and progression free survival (PFS)PFS was also statistically significantly longer in R0 wide/CRM- resected patients compared to both R0 narrow/CRM + and R1 resected patients, respectively (Fig. 5A). mPFS was 32.3 months (95% CI, 24.4 to 44.3), 19.1 months (95% CI, 16.3 to 22.8), and 14.1 months (95% CI, 12.2 to 16.3) in the respective groups (p-value < 0.001 in both cases; Table 2). The corresponding 3-year PFS rates were 49%, 35% and 23% for R0 wide/CRM-, R0 narrow/CRM + and R1 resected patients, respectively. A COX regression analysis (Fig. 5B) showed that apart from the R status, N-status, grading as well as adjuvant chemotherapy were important prognostic parameters also for PFS.
Fig. 5
PFS in R0/CRM-, R0/CRM + and R1 resected patients: (A) Kaplan-Meier survival curves and (B) Multivariate Cox regression analysis. LVI stands for lymphovascular invasion, VI for venous invasion, and PNI for perineural invasion. 5-FU- and Gem-based refer 5-Fluorouracil- and Gemcitabine -based therapies, respectively
留言 (0)