
記住我


This study was an observational cohort study based on the population, utilizing data from the NHANES. NHANES, conducted by the National Center for Health Statistics of the Centers for Disease Control and Prevention, is a recurring population-based survey conducted every two years. It evaluates the nutritional and health status of the U.S. population. The NHANES was conducted with approval from the Ethics Review Board of the National Center for Health Statistics, and written consent was obtained from all participants.
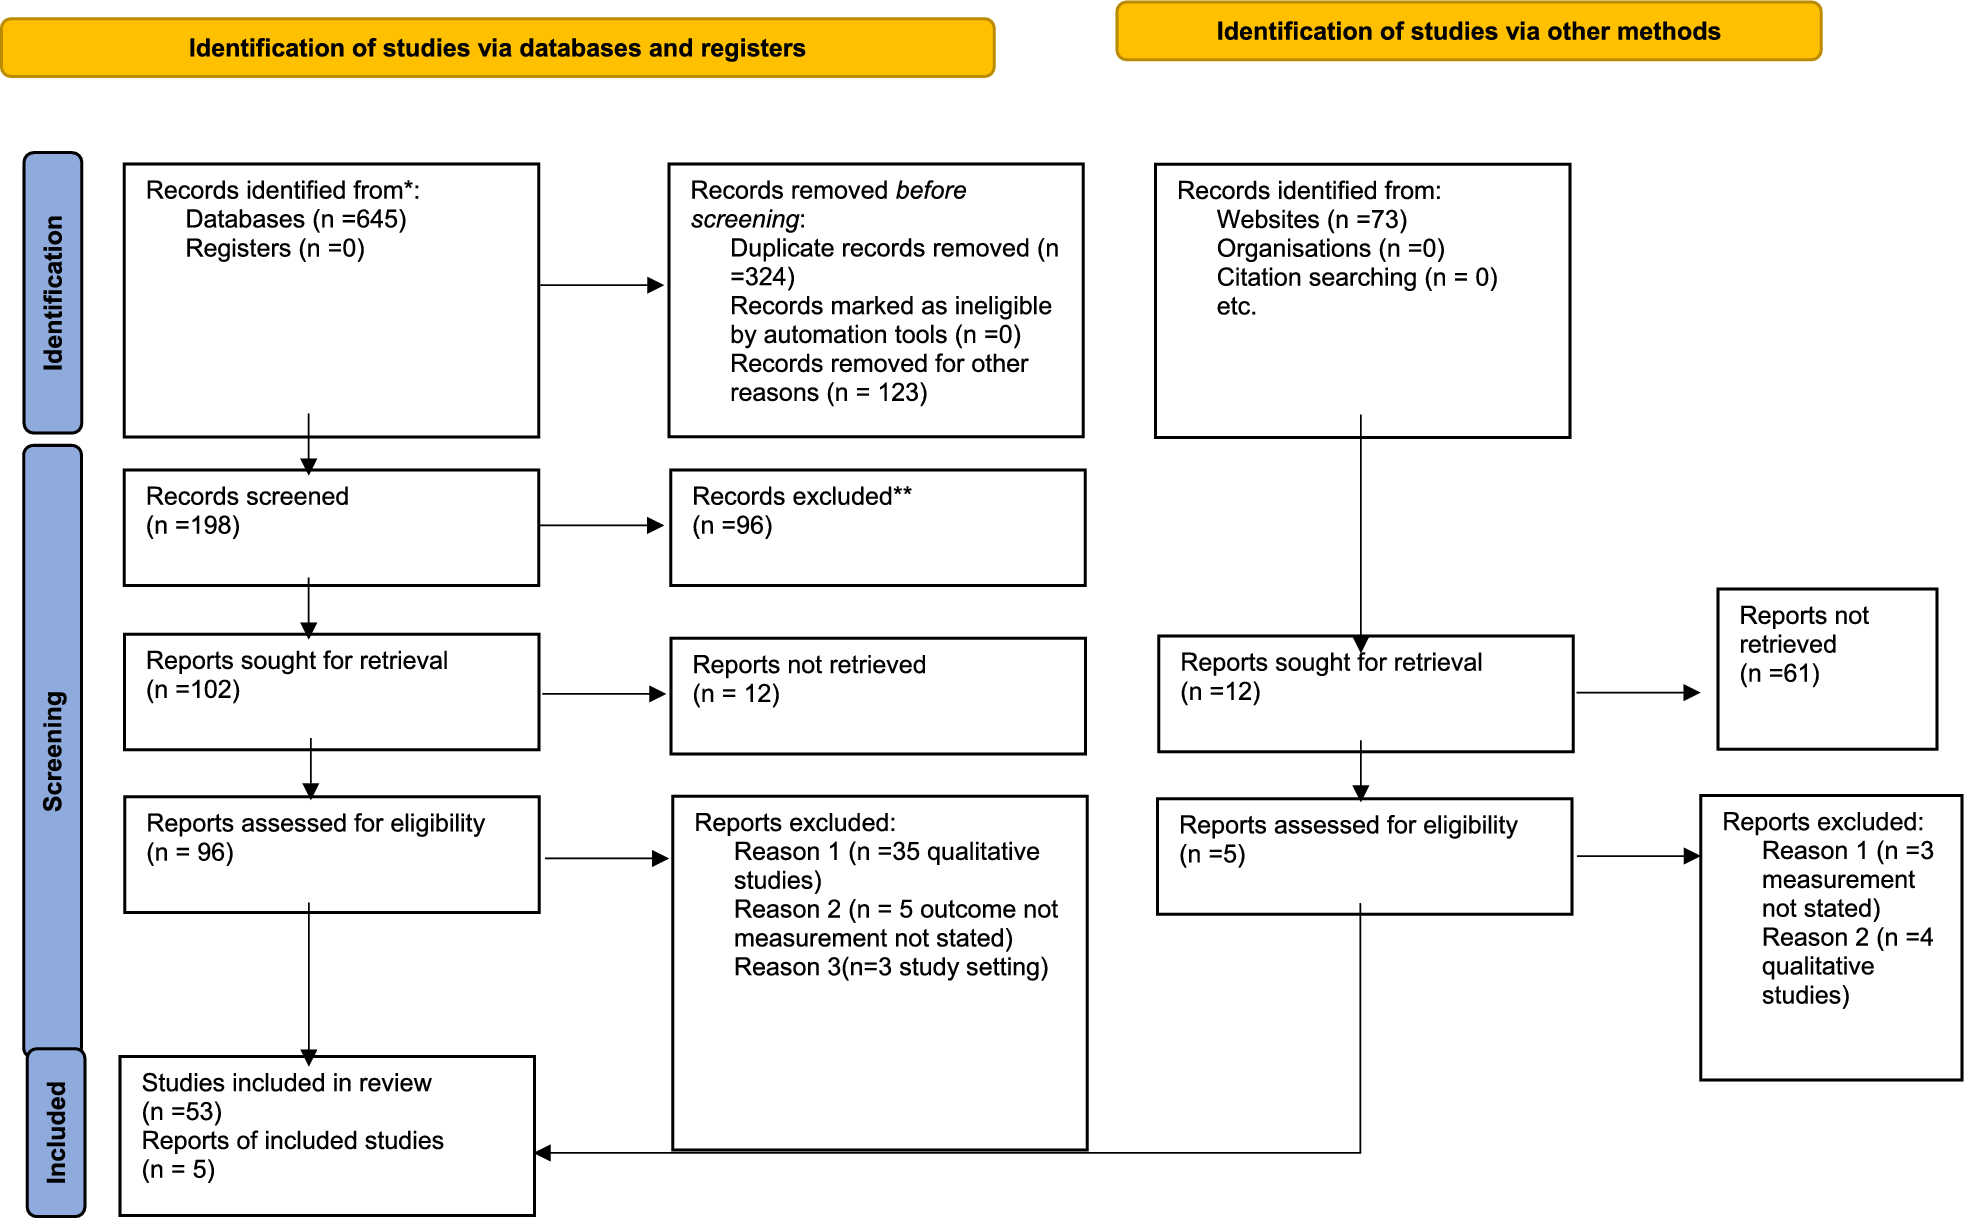
This study analyzed data from ten consecutive cycles of NHANES, spanning from 1999 to 2018. Initially, we included 55,081 adults aged 20 and above, and after excluding pregnant individuals(n = 1,547), a total of 53,534 were included in the analysis. Subsequently, we excluded patients with missing OBS calculations(n = 24,243) and CKD calculations(n = 230). After further excluding non-CKD patients (n = 24,654), a total of 4,407 CKD participants with complete OBS scores were included. We excluded participants with missing covariate data (n = 421) and those lost to follow-up (n = 2), resulting in a final sample of 3,984 adult participants (Fig. 1B).
Fig. 1
Overview of the study design. A. OBS calculation.The total oxidative balance score(OBS) includes dietary OBS (n = 16) and lifestyle OBS (n = 4). Within the OBS components, there are 5 pro-oxidants (represented by red squares) and 15 antioxidants (represented by green squares).Scoring Scheme: Alcohol consumption: Non-drinkers: 2 points; Moderate drinkers (women: 0–15 g/day; men: 0–30 g/day): 1 point; Heavy drinkers (women ≥ 15 g/day; men ≥ 30 g/day): 0 points. Other components: These are divided into tertiles (three groups) based on sex-specific ranges.The total OBS score ranges from 0 to 40 points. B.Screening flow of participants included in the research. C. Study design
Definition of OBSZhang et al. established the OBS utilized in this research [16], and it had been extensively validated previously. It comprised 16 dietary factors and 4 lifestyle factors(Fig. 1A). Based on their impact on OS, these components were categorized into pro-oxidants and antioxidants. A higher OBS underscored the increasing strength of antioxidant exposure. The components of Dietary OBS comprised fiber, carotenoids, riboflavin, niacin, vitamin B6, total folate, vitamin B12, vitamin C, vitamin E, calcium, magnesium, zinc, copper, selenium, total fat, and iron. Lifestyle OBS comprised body mass index (BMI), physical activity, alcohol consumption, and cotinine. Total fat and iron intake from dietary components, as well as BMI, alcohol consumption, and cotinine from lifestyle factors, were classified as pro-oxidants, while the remaining factors were classified as antioxidants. All OBS components were divided into three groups by gender and assigned scores accordingly. Antioxidant components were scored as 0, 1, or 2, whereas pro-oxidant components were scored inversely. The total OBS score ranged from 0 to 40. Table S1 displayed the detailed scoring scheme of OBS.In this study, participants were categorized into four quartiles (Q1 to Q4) based on their total OBS scores. The specific ranges for each quartile can be found in Table S2.
Dietary intake data in NHANES from 1999 to 2002 were based on a single 24-hour, face-to-face dietary recall. Since 2003, the survey included two 24-hour dietary recall interviews, with the initial face-to-face interview followed by a telephone interview conducted 3 to 10 days later [27]. In this study, we used data from the initial dietary recall interview to assess daily dietary intake. The evaluation of every nutritional element adhered to the recommendations outlined in the Food and Nutrient Database for Dietary Studies (FNDDS) offered by the USDA [28]. Furthermore, the nutrient calculations did not take into account nutrients acquired from dietary supplements or medications. The alcohol consumption information was obtained from a 24-hour recall. Serum nicotine was utilized as a substitute for smoking since it encompasses levels of both active and passive smoking. The BMI was computed by dividing the weight by the height squared (kg/m2). METs were computed weekly using information from household interviews about leisure activities performed by individuals in the previous 30 days. For more information on data collection, please refer to previous studies [16].
Definition of CKD and outcomeThe KDIGO guidelines [2] utilize estimated glomerular filtration rate (eGFR) and the urine albumin to creatinine ratio (UACR) to establish the diagnosis of CKD. Using the equation [29] from the Chronic Kidney Disease Epidemiology Collaboration (CKD-EPI), the eGFR was computed for every individual. The eGFR was divided into five categories: G1 (≥ 90 ml/min/1.73 m2); G2 (60–89 ml/min/1.73m2); G3a (45–59 ml/min/1.73 m2); G3b (30–44 ml/min/1.73m2); G4 (15–29 ml/min/1.73m2); G5 (< 15 ml/min/1.73m2). The UACR was divided into three levels: A1 (normal to mildly elevated, UACR < 30 mg/g or < 3 mg/mmol); A2 (moderately elevated, UACR 30–300 mg/g or 3–30 mg/mmol); A3 (severely elevated, UACR > 300 mg/g or > 30 mg/mmol). In this research, CKD was characterized as satisfying the requirements of UACR level A2 and eGFR level G3a or more severe.
All-cause mortality in CKD patients was the main result. Participants in the NHANES were prospectively followed from the date of enrollment until December 31, 2019. By matching various data such as social security numbers, names, birth dates, race/ethnicity, gender, birth status, and residence status, the National Center for Health Statistics (NCHS) connected the mortality records to the National Death Index (NDI).
Assessment of covariatesBased on prior research [30], the covariates in our study included age, gender, race, marital status, education level, poverty-to-income ratio (PIR), cholesterol, triglycerides, diabetes, hypertension, and cardiovascular disease (CVD). Household interviews provided demographic data, with race/ethnicity categorized as non-Hispanic white, non-Hispanic black, Mexican American, and other racial groups. Marital status included married, unmarried, cohabiting with a partner, as well as individuals who were widowed, divorced, or separated. Educational attainment was categorized as less than high school, high school diploma or equivalent, and above high school. PIR was categorized into three groups: ≤1.3, 1.3–3.5, and > 3.5. The diagnosis of hypertension was made using the criteria of having a systolic blood pressure of at least 140 mmHg or a diastolic blood pressure of at least 90 mmHg, or by self-reporting having hypertension. CVD was characterized as a self-reported identification of coronary heart disease, chest pain, stroke, heart attack, or heart failure. Diabetes was diagnosed by a doctor, based on a 2-hour oral glucose tolerance test with blood glucose levels equal to or greater than 11.1 mmol/L, random blood glucose levels equal to or greater than 11.1 mmol/L, fasting glucose levels equal to or greater than 7.0 mmol/L, glycated hemoglobin HbA1c levels above 6.5%, or the administration of diabetes medications or insulin.
Statistical analysisMeans (standard deviations) or medians (interquartile ranges, IQR) were used to present continuous variables, whereas categorical variables were described using numerical values (percentages) in the feature description. ANOVA and chi-square tests were used to analyze the variations in variable characteristics among quartiles of OBS groups. To evaluate the effect of OBS on the overall mortality in the CKD population, we utilized Cox regression analysis.OBS were treated as both continuous variables and categorical variables (quartiles).Linear trend tests were performed by treating the quartiles of OBS as a continuous variable. The analysis was conducted in three progressively adjusted models. Model 1: No adjustment for covariates to assess the basic relationship between OBS and all-cause mortality risk. Model 2: Adjusted for basic demographic variables including age, sex, race/ethnicity, and marital status, to account for their influence on the relationship between OBS and mortality risk. Model 3: Further adjusted for additional factors including PIR, education level, cholesterol, triglycerides, diabetes, hypertension, and CVD, to more comprehensively control for confounding variables and improve the accuracy of the analysis. Additionally, Kaplan-Meier survival curves were used to estimate survival across different OBS levels, and the log-rank test was applied to evaluate survival differences among the groups, providing a visual comparison of the association between OBS and all-cause mortality risk.In our final analysis, we independently investigated the relationship between dietary OBS and lifestyle OBS with all-cause mortality among individuals with CKD.
We performed the following sensitivity analysis. First, to detect potential interactions, we conducted stratified analyses based on age (< 65 years and ≥ 65 years), gender (male and female), marital status (single, non-single), education level (less than high school, high school and above), hypertension (yes and no), diabetes (yes and no), and history of CVD (yes and no). We applied weights according to the NHANES analytic guidelines and used multiple imputation methods to handle missing data, reassessing the robustness of our results.
All analyses were conducted using R, version 4.2.2 (R Project for Statistical Computing), the survey package, version 4.1-1, and Free Statistics software version 1.9.2 (Beijing FreeClinical Medical Technology Co., Ltd.). Significance was attributed to statistics with two-sided P values below 0.05.
留言 (0)