
記住我


After cleaning and handling the data, a total of 6734 audited patient referrals for CT scans across 125 centers in seven countries were included in the audits. There were approximately 1000 records per country in the initial sample except for Finland, which had only 744 records, and Greece with 909 records. In general, few records were excluded from the audits (3% on average, a maximum of 7% in Denmark, minimum of approximately 1% in Slovenia and Estonia) due to invalid/duplicate records.
Additionally, on average approximately 9.5% of the audited CT examinations did not receive a score of appropriateness, due to a lack of or insufficient clinical information provided in the referral. There was large variability in this rate between countries, ranging from 0.3% in Finland up to 22% in Greece and 27% in Slovenia. If the clinical indications and the reason for the examination are absent from the referral, then it is impossible for the radiologist to evaluate the appropriateness of the requested CT examination. In this case, the requested CT examination cannot be justified.
After excluding invalid data (such as duplicates) and referrals that could not be scored due to insufficient clinical information, a total of 5899 referrals were ultimately evaluated and scored, representing about 88% of the total audited referrals across the participating countries (Table 1).
Table 1 Overview of the sample in the study countriesInter-observed variability between the two auditors was assessed in each country. Partial disagreement goes from 8% in Slovenia and Estonia to 18% in Hungary. Significant disagreement goes from 3% in Estonia and Finland to 12% in Denmark and 14% in Greece. See Appendix 3 for a full analysis.
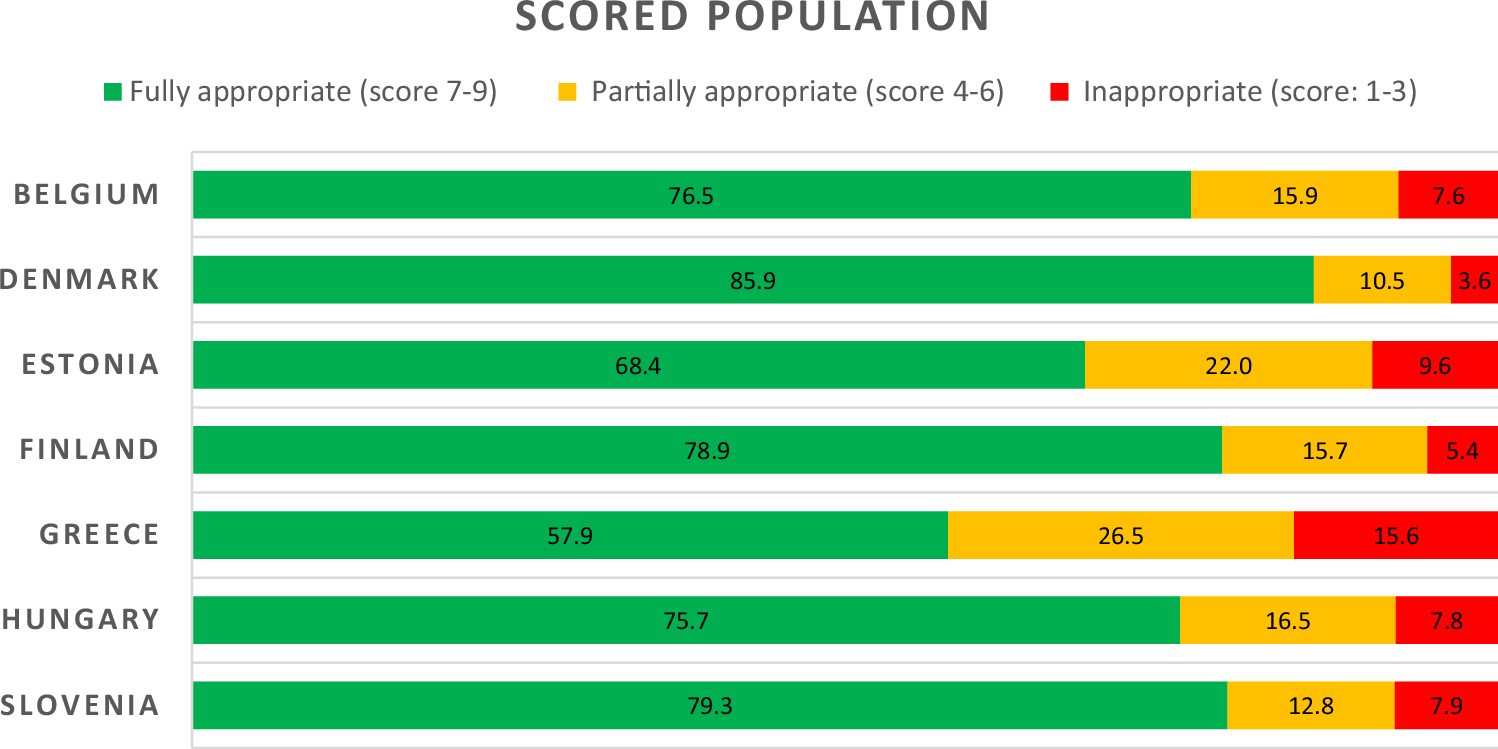
Of the examinations that were scored, the average proportion of fully appropriate CT examinations (score 7–9) was 75%, with the highest rate found in Denmark (86%), followed by Finland and Slovenia (~79%), Hungary and Belgium (~76%), Estonia (69%), and finally Greece with the lowest AR (58%). The average proportion of CT examinations found to be inappropriate (score 1–3) was 8.2% (minimum of 3.6% in Denmark and up to a maximum of 15.6% in Greece). Partially appropriate (score 4–6) rate ranges from 10.5% in Denmark to 26.5% in Greece (see Fig. 1).
Fig. 1
Percentage (%) of fully appropriate, partially appropriate, and inappropriate* CT examinations in each country among the scored population. * Inappropriate group includes cases that received a score of 0 due to a lack of match with the ESR iGUIDE exam recommendations
Table 2 presents the association between explanatory variables and appropriateness level according to ESR as a binary variable, in each country according to the results of chi-square tests.
Table 2 Association between explanatory variables and AR according to ESR iGuide by countryBelgiumSignificant associations were found between the degree of appropriateness according to ESR iGuide and institution type (p = 0.002), gender of the patient (p < 0.001), age group of the patient (p = 0.03), and the expertise of the referring physician (p < 0.001). Higher AR was found in the public sector (79%) and for males (81%) compared to the private sector (70%) and females (71%). AR was much lower among children compared to adults (59% vs 77%, respectively), although only 27 children were included, and for general practitioners compared to specialists (53% vs 80%, respectively). A non-significant association was found between the degree of appropriateness according to ESR iGuide and the status of the patient, with higher AR for hospitalization compared to ambulatory care (81% vs 76%, respectively; p = 0.058).
DenmarkA significant association was found between the degree of appropriateness according to the ESR iGuide and the specialty of the referring physician (p = 0.0004). Highest AR was observed for oncologists (93.7%) and emergency medicine doctors (91.7%). AR was lower for general practitioners as compared to specialists (75.5% vs 87.5%, respectively, p = 0.001).
EstoniaA significant association was found between the degree of appropriateness according to ESR iGuide and belonging to a public or private institution (69.6% vs 38.9%, respectively, p = 0.0001), the status of the patient (p = 0.0018), gender of the patient (p = 0.0255), and the specialty of the referring physician (p < 0.0001), with a lower AR in the private sector and for ambulatory care compared to public sector and hospitalization (inpatient/emergency). Since there were only two general practitioners in the sample, we could not compare AR for general practitioners as compared to specialists. The reason for that is that in Estonia general practitioners cannot refer to CT. Appropriateness ratio was lower in female patients compared to male patients (65% vs 72%, respectively, p = 0.025). Highest AR was observed for oncology doctors (81.4%) and emergency medicine doctors (78.3%).
FinlandFor the data collected in Finland as part of this study, referrer information and inpatient/outpatient status were often lacking in the electronic medical records. No significant associations were found between the degree of appropriateness according to ESR iGuide and institution type, patient status, or gender. There were no ambulatory cases and 667 records (93%) were undetermined for patient status. No association was found for age group, but only 14 children were included in the study. No association was found between referrer specialty and ESR appropriateness. For referrer specialty, 99% of the records were undetermined. In Finland, general practitioners cannot refer to CT so a comparison between general practitioners and specialist doctors is not relevant.
GreeceSignificant associations were found between degree of appropriateness according to ESR iGuide and institution type, patient status, and referrer specialty (all three with p < 0.001). Higher ARs were found in the public sector (72%), in inpatient/emergency (82%) compared to private sector (50%), and in ambulatory care (40%). Referrer specialty was also found to be associated with AR, which was higher for oncologists (76.6%) and surgical specialties (60%) compared to internal medicine (52.5%), brain-related specialties (48%), and family medicine (40%). AR was much lower among adults compared to children (58% vs 100%, respectively; p = 0.34), though this was not significant, and since only two children were included in the study, no conclusion can be drawn regarding the association with AR. No associations with referrer specialty (grouped) were found for general physicians and for males compared to specialists (40% vs 58%, respectively; p = 0.16) and to females (55% vs 60%, respectively; p = 0.13), although there were only 20 referrals from general physicians in the sample.
HungaryA significant association was found between the degree of appropriateness according to ESR iGuide and the status of the patient (p = 0.0002) and the specialty of the referring physician (p < 0.0001). The highest AR was observed for oncologists (84%). In Hungary, general practitioners cannot refer to CT so a comparison between general practitioners and specialist doctors is not relevant and residents in emergency services referring patients were counted as general practitioners because they were not yet board-certified.
SloveniaSignificant differences were demonstrated in ARs between private and public institutions (68% vs 83% respectively, p < 0.0001), between inpatient and ambulatory treatment (84% vs 77%, respectively, p = 0.05), and according to the referrer specialty (grouped) (83% for specialists vs 69% for general practitioners, p = 0.0007), as well as the referrer specialty (for example 94% among emergency medicine specialists vs 67% among radiologists, p = 0.0003).
AR for each anatomical area for CT requests by country is shown in Fig. 2. The average AR in the ESR iGuide system by anatomical area was 76%. When examining the AR for exam types with more than five referrals analyzed, the highest AR was found for CT coronography (range of 86% to 100%). It should be noted that large variability in AR was found between countries and exam types. For example, spine CT (20% in Hungary up to 100% in Finland), pelvic CT (33% in Greece up to 92% in Hungary), and CT of the extremities (14% in Greece up to 88% in Denmark). In general, Greece and Estonia had relatively lower AR across all exam types compared to the other countries.
Fig. 2
Radar chart showing AR for each anatomical area1 for CT requests by country
Table 3 presents the distribution of exam types where a more appropriate exam was recommended in each country. In 89% of cases of inappropriate CT examinations, on average, a different exam was recommended than the requested exam (83% in Estonia to 96% in Hungary). It was found that at least one auditor recommended one of four types of exams as a more suitable exam: MR (13–39%), X-ray (11–28%), other CT (7–26%), and US (3–10%). The highest percentage of exams recommended, instead of the referred CT, in each country were MR (35%, Belgium; 32%, Estonia; 39%, Slovenia; and 32%, Hungary), 2 + exams (35%, Denmark; 30%, Greece), X-ray (28%, Greece), other CT that the one referred (26%, Finland). It was found that performing at least two different types of exams was recommended in 7% (Estonia) to 35% (Denmark) of exams that the system recommended as more suitable than the requested exam. This situation may arise from disagreement between auditors.
Table 3 More appropriate exam distribution within each country where CT imaging was marked inappropriate (score less than 7), by exam type
留言 (0)