
記住我


A total of 100 participants (median age: 55.0 years [IQR 45.0, 61.0 years old], range 20–75 years, 51 females) were prospectively included (Table 1). On percutaneous liver biopsy, 30 (30.0%) patients had grade 1 steatosis, 28 (28.0%) were classified as grade 2, and 42 (42.0%) had grade 3 steatosis. Fifty-one (51.0%) patients had advanced fibrosis at histopathology.
Table 1 Clinical, laboratory, and histopathological characteristics of the final cohort, with their comparison with steatosis gradesStatistically significant differences according to steatosis grades were observed in age (p = 0.001), aspartate transaminase (p = 0.013), alanine transaminase (p = 0.006), CAP measurements (p = 0.001), percentage of steatosis at histopathological analysis (p < 0.001), ballooning (p = 0.022), and NAS (p < 0.001).
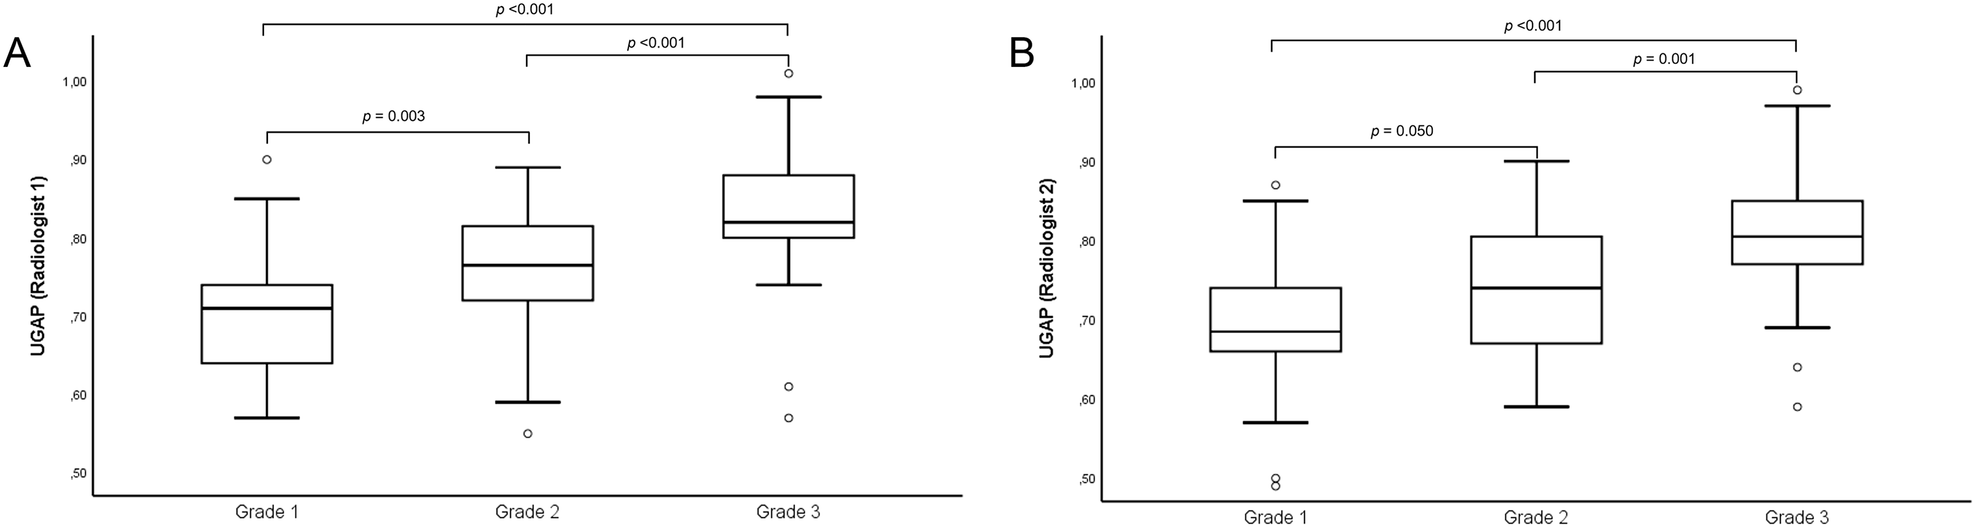
Diagnostic performance of UGAPThe median UGAP value was 0.78 dB/cm/MHz (IQR: 0.04 dB/cm/MHz; IQR/Med: 5.55%) for R1 and 0.77 dB/cm/MHz (IQR: 0.04 dB/cm/MHz; IQR/Med: 5.50%) for R2 (Table 2). No measurement provided by both radiologists was considered invalid (all of them presented with IQR/Med being ≤ 30%, with a success rate of 100%). Median UGAP values were 0.71 dB/cm/MHz (IQR, 0.64, 0.74), 0.77 dB/cm/MHz (IQR, 0.72, 0.81), and 0.82 dB/cm/MHz (IQR, 0.80, 0.88) for R1 in patients with steatosis grade 1, 2, and 3 (p < 0.001), respectively, and 0.69 dB/cm/MHz (IQR, 0.66, 0.74), 0.74 dB/cm/MHz (IQR, 0.67, 0.81), and 0.81 dB/cm/MHz (IQR, 0.77, 0.86) for R2 in patients with steatosis grade 1, 2, and 3 (p < 0.001), respectively (Fig. 1). Examples of UGAP measurements with their histopathological correlation according to steatosis grades are provided in Fig. 2. Second measurements values provided by the first reader are reported in Supplementary Table 1.
Table 2 Median (Med) UGAP values (measured in dB/cm/MHz), with interquartile range (IQR) and IQR/Med (%) of the study cohort divided by steatosis gradeFig. 1
Plot box graphs with pairwise comparison of ultrasound-guided attenuation parameter (UGAP) measurements provided by the two radiologists (A: R1; B: R2) in different steatosis grades
Fig. 2
Ultrasound-guided attenuation parameter (UGAP) measurements (upper row) with the corresponding attenuation map (middle row) and histopathological correlation (lower row). A 68-year-old male with median UGAP of 0.71 dB/cm/MHz and 20% hepatic steatosis at histopathological analysis. B 41-year-old male with median UGAP of 0.76 dB/cm/MHz and 50% hepatic steatosis at histopathological analysis. C 21-year-old male with median UGAP of 0.93 dB/cm/MHz and 90% hepatic steatosis at histopathological analysis
A significant moderate correlation was observed between UGAP values and BMI (Table 3, p < 0.001 for both R1 and R2), CAP (p < 0.001 for both R1 and R2), percentage of steatosis at histopathological analysis (p < 0.001 for both R1 and R2), and NAS score (p < 0.001 for R1, p = 0.001 for R2).
Table 3 Correlation between UGAP measurements provided by the two radiologists and other patients’ characteristicsDiagnostic performances of UGAP and CAP are reported in Table 4. For the diagnosis of grade ≥ 2 steatosis, the AUCs of UGAP were 0.828 (95% CI: 0.739, 0.896) for R1 and 0.779 (95% CI: 0.685, 0.856) for R2. The cutoff value of UGAP > 0.75 dB/cm/MHz was associated with a sensitivity of 67.1–75.7% and a specificity of 80.0–86.7% for the diagnosis of grade ≥ 2 steatosis. For the diagnosis of grade 3 steatosis, the AUCs of UGAP were 0.830 (95% CI: 0.742, 0.898) for R1 and 0.803 (95% CI: 0.711, 0.876) for R2. The cutoff value of UGAP > 0.75 dB/cm/MHz was associated with a sensitivity of 85.7–90.5% and a specificity of 67.2–70.7% for the diagnosis of grade 3 steatosis.
Table 4 Performance of UGAP and CAP for the diagnosis of grade ≥ 2 or grade 3 steatosis with sensitivity and specificity according to the optimal cutoffsComparison of the diagnostic performance between the two radiologists was not statistically different for grade ≥ 2 (p = 0.113) and grade 3 (p = 0.394) steatosis. The diagnostic performance of UGAP was higher compared to CAP for both the diagnosis of steatosis grade ≥ 2 (R1, p = 0.005; R2, p = 0.061) and grade 3 (R1, p = 0.006; R2, p = 0.083) steatosis. Receiver operating characteristic curves are provided in Fig. 3.
Fig. 3
Receiver operating characteristic curves of ultrasound-guided attenuation parameter (UGAP) and controlled attenuation parameter (CAP) for the diagnosis of grade ≥ 2 (A) and grade 3 (B) steatosis
In patients with obesity, the diagnostic performance of UGAP for grade ≥ 2 steatosis was 0.796 (95% CI: 0.628, 0.963) for R1 and 0.736 (95% CI: 0.570, 0.902) for R2. In patients without obesity, the diagnostic performance of UGAP for grade ≥ 2 steatosis was 0.820 (95% CI: 0.699, 0.941) for R1 and 0.781 (95% CI: 0.651, 0.910) for R2. On multivariable analysis (Supplementary Table 2), including clinical and histopathological characteristics, only the percentage of steatosis was an independent variable associated with UGAP > 0.75 dB/cm/MHz (OR: 1.08, 95% CI: 1.05, 1,12; p < 0.001).
Inter- and intra-operator agreementThe inter-operator reliability was excellent, with an ICC of 0.92 (95% CI: 0.87, 0.95). The intra-operator reliability was also excellent, with an ICC of 0.95 (95% CI: 0.92, 0.96). Bland-Altman analysis showed that the mean difference between operators was 0.01 dB/cm/MHz (95% limits of agreement, −0.09 to 0.12 dB/cm/MHz), and the mean difference between measurements of the first radiologist was 0.01 dB/cm/MHz (95% limits of agreement, −0.08 to 0.09 dB/cm/MHz).
Diagnostic performance of 2D-SWEThe 2D-SWE was measured in 94 patients. Among them, valid (IQR/Med ≤ 30%) liver stiffness measurements were obtained in 68/94 (72.3%) patients with 2D-SWE; particularly in five patients, the twelve measurements could not be completed due to the presence of artifacts, while 21 patients had an IQR/Med > 30%. In patients with valid measurements, 43/68 (63.2%) had significant fibrosis, and 31/68 (45.6%) had advanced fibrosis. In the subgroup of patients with valid measurements, median liver stiffness was 6.75 kPa (IQR: 1.15 dB/cm/MHz; IQR/Med: 16.30%). Liver stiffness measured with 2D-SWE was significantly higher in patients with significant fibrosis compared to patients without significant fibrosis (median 7.26 [IQR: 6.19, 9.50] vs 5.57 [IQR: 4.55, 6.66]; p < 0.001) and in patients with advanced fibrosis compared to patients without advanced fibrosis (median 8.39 [IQR: 6.96, 10.15] vs 5.81 [IQR: 4.89, 6.80]; p < 0.001). Moderate correlation was observed between 2D-SWE values and fibrosis staging (ρ: 0.641, p < 0.001) or TE (ρ: 0.669, p < 0.001). Examples of 2D-SWE measurements with histopathological correlates are provided in Fig. 4.
Fig. 4
2D shear wave elastography (2D-SWE) liver stiffness measurements (upper row) with the corresponding histopathological correlation (lower row). A 21-year-old male with median liver stiffness measurement of 5.81 kPa and periportal fibrosis (F1c) at histopathological analysis. B 58-year-old female liver stiffness measurement of 10.59 kPa and periportal and bridging fibrosis with nodular transformation (F4) at histopathological analysis
Diagnostic performances of 2D-SWE and TE are reported in Table 5. For the diagnosis of significant fibrosis, 2D-SWE had an AUC of 0.807 (95% CI: 0.693, 0.893), and the optimal cutoff value was > 5.85 kPa, with a sensitivity of 86.0% and a specificity of 64.0%. For the diagnosis of advanced fibrosis, 2D-SWE had an AUC of 0.861 (95% CI: 0.767, 0.934), and the optimal cutoff value was > 6.75 kPa with a sensitivity of 80.6% and a specificity of 75.7%.
Table 5 Performance of 2D shear wave elastography (2D-SWE) and transient elastography (TE) for the diagnosis of significant (F2-F4) and advanced (F3-F4) fibrosis with sensitivity and specificity according to the optimal cutoffsComparison of the diagnostic performance in the 68 participants with reliable 2D-SWE and TE was not statistically difference for significant (p = 0.482) and advanced (p = 0.566) fibrosis. Receiver operating characteristic curves are provided in Fig. 5.
Fig. 5
Receiver operating characteristic curves of 2D shear wave elastography (2D-SWE) and transient elastography (TE) for the diagnosis of significant (A) and advanced (B) fibrosis
Comparison of patients with and without valid 2D-SWE measurements is provided in Supplementary Table 3. Patients with invalid measurements were more frequently female patients (76.9% vs 39.7%, p = 0.001), with higher BMI (34.2 kg/m2 vs 29.8 kg/m2, p = 0.017) and higher skin-to-liver capsule distance (2.7 cm vs 2.1 cm, p < 0.001). No significant differences were observed according to steatosis grading (p = 0.875) or other histopathological characteristics.
留言 (0)