Dataset analysis
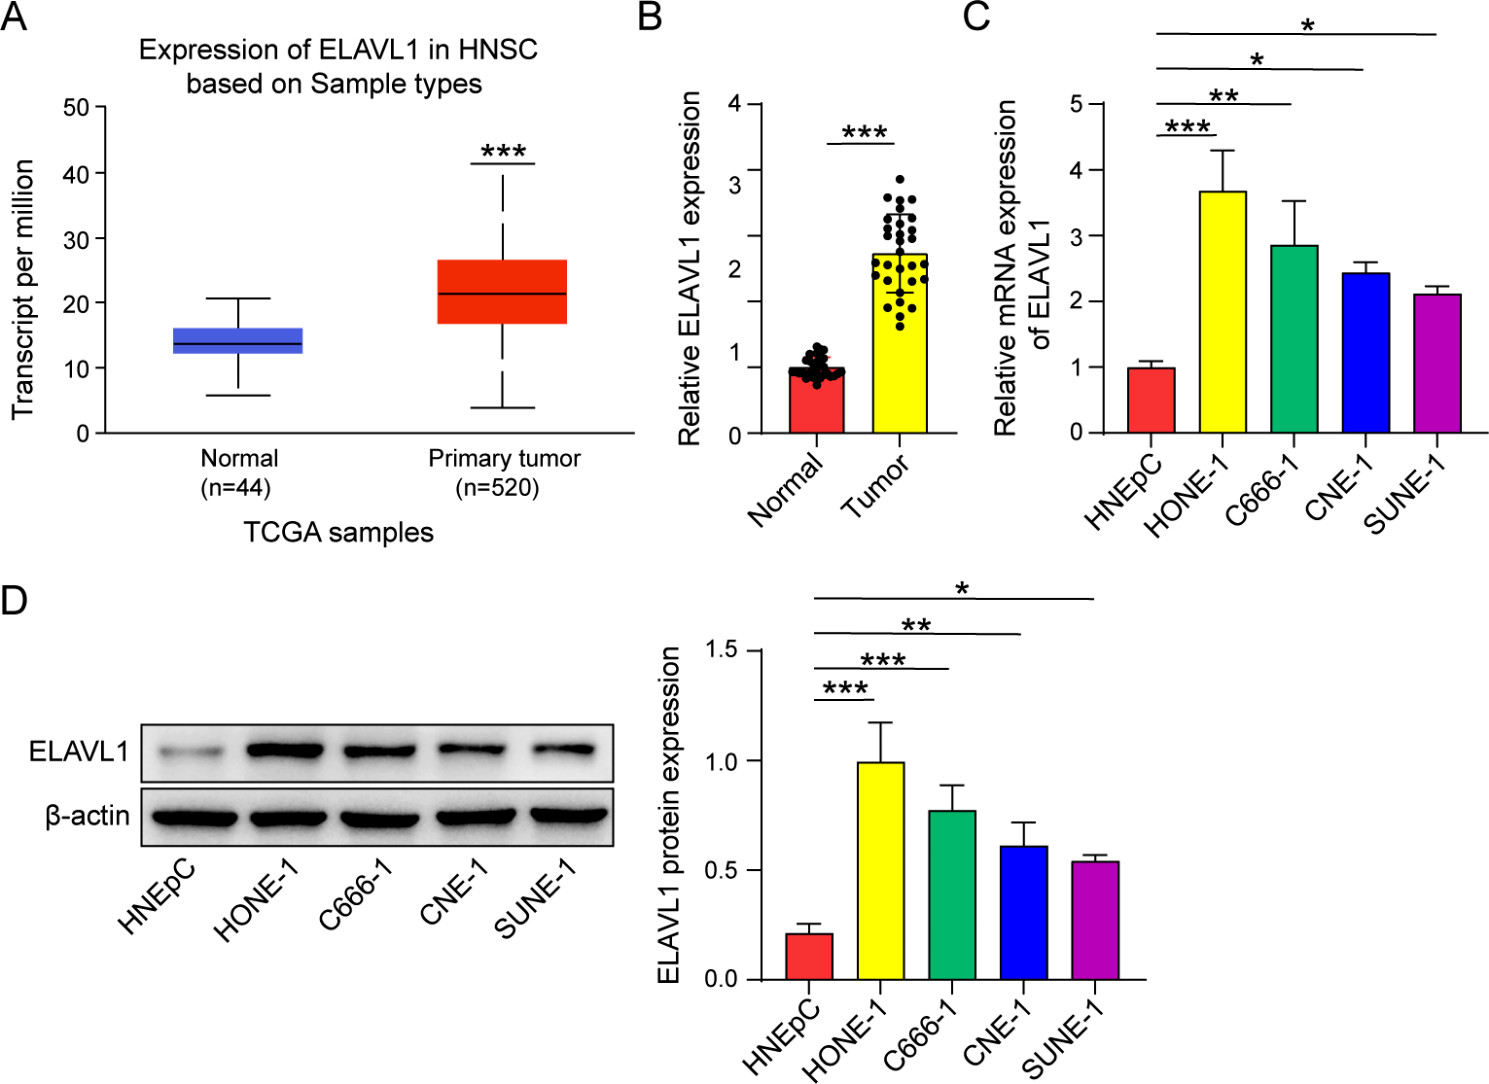
We used the UALCAN (https://ualcan.path.uab.edu/index.html) database to analyze the expression of ELAVL1, HMGB3 in head and neck squamous cell carcinoma, and the Encyclopedia of RNA Interactomes (ENCORI, http://starbase.sysu.edu.cn/) to predict the interaction of ELAVL1 with HMGB3 mRNA.
Human samples
We collected 30 pairs of nasopharyngeal carcinoma tissues and non-tumor nasopharyngeal epithelial tissues from patients who underwent surgery from June 2021 to March 2023. The fresh tissues were immediately preserved on ice, and RNA was then extracted for quantitative real-time polymerase chain reaction (qRT-PCR) analysis. This research was approved by the Ethics Committee of The First People’s Hospital of Chenzhou (Chenzhou, China), ensuring compliance with ethical standards for human research.
Cell culture and cell transfection
The experimental cell lines used in this study included human nasal epithelial cells (HNEpC) and human nasopharyngeal carcinoma cell lines (HONE-1, C666-1, CNE-1, and SUNE-1), which were obtained from Cell Bank, Chinese Academy of Sciences (Shanghai, China). These cells were cultured in Dulbecco’s Modified Eagle’s Medium (DMEM; Gibco, Grand Island, NY, USA) supplemented with 10% fetal bovine serum (FBS; Gibco) under standard conditions, including a 5% carbon dioxide atmosphere, 5% air, and a temperature of 37 ℃. To achieve stable knockdown of ELAVL1, cells were transfected with an ELAVL1-shRNA plasmid (RiboBio, Guangzhou, China) using Lipofectamine 3000 (Invitrogen, Carlsbad, CA, USA). Non-targeting shRNA constructs were used as negative controls. Following infection with the lentiviruses, the cells were subjected to puromycin selection (5 mg/mL, Invitrogen) to obtain a homogeneous population of infected cells. The efficiency of transfection and infection was evaluated using qRT-PCR and western blot techniques.
Xenograft animal model
The xenograft tumor model was established using four-week-old female BALB/c mice. Lentivirus-infected HONE-1 cells were injected subcutaneously into the dorsal region of BALB/c mice at 5 × 10⁶ cells per mouse. Tumor volume was measured once every week, and at the end of five weeks, the mice were euthanized, and the tumors were removed and measured. The tumor volume was calculated using the formula: tumor volume (mm3) = 1/2 × length × (width)2. The obtained tumor tissues were fixed in polyformaldehyde, embedded in paraffin, and sectioned for further analysis. The Laboratory Animal Ethics Committee of The First People’s Hospital of Chenzhou granted approval for all animal experiments, which were performed in strict accordance with the guidelines approved by the Medical Experimental Animal Management Committee.
qRT-PCR
Cells and tissues were subjected to total RNA extraction using Trizol reagent (Invitrogen), followed by reverse transcription of the extracted RNA into cDNA using the PrimeScript™ Kit (TaKaRa Bio Inc., Otsu, Tokyo, Japan). The synthesized cDNA was used as a template for qRT-PCR analysis using SYBR Green PCR Master Mix (YEASEN, Shanghai, China). Each group was set up with three technical replicates. The housekeeping gene GAPDH was used as an internal reference gene for normalization. To describe the relative mRNA expression in the experimental group, the 2−ΔΔCT method was employed. The primer sequences were listed as follows: ELAVL1, 5’-TGT TCT CTC GGT TTG GGC GGA T-3’ (forward), 5’-TCT TCT GCC TCC GAC CGT TTG T-3’ (reverse); HMGB3, 5’-CCA AGA AGT GCT CTG AGA GGT G-3’ (forward), 5’-CTT CTT GCC TCC CTT AGC TGG T-3’ (reverse); β-catenin, 5’-CACAAGCAGAGTGCTGAAGGTG-3’ (forward), 5’-GATTCCTGAGAGTCCAAAGACAG-3’ (reverse); GAPDH, 5’-GTC TCC TCT GAC TTC AAC AGC G-3’ (forward), 5’-ACC ACC CTG TTG CTG TAG CCA A-3’ (reverse).
Western blot
RIPA lysis buffer (Beyotime, Shanghai, China) containing protease inhibitors was used to lyse cells and obtain total proteins. Nuclear protein extraction was performed using a Qproteome Cell Compartment Kit (Qiagen, Duesseldorf, Germany). The protein samples were then added to sodium dodecyl sulfate (SDS) protein buffer, heated at 95℃ for 5 min to ensure complete denaturation of the proteins. The protein samples and markers were loaded into the sample wells of an SDS- polyacrylamide gel electrophoresis (PAGE) gel, followed by electrophoresis, transfer onto a polyvinylidene fluoride (PVDF) membrane (Millipore, Bellerica, MA, USA), and blocking with BSA. Specific primary antibody incubation was performed followed by incubation with secondary antibody sourced from the same species as the primary antibody. Visualization was achieved using an enhanced chemiluminescence (ECL) reagents (ABClonal, Wuhan, China), and the resulting bands on the developed image were subjected to gray scale calculation and statistical analysis using software such as ImageJ. β-actin was used as the control for the normalization of the data. The primary antibodies used in this study include ELAVL1 (1:1000, ab200342, Abcam, Cambridge, MA, USA), HMGB3 (1:5000, ab72544, Abcam), HK2 (1:1000, ab209847, Abcam), GLUT1 (1:200, ab150299, Abcam), lactate dehydrogenase (LDHA; 1:5000, ab52488, Abcam), β-actin (1:10000, ab227387, Abcam), β-catenin (1:5000, ab32572, Abcam), and Lamin B1 (1:2000, ab133741, Abcam).
Immunohistochemistry
After baking at 60℃ for one hour, tissue sections underwent deparaffinization with xylene and were subsequently rehydrated via a series of alcohol gradients with different concentrations. Antigen retrieval was performed in an EDTA solution at 95℃ for 20 min, and 10% goat serum was used to reduce non-specific background staining. Ki67 primary antibody (1:200, ab16667, Abcam) was applied and incubated overnight at 4℃, followed by incubation with a secondary antibody of the same species for 2 h. DAB (3,3’-diaminobenzidine) chromogen and hematoxylin staining were subsequently performed.
Measurements of glucose uptake, extracellular lactate secretion, and G6PD activity
The glucose uptake, extracellular lactate secretion, and G6PD activity in individual cell samples were detected using the Glucose Colorimetric Assay Kit (E-BC-K234-M, Elabscience, Wuhan, China), Lactate Colorimetric Assay Kit (E-BC-K044-M, Elabscience), and G6PDH Activity Assay Kit (E-EL-H1816c, Elabscience) according to the manufacturer’s instructions.
Seahorse analysis
The Seahorse XF Glycolysis Stress Test Kit (Agilent Technologies, Santa Clara, CA, USA) was used to measure Extracellular Acidification Rate (ECAR). The treated cells were seeded in a 96-well plate and cultured for 12 h, 36 h, and 60 h. Glucose (10 mM), oligomycin (1 µM), and 2-Deoxy-D-glucose (2-DG; 50 nM) were sequentially added during the experiment. The Seahorse XF Analyzer (Agilent Technologies) was utilized to dynamically and real-time measure extracellular acidification of the cells. The data was analyzed using Seahorse Wave software.
RNA pull-down assay
The detection of enriched protein-RNA interactions was accomplished using the Pierce™ Magnetic RNA-Protein Pull-Down Kit (Thermo Scientific™ in the USA). First, the cells were lysed using a lysis buffer to release the cellular proteins. Next, the lysate was incubated with a biotin-labeled HMGB3 RNA probe for a specified period of time to allow the probe to bind to the target protein. The mixture was then subjected to magnetic bead capture to isolate the protein complex bound to the RNA probe. Subsequently, the bound proteins were released from the RNA probe, using conditions such as heating or the addition of a protease. Finally, the quantification of ELAVL1 protein was performed by Western blot analysis to investigate the interaction between HMGB3 mRNA and ELAVL1 protein.
RNA immunoprecipitation (RIP) assay
First, cells were lysed using RIPA lysis buffer (MCE, CA, USA) and centrifuged to collect the supernatant. Concurrently, agarose beads (Thermo Scientific™, USA) were prepared and coated with ELAVL1 antibody or IgG control antibody. The lysate was then mixed with the beads for immunoprecipitation. Subsequently, magnetic beads were added with equal volume of Trizol to resuspend the mixture for RNA isolation. Finally, quantitative analysis was performed using qRT-PCR. The qRT-PCR results obtained from the ELAVL1 and IgG groups were normalized using the results from Input group. Subsequently, the fold changes of the ELAVL1 group in relation to the IgG group were calculated, referred to as relative HMGB3 enrichment.
RNA stability assay
Cells from different groups were treated with actinomycin D (5 µg/mL) and collected at 0 h, 3 h, and 6 h time points. Total RNA was extracted from the collected cells and reverse transcribed to synthesize cDNA. The levels of HMGB3 mRNA were then quantitatively detected using qRT-PCR.
Dual luciferase reporter assay
The activity of β-catenin pathway was detected using dual luciferase reporter with TOPFlash (D2501, Beyotime) and FOPFlash (D2503, Beyotime) plasmids. Each group of cells was distributed into separate wells of a 24-well plate and subjected to transfection with either TOPFlash or FOPFlash for a duration of 24 h. After transfection, cells were incubated with LiCl for 24 h, and the relative luciferase activity was determined using a dual luciferase reporter kit (RG027, Beyotime).
Statistical analysis
The data were expressed as the mean ± standard deviation (SD) derived from three independent repetitions. One-Way ANOVA followed by the post-comparison of Tukey’s Honestly Significant Difference test (for multiple groups) or Student’s t-test (for two groups) was used to analyze the significant difference. The correlation between variables was assessed using Pearson analysis. Statistical analysis was conducted with SPSS 22.0. Statistical significance was determined by a p value of less than 0.05.


留言 (0)