
記住我


In the face of microbial and abiotic threats, plants have evolved a variety of defense mechanisms, with Induced Systemic Resistance (ISR) playing a pivotal role (Pieterse et al., 1998; Doornbos et al., 2011; Rania et al., 2017; Sahebani and Omranzade, 2020; Saxena et al., 2020). ISR is not an immediate reaction but a sensitization process that prepares plants for rapid and robust responses to potential threats. Key players in ISR include various Bacillus species, which as plant endophytes can trigger ISR when they reach a certain population density within the host (Beneduzi et al., 2012; Pieterse et al., 2014; Wu et al., 2018). The effectiveness of ISR induction by Bacillus strains, however, varies, depending on the application method and treatment intervals (Zhang et al., 2002). Bacillus spp. and their metabolites enhance plant defenses by stimulating pathogenesis-related (PR) protein genes and defense-related enzymes (Ali et al., 2022; Chouhan et al., 2023). For instance, Bacillus amyloliquefaciens Ba13 increased resistance to tomato yellow leaf curl virus by altering the microbial structure of the rhizosphere (Guo et al., 2019). Similarly, a study by Fu et al. (2020) revealed that foliar application of an endophytic Bacillus strain controlled tomato bacterial wilt by upregulating PR-1a and LoxD genes. Additionally, Rania et al. (2017) found that Bacillus spp. from wild Solanaceous species upregulate PR and lipoxygenase genes in tomatoes, enhancing resistance to Fusarium oxysporum. B. velezensis S3-1 boosts wilt resistance in pepper plants through the upregulation of defense genes CaPR1 and CaPIN II (Fan et al., 2023b). The molecular basis of ISR involves specific signal transduction pathways, predominantly those governed by plant hormones such as jasmonic acid (JA) and ethylene (ET) (Pieterse et al., 1998; Hossain et al., 2017; Nie et al., 2017; Romera et al., 2019). A prime example is the Bacillus licheniformis strain CH102, which boosts the host plant’s JA pathway, thereby enhancing resistance to fungal pathogens (Sukkasem et al., 2018). B. amyloliquefaciens YN201732 induces systemic resistance in tobacco against powdery mildew, evidenced by activation of the JA/ET signaling pathway (Jiao et al., 2020). Similarly, brief exposure to volatile compounds from B. subtilis GB03 and B. amyloliquefaciens IN937a has been shown to activate ISR in Arabidopsis thaliana, primarily via the ET pathway and independent of the salicylic (SA) and JA pathways (Ryu et al., 2004). Further, Bacillus species are known to modulate host plant enzyme activities and related pathways to fortify plant defenses. For instance, B. licheniformis W10 has been found to regulate ROS levels and activate defense-related enzymes, thereby bolstering resistance against brown rot (Ji et al., 2020). Bacillus cereus-Amazcala (B.c-A) is another example, known for stimulating CAT and PAL activities in pepper plants, leading to enhanced immune responses (Ferrusquía-Jiménez et al., 2022). Crucially, Samaniego-Gámez et al. (2021) have shown that inoculation with specific Bacillus spp. can boost photosynthetic efficiency and ISR in Capsicum chinense plants, offering protection against pepper golden mosaic virus and improving plant health and fruit yield. Similarly, Chen et al. (2009) discovered that B. amyloliquefaciens-derived elicitors can induce resistance to various pathogens in soybean and tomato plants through multiple defense signaling pathways, with surfactin and Fengycin playing significant roles as inducers. In conclusion, Bacillus, as an endophytic bacterium, plays a vital role in stimulating plant innate immunity and reinforcing defense mechanisms against pathogens.
Walnut was a valuable agricultural commodity, but its production was threatened by walnut anthracnose, primarily caused by C. gloeosporioides (Wang et al., 2020; Fang et al., 2021; Feng et al., 2021). This disease disrupted the growth and reduced the economic value of walnut trees. Biological management offered a sustainable solution that protected ecosystems and human health while effectively controlling this pathogen (He et al., 2021). Bacillus spp., notably B. velezensis, serve as key agents in biocontrol, effectively mitigating numerous fungal infections (Wang et al., 2023, 2024; Wei et al., 2023; Armenova et al., 2024; Fessia et al., 2024; Russi et al., 2024). Esteemed for its biocontrol proficiency, B. velezensis has become a focal point of research due to its capacity to combat diverse diseases including tomato early blight, maize leaf blight, and pepper anthracnose (da Silva Junior et al., 2023; Rahman et al., 2023; Zhou et al., 2023). Additionally, it plays a crucial role in fostering the growth of crops such as cotton, rice, and tomatoes (Balderas-Ruíz et al., 2021; Do et al., 2023; Tang et al., 2023). In our previous research, we discovered that B. velezensis exhibits a significant antagonistic effect against C. gloeosporioides. This interaction was demonstrated by a notable reduction in the area of lesions caused by C. gloeosporioides on detached walnut leaves (Wang and Zhu, 2023). In this research, pot experiments were conducted to evaluate the effects of inoculating B. velezensis at various time points on the control of walnut anthracnose. To elucidate the mechanisms of ISR in walnut plants mediated by B. velezensis, transcriptomic and metabolomic analyses of walnut leaves were performed. These analyses detailed how B. velezensis regulates gene expression and influences metabolic pathways and the secretion of resistance compounds, providing a theoretical basis for its future production and development.
2 Materials and methods 2.1 Setup of walnut potted plant experimentWalnut plants used in this study were 5-year-old trees of the “Xiangling” variety, grown at the Chengdu academy of agriculture and forestry sciences in Chengdu, Sichuan province, China, located at coordinates 104.07275 longitude, 30.57899 latitude, and an elevation of 534 meters. The experimental design consisted of six distinct groups to assess the interactions and effects of B. velezensis and C. gloeosporioides on walnut plants. Group B.v. received inoculation with B. velezensis alone, while Group CK served as the blank control. Group C.g. was inoculated solely with C. gloeosporioides, while Group B.v.−C.g. received B. velezensis followed by C. gloeosporioides. Group B.v.+C.g. was subjected to simultaneous inoculation with B. velezensis and C. gloeosporioides, while Group C.g.−B.v. was inoculated with C. gloeosporioides followed by B. velezensis. Each group comprised 15 walnut trees, totaling 90 trees. These trees had an average height of 1.1 meters, with no significant difference in trunk diameter. The selected walnut plants were uniform in size and closely matched in growth height to ensure uniform physiological states and growth stages across all groups at the start of the experiment. Transparent plastic film was used to isolate each group of walnut trees, thereby preventing cross-contamination and ensuring the accuracy and reliability of the experiment. However, it should be noted that this experimental setup did not employ a randomized block design.
To prepare the spore suspension of C. gloeosporioides (preserved at the laboratory of forest protection, college of forestry, Sichuan agricultural university), C. gloeosporioides cakes were inoculated onto PDA solid medium and then incubated at a constant temperature of 28°C for 10 days. The surface of the culture medium was repeatedly washed with sterile water to evenly disperse the conidia in the water. The resulting conidial suspension was filtered through double-layer gauze and counted under an optical microscope using a hemocytometer to adjust the concentration to 1 × 10⁶ spores/mL. Following the protocol outlined by Wang and Zhu (2023), a 100-fold concentrated fermentation liquid of B. velezensis (preserved at the Laboratory of Forest Protection, College of Forestry, Sichuan Agricultural University) was prepared and administered to the designated groups of walnut plants every 3 days via spraying and root irrigation. Each tree received 500 mL of the solution at the root. The spray was applied uniformly on the leaves and stems of the walnut plants with consistent spray pressure and droplet size, ensuring the liquid covered the plant surfaces without dripping. Detailed treatment methods and scheduling are provided in Supplementary Table 1.
Following the inoculation with C. gloeosporioides, regular observations were conducted every 15 days, starting from day 15, for a total of four observations. Based on the observation results, disease incidence was recorded, and the disease incidence rate as well as the relative control efficacy of B. velezensis against C. gloeosporioides were calculated. To ensure data reliability, each group of walnut plants was randomly numbered, with five walnut plants forming one replicate, and three replicates in total.
Formula (1): Disease incidence rate
Diseaseincidencerate(%)=(NdNt)×100(1)
Nd: Number of diseased plants; Nt: Total number of inoculated plants.
Formula (2): Relative control effect
Relativecontroleffect(%)=(Ic-ItIc)×100(2)
Ic: Disease index of control; It: Disease index of treatment.
On the 40th day of the pot experiment, six walnut trees were randomly selected from each treatment group to collect uniform-sized leaves from the same positions for metabolomic analysis, with six replicates per treatment group. The leaves were immediately labeled and flash-frozen in liquid nitrogen for storage. Non-targeted metabolomics techniques were utilized for the metabolomic analysis.
2.2 Untargeted metabolomics 2.2.1 Sample preparation for UHPLC-MS/MSTissues (100 mg) were individually grounded with liquid nitrogen and the homogenate was resuspended with prechilled 80% methanol by well vortex. The samples were incubated on ice for 5 min and then were centrifuged at 15,000 g, 4°C for 20 min. Some of supernatant was diluted to final concentration containing 53% methanol by LC-MS grade water. The samples were subsequently transferred to a fresh Eppendorf tube and then were centrifuged at 15,000 g, 4°C for 20 min. Finally, the supernatant was injected into the LC-MS/MS system analysis (Want et al., 2013).
2.2.2 UHPLC-MS/MS analysisUHPLC-MS/MS analyses were performed using a Vanquish UHPLC system (Thermo Fisher, Germany) coupled with an Orbitrap Q Exactive™ HF mass spectrometer (Thermo Fisher, Germany) in Novogene Co., Ltd (Beijing, China). Samples were injected onto a Hypesil Gold column (100 × 2.1 mm, 1.9 μm) using a 12-min linear gradient at a flow rate of 0.2 mL/min. The eluents for the positive polarity mode were eluent A (0.1% FA in Water) and eluent B (Methanol). The eluents for the negative polarity mode were eluent A (5 mM ammonium acetate, pH 9.0) and eluent B(Methanol). The solvent gradient was set as follows: 2% B, 1.5 min; 2–85% B, 3 min; 85–100% B, 10 min;100–2% B, 10.1 min;2% B, 12 min. Q Exactive™ HF mass spectrometer was operated in positive/negative polarity mode with spray voltage of 3.5 kV, capillary temperature of 320°C, sheath gas flow rate of 35 psi and aux gas flow rate of 10 L/min, S-lens RF level of 60, Aux gas heater temperature of 350°C.
2.2.3 Data processing and metabolite identificationThe raw data files generated by UHPLC-MS/MS were processed using the Compound Discoverer 3.1 (CD3.1, Thermo Fisher) to perform peak alignment, peak picking, and quantitation for each metabolite. Subsequently, peak alignment across different samples was performed using a retention time deviation of 0.2 min and a mass deviation of 5 ppm to enhance identification accuracy. Following this, peak extraction was conducted with criteria including a mass deviation of 5 ppm, signal intensity deviation of 30%, signal-to-noise ratio of 3, minimum signal intensity, and summation of ion intensities. Quantification was carried out based on peak areas, integrating target ions. Molecular formula prediction utilized molecular and fragment ions, comparing results against the mzCloud, mzVault, and Masslist databases. Background ions were removed using blank samples, and raw quantitative results were subsequently standardized. Finally, metabolite identification and relative quantification results were obtained. Data processing was conducted using the Linux operating system (CentOS version 6.6) and software such as R(R version R-3.4.3) and Python (Python 2.7.6 version). When data were not normally distributed, normal transformations were attempted using of area normalization method.
2.2.4 Data analysisThese metabolites were annotated using the KEGG database, HMDB database and LIPIDMaps database. Principal components analysis (PCA) and Partial least squares discriminant analysis (PLS-DA) were performed at metaX (Wen et al., 2017) (a flexible and comprehensive software for processing metabolomics data). We applied univariate analysis (t-test) to calculate the statistical significance (P-value). The metabolites with VIP > 1 and P-value < 0.05 and fold change ≥ 2 or FC ≤ 0.5 were considered to be differential abundance metabolites. Volcano plots were used to filter metabolites of interest which based on log2(FoldChange) and -log10(p-value) of metabolites by ggplot2 in R language. For clustering heat maps, the data were normalized using z-scores of the intensity areas of differential abundance metabolites and were ploted by Pheatmap package in R language. The correlation between differential abundance metabolites were analyzed by cor () in R language (method = pearson). Statistically significant of correlation between differential abundance metabolites were calculated by cor.mtest() in R language. P-value < 0.05 was considered as statistically significant and correlation plots were ploted by corrplot package in R language. The functions of these metabolites and metabolic pathways were studied using the KEGG database. The metabolic pathways enrichment of differential abundance metabolites was performed, when ratio was satisfied by x/n > y/N, metabolic pathway was considered as enrichment, when P-value of metabolic pathway < 0.05, metabolic pathway was considered as statistically significant enrichment.
2.3 Transcriptome sequencing methods 2.3.1 Procedures for RNA extraction, sequencing library construction, and sequencingTotal RNA was extracted from walnut leaves using TRIzol Reagent (Invitrogen, cat. no. 15596026) as per the protocol described by Chomczynski and Sacchi (1987). Post-extraction, the RNA samples were treated with DNase I to remove any contaminating DNA. The purity and quality of the extracted RNA were assessed using the Nanodrop™ OneC spectrophotometer (Thermo Fisher Scientific Inc.), focusing on the A260/A280 absorbance ratio. Additionally, RNA integrity was verified through 1.5% agarose gel electrophoresis. Quantification of the RNA was performed using the Qubit™ 3.0 Fluorometer with the RNA Broad Range Assay kit (Life Technologies, cat. no. Q10210). For the library construction, 2 μg of total RNA was used to prepare stranded RNA sequencing libraries using the KC-Digital™ Stranded mRNA Library Prep Kit for Illumina® (Catalog NO. DR08502, Wuhan Seqhealth Co., Ltd., China). This kit incorporates a unique molecular identifier (UMI) of 8 random bases to minimize duplication bias during PCR amplification and sequencing. Following the manufacturer’s instructions, the library fragments ranging from 200 to 500 bps were enriched and quantified. The final library was sequenced on an Illumina NovaSeq 6000 system using the PE150 configuration.
2.3.2 Quality control and data analysisThe raw sequencing data was initially processed using Trimmomatic (version 0.36) to filter out low-quality reads and trim adaptor-contaminated sequences. Subsequently, an in-house script was employed to address duplication bias inherent in the library preparation and sequencing steps. Specifically, clean reads were clustered based on their unique molecular identifier (UMI) sequences. Within each cluster, reads sharing the same UMI sequence were aligned pairwise, and those with sequence identity exceeding 95% were grouped into a new sub-cluster. Multiple sequence alignments within these sub-clusters facilitated the generation of a single consensus sequence per sub-cluster, effectively mitigating errors and biases introduced during PCR amplification and sequencing. These de-duplicated consensus sequences were then utilized for standard RNA-seq analysis. Mapping to the reference genome was performed using the STAR software (version 2.5.3a) with default settings. The reference genome for Juglans regia was sourced from the National Center for Biotechnology Information (NCBI) under BioProject ID PRJNA291087. Read counts corresponding to the exon regions of each gene were obtained using featureCounts (Subread-1.5.1; Bioconductor), and the relative expression levels were quantified as Reads Per Kilobase of transcript, per Million mapped reads (RPKM). Differential gene expression analysis between the groups was conducted using the edgeR package (version 3.12.1). Statistical significance was determined using a p-value cutoff of 0.05 and a fold-change threshold of 2, enabling the identification of genes with significant expression differences.
2.4 Metabolomic and transcriptomic association analysisThe transcriptomic and metabolomic analyses included four groups: Group B.v., inoculated solely with B. velezensis; Group CK, serving as the blank control; Group C.g., inoculated solely with C. gloeosporioides; and Group C.g.−B.v., where inoculation with C. gloeosporioides was followed by B. velezensis. The transcriptomic data has been uploaded to the NCBI database under accession number PRJNA1030780. To ensure data comparability and accuracy, a standardized sample collection method was employed, with specific timing and methods outlined in Section “2.1 Setup of walnut potted plant experiment.” Samples for both transcriptomic and metabolomic analyses were obtained from the same batch of walnut plants’ corresponding leaves, establishing a one-to-one correspondence. This approach aimed to minimize the impact of plant variations and environmental factors on the experimental results, thereby ensuring that the analysis accurately reflects the true relationship between gene expression and metabolite production. Metabolomic and transcriptomic KEGG enrichment analyses were conducted based on the same comparisons. By aligning the results, KEGG pathways enriched in both metabolomic and transcriptomic analyses were identified. Subsequently, a bubble plot illustrating the co-enriched pathways in metabolism and transcription was generated using the ggplot2 package in R language. This visualization method aids in comprehensively presenting the shared enriched pathways between metabolism and transcription.
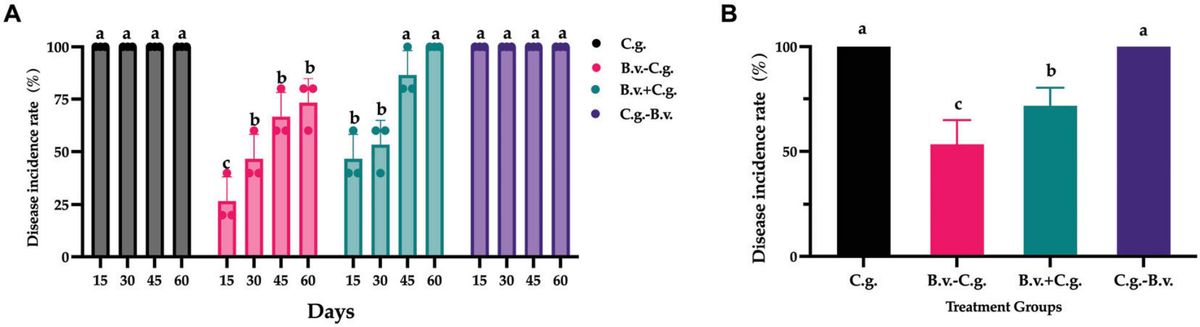
3 Results 3.1 The Effect of B. velezensis application at different stages on anthracnose disease in potted walnut plantsBased on observations and records at four time points, a statistical analysis of the incidence rate was conducted. The analysis results (Figure 1A) showed that by day 15, all walnut plants in groups C.g. and C.g.−B.v. exhibited disease symptoms, reaching an incidence rate of 100%. The incidence rates for treatment groups B.v.−C.g. and B.v.+C.g. gradually increased over time. By day 60, all walnut plants in group B.v.+C.g. showed disease symptoms, with an incidence rate of 100%, while the incidence rate for group B.v.−C.g. was 73.333%. The results preliminarily suggested an upward trend in the incidence rates of walnut plants following different treatments. However, to determine the statistical significance of this trend, a repeated measures analysis of variance (ANOVA) was required. The data passed the Levene’s test for homogeneity of variances, meeting the prerequisites for variance homogeneity, allowing for the selection of a repeated measures ANOVA to study the significance of changes in incidence rates. However, the data failed the sphericity test (P = 0.02 < 0.05), indicating asymmetry, thus the results of the multivariate tests were considered. According to the multivariate results, the time effect of Roy’s largest root was significant (F(4,17) = 765.722, P < 0.05), indicating significant changes in the incidence rates of walnut plants over time. The time*treatment interaction effect of Roy’s largest root was also significant [F(4,19) = 113.605, P < 0.05], suggesting an interaction effect between time points and treatment methods. Further repeated measures statistical analysis (Figure 1B) revealed that groups C.g. and C.g.−B.v. had the highest incidence rates, showing significant differences from the other two treatment groups. Group B.v.−C.g. had the lowest incidence rate, also significantly differing from the other three groups. For the three groups treated with B. velezensis, the incidence rates progressively increased from group B.v.−C.g. to group C.g.−B.v. The experimental results indicated that treating diseased walnut plants with B. velezensis at different stages significantly affected incidence rates of walnut plants. Notably, groups B.v.−C.g. and B.v.+C.g. successfully reduced the incidence rates of walnut plants to varying degrees.

Figure 1. Statistical analysis results of disease incidence rates in different treatment groups. (A) Incidence rate statistical analysis results for three different groups across four distinct time points. Data were collected from 4 time points and 4 treatment groups. Analysis was conducted using one-way ANOVA and Duncan’s multiple range test in SPSS 16.0. The values depicted in the figure represent the average from three replicate experiments. Different lowercase letters indicate significant differences in incidence rates between treatments at the same time point (P < 0.05). (B) Estimated marginal mean values of incidence rates for different groups at various time points. Different letters signify significant differences between treatments based on repeated measures ANOVA (P < 0.05). Group C.g.: solely inoculated with C. gloeosporioides; Group B.v.–C.g.: B. velezensis first, then C. gloeosporioides; Group B.v.+C.g.: simultaneous inoculation; Group C.g.–B.v.: C. gloeosporioides first, then B. velezensis.
The analysis of relative control effect (Figure 2A) revealed that groups B.v.−C.g., B.v.+C.g., and C.g.−B.v. demonstrated varying levels of disease control across the four observed time points, ranging from 22.00 to 87.50%. Among them, group B.v.−C.g. exhibited the best relative control effect, followed by group B.v.+C.g. Further statistical analysis on the population quantity of B. velezensis was conducted using the repeated measures analysis of variance (ANOVA) method. The data passed Levene’s test for homogeneity of variances, indicating that the study’s data met the prerequisites for homogeneity of variance, thus allowing the selection of a repeated measures ANOVA to study the significance of the trends in relative control effect. The data also passed the sphericity test (P = 0.425 > 0.05), indicating symmetry, hence the results were based on within-subject effects. According to the within-subject effects test results, the time effect was significant [F(1,3) = 10.857, P < 0.05], meaning there was a significant change in control effectiveness over time. The interaction effect between time points and treatment methods was also significant [F(3,9) = 29.828, P < 0.05], suggesting an interaction between time points and treatment methods. Further analysis of the repeated measures statistics (Figure 2B) showed that the three treatment groups exhibited different levels of relative control effect. Group C.g. achieved the best relative control effect, reaching 80.454%, which was more than twice that of group C.g.−B.v. The relative control effect of group C.g.−B.v. was lower, but its mean value also reached 34.512%. The comprehensive results indicated that treating walnut plants with B. velezensis at different time points improved relative control effect, particularly notable in groups B.v.−C.g. and B.v.+C.g., which showed commendable outcomes.
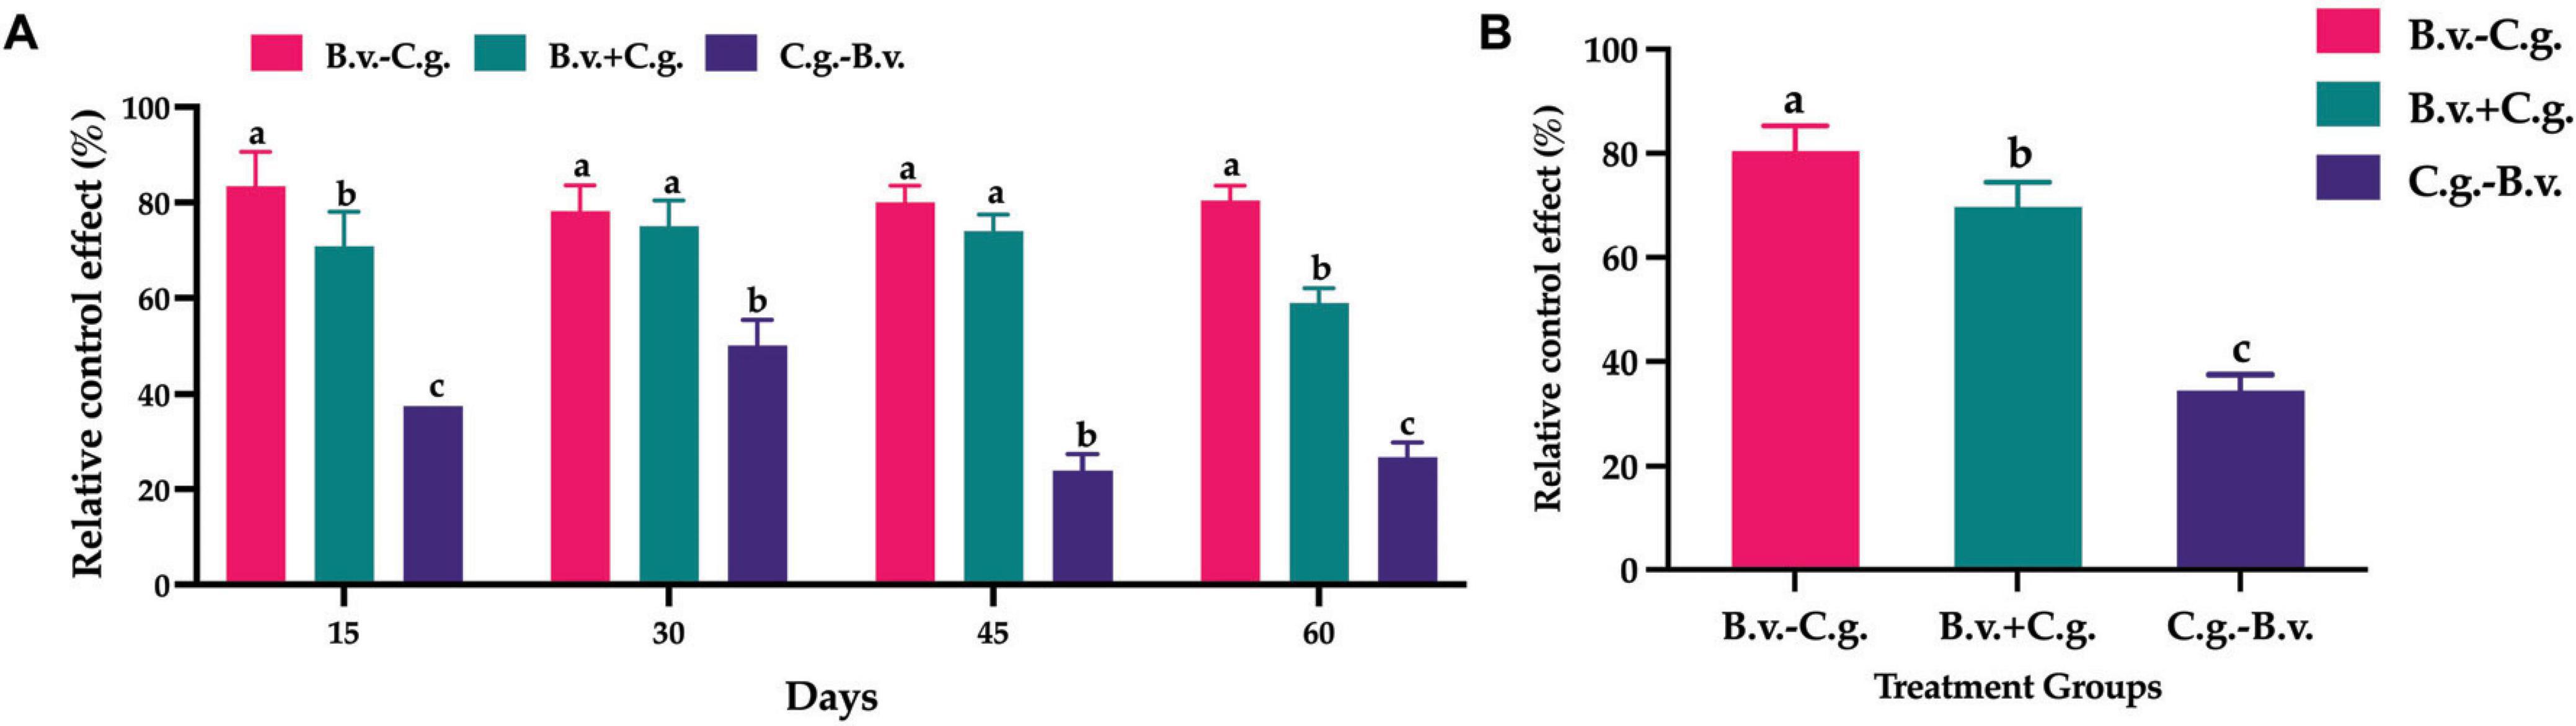
Figure 2. Statistical analysis of relative control effect among different treatment groups. (A) Relative control effect at four time points across three treatments, analyzed using one-way ANOVA and Duncan’s multiple range test (SPSS 16.0). The values in the figure represent the means of three repeated experiments, with different lowercase letters indicating significant differences in relative control effect among different treatment groups at the same time point (P < 0.05). Group B.v.–C.g.: B. velezensis first, then C. gloeosporioides; Group B.v.+C.g.: simultaneous inoculation; Group C.g.–B.v.: C. gloeosporioides first, then B. velezensis. (B) Estimated marginal means of relative control effect at different time points among different treatment groups. Different letters indicate significant differences (P < 0.05) based on repeated measures ANOVA.
3.2 Metabolome data analysis 3.2.1 Data quality controlThe metabolomics data have been uploaded to the MetaboLights platform with the accession number MTBLS10608. The Pearson correlation coefficient between QC samples was calculated based on the relative quantitative values of metabolites (Rao et al., 2016). It can be seen from the results (Supplementary Figures 1 A, B) that the correlation of QC samples is high (close to 1), indicating that the whole detection process has good stability and high data quality. The PCA analysis of walnut leaf metabolites (Supplementary Figures 1 C, D) showed clear separation among the treatment groups. In the negative ion mode, PC1 and PC2 accounted for 13.08 and 11.54% of the variance, respectively. In the positive ion mode, PC1 and PC2 explained 14.45 and 9.68% of the variance. The tight clustering of QC samples indicated high data reliability.
3.2.2 Metabolite pathway and classification annotationAccording to the Human Metabolome Database (HMDB) in the neg and pos modes (Figures 3A, B), 86 and 83 metabolites correspond to phenylpropanoids and polyketides, 48 and 132 metabolites correspond to lipids and lipid-like molecules, 50 and 44 metabolites correspond to organic oxygen compounds, 31 and 63 metabolites correspond to organic acids and derivatives, and 25 and 77 metabolites correspond to organoheterocyclic compounds. The metabolites identified by the secondary profiles were subjected to the KEGG website for metabolic pathway analysis. In the neg and pos modes (Figures 3C, D), most metabolites were mainly annotated to the global and overview maps, carbohydrate metabolism, biosynthesis of other secondary metabolites and amino acid metabolism. LIPID MAPS annotation was performed on the identified metabolites, and the results showed that in the neg and pos modes (Figures 3E, F), the metabolites were mainly enriched in flavonoids, isoprenoids and steroids. Of these, 48 and 36 metabolites correspond to flavonoids, 6 and 21 metabolites correspond to isoprenoids.
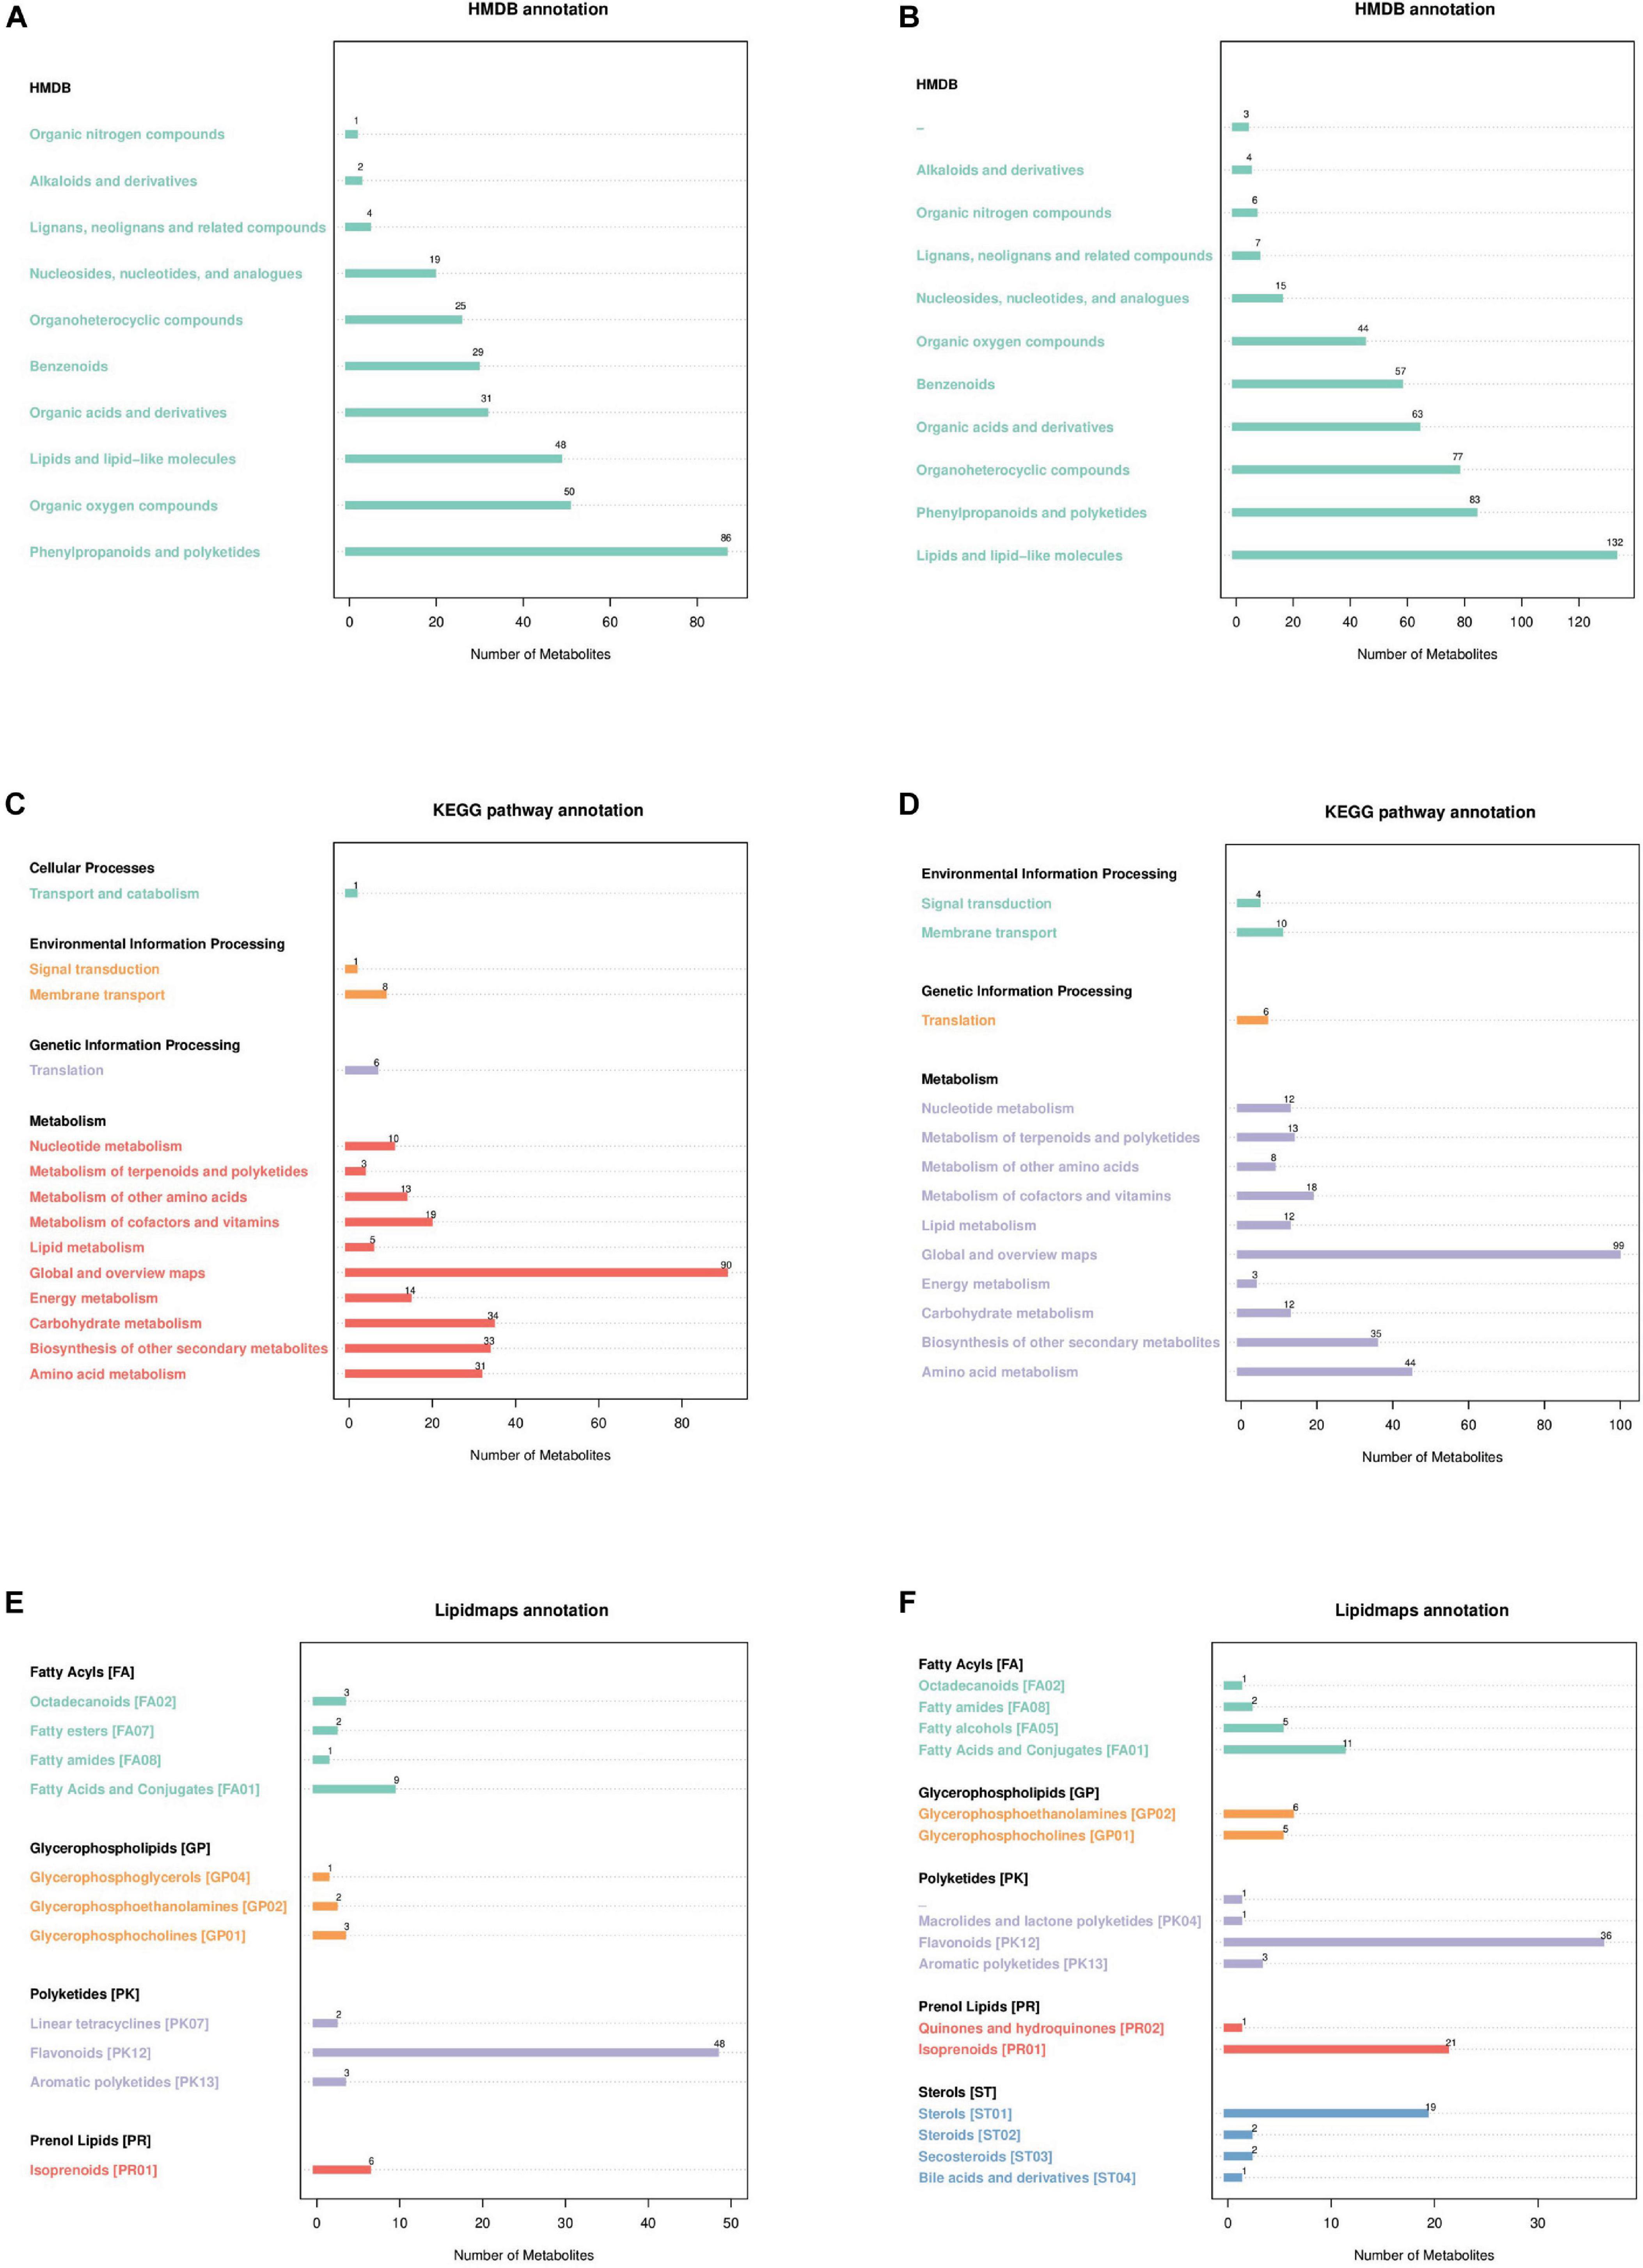
Figure 3. Annotated diagram of metabolite pathway and classification. (A,B) Annotated HMDB taxonomic map of metabolites. (C,D) Annotated map of the KEGG pathway of metabolites. (E,F) Annotated map of LIPID MAPS classification of metabolites.
3.2.3 Analysis of differential metabolite expressionVolcano plots visually demonstrate the distribution of differential abundance metabolites. The study analyzed six comparison groups: B.v. vs. CK, C.g. vs. CK, B.v.−C.g. vs. C.g., B.v.+C.g. vs. C.g., C.g.−B.v. vs. C.g., and B.v.−C.g. vs. CK (Figure 4). In positive and negative modes, the comparison groups with the highest total numbers of differential abundance metabolites were B.v.−C.g. vs. C.g. (244 and 112), C.g. vs. CK (160 and 84), and E. vs. C (132 and 86), respectively. The groups with the lowest totals were B.v. vs. CK (27 and 32), C.g.−B.v. vs. C.g. (83 and 40), and B.v.−C.g. vs. CK (72 and 55). These results indicate that the B.v. vs. CK group had the fewest differential abundance metabolites in both modes, suggesting a minimal impact of B. velezensis application alone on walnut plant metabolism. Furthermore, the B.v.−C.g. vs. C.g. group showed significantly more differential abundance metabolites than C.g. vs. CK, indicating the highest change in metabolite abundance. This suggests that C. gloeosporioides infection caused significant metabolic changes in walnut plants, and B. velezensis application further enhanced this effect, leading to an increase in differential abundance metabolites. This could potentially aid the host walnut in resisting C. gloeosporioides invasion.
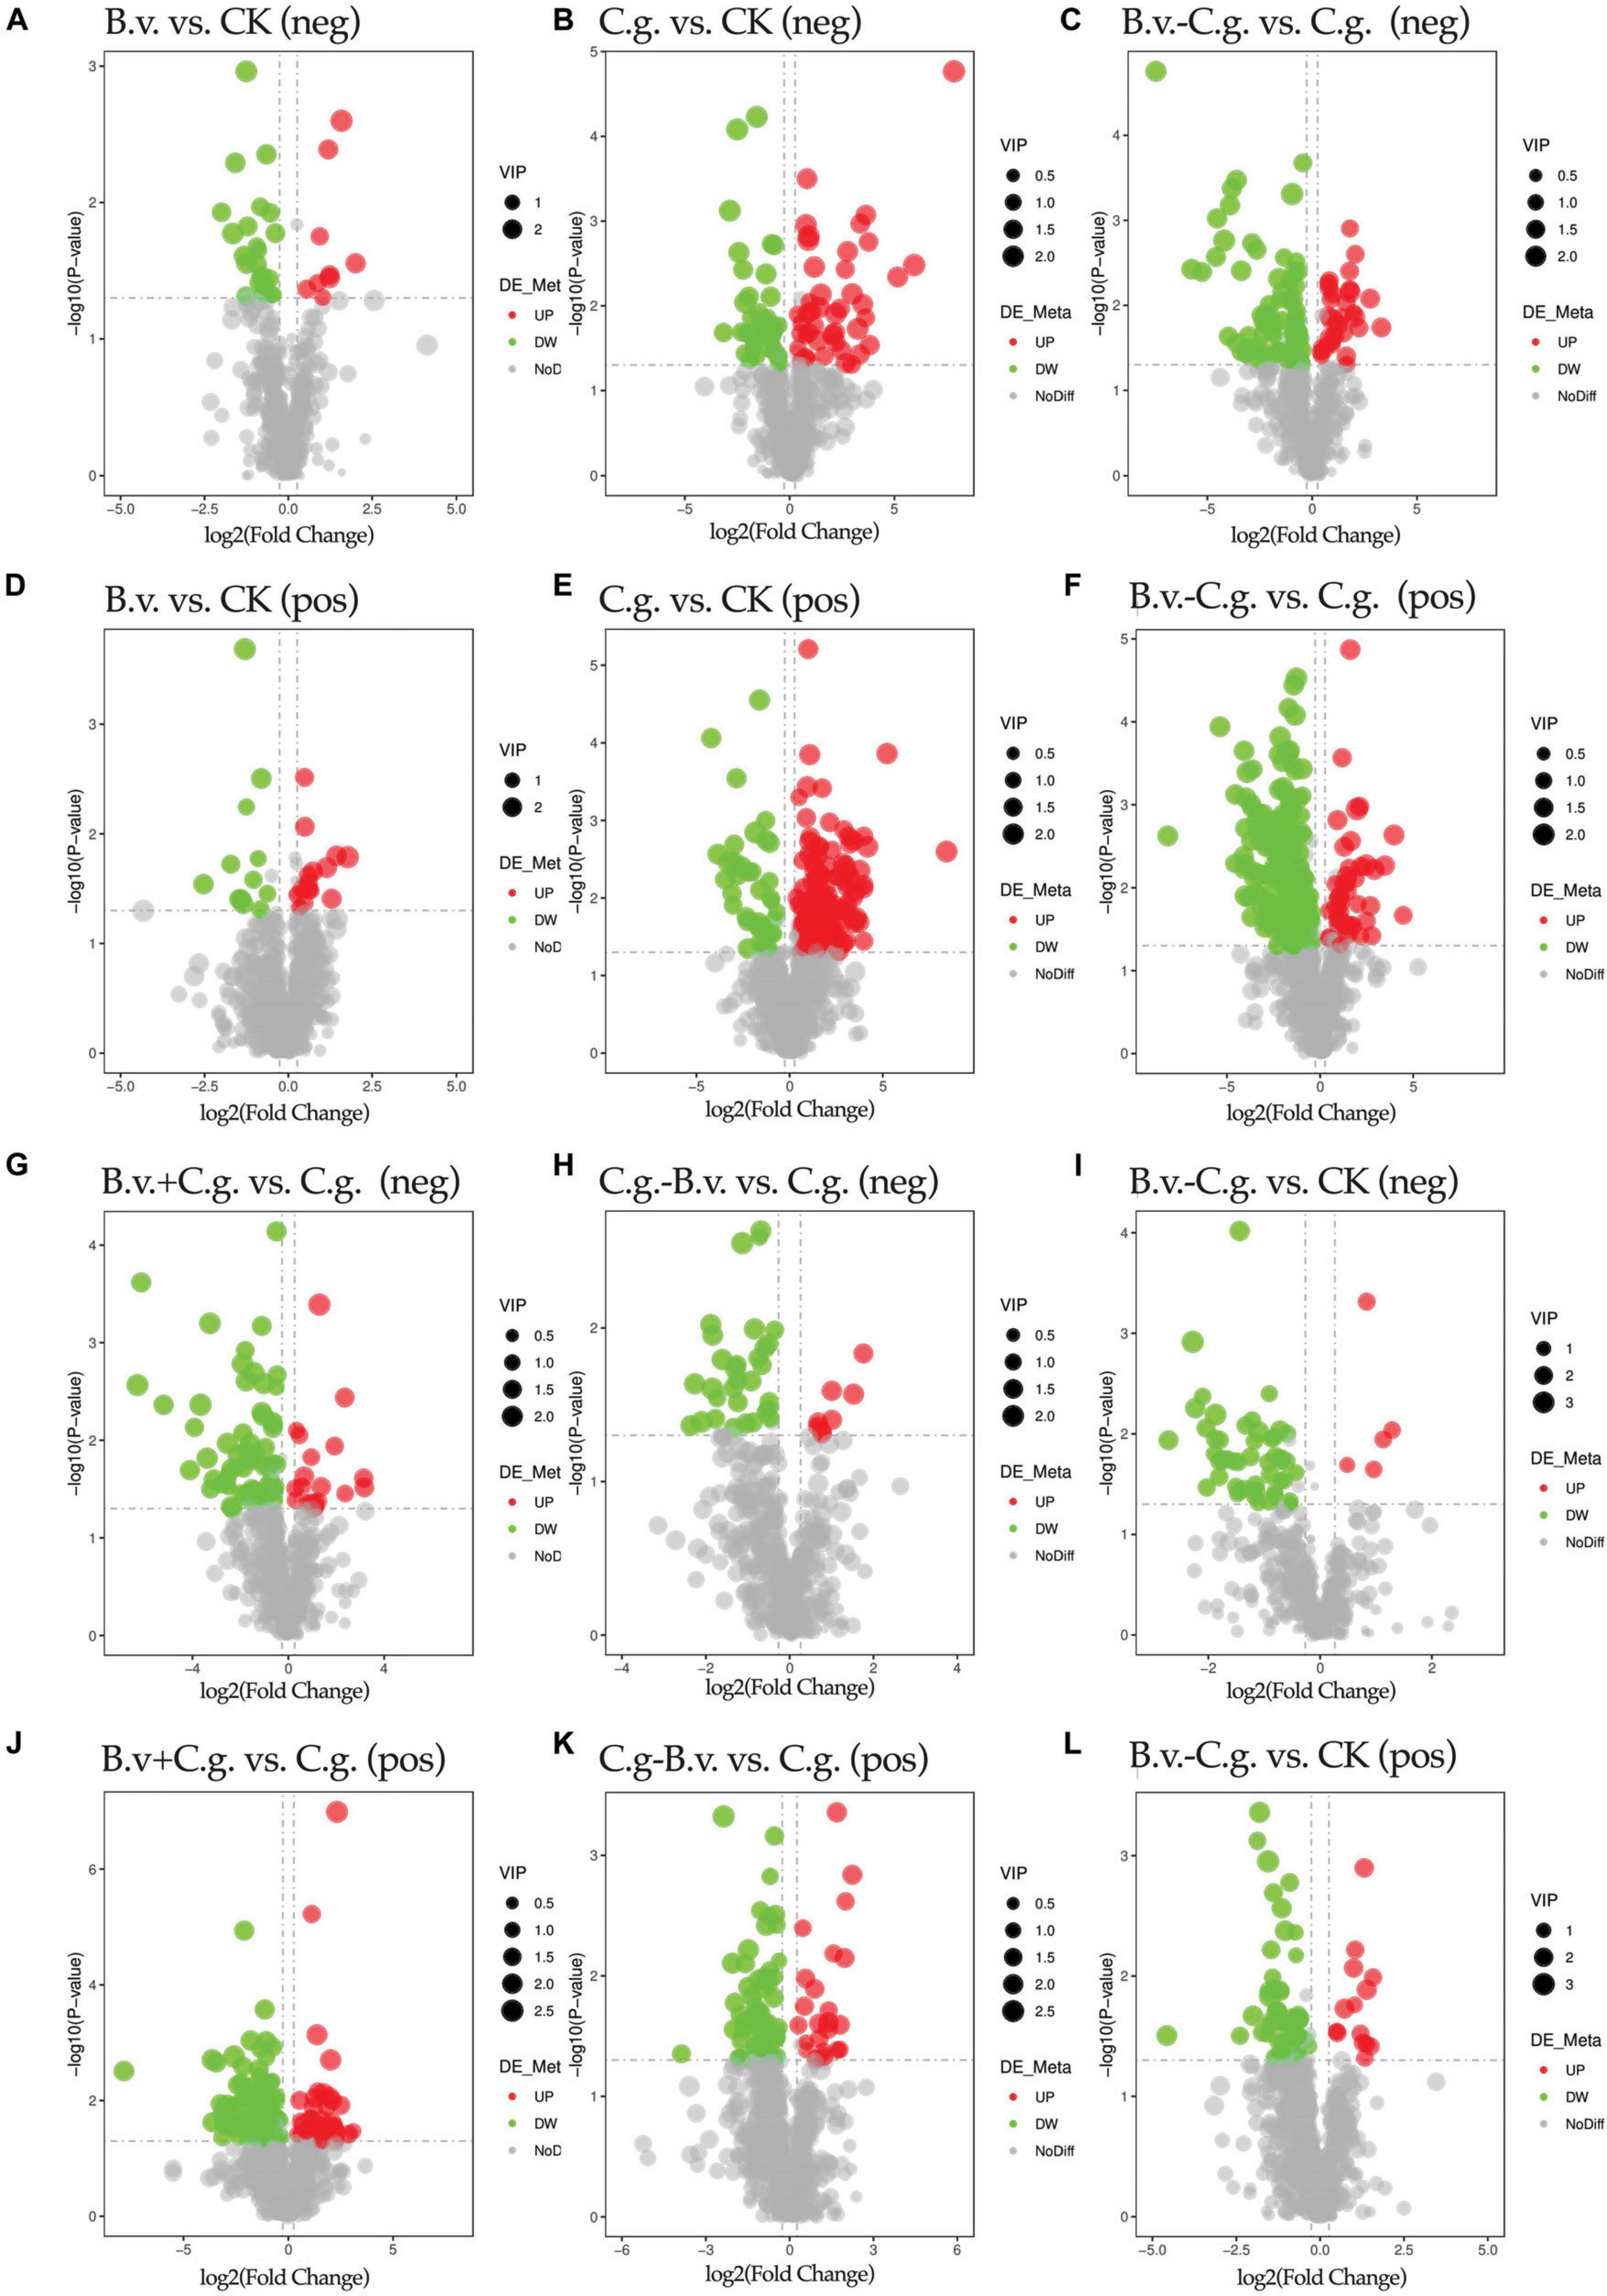
Figure 4. Volcano plot of differential abundance metabolites. Group B.v.: solely inoculated with B. velezensis; Group CK: blank control; Group C.g.: solely inoculated with C. gloeosporioides; Group B.v.–C.g.: B. velezensis first, then C. gloeosporioides; Group B.v.+C.g.: simultaneous inoculation; Group C.g.–B.v.: C. gloeosporioides first, then B. velezensis. (A,B,C,G,H,I) Correspond to the NEG mode; (D,E,F,J,K,L) Correspond to the POS mode. The x-axis represents the log2(Fold Change) of metabolites in different groups, and the y-axis represents the significance level [-log10(P-value)] of the differences. Each point in the volcano plot represents a metabolite, with significantly upregulated metabolites shown in red, significantly downregulated metabolites shown in green, and the size of the dots indicating the VIP (Variable Importance in Projection) value.
Figures 5A, B showed the differential abundance of metabolites between various treatment groups and the control group CK. In the NEG test results, the differential abundance metabolites for B.v. vs. CK, C.g. vs. CK, B.v.−C.g. vs. CK, B.v.+C.g. vs. CK, and C.g.−B.v. vs. CK were 32, 84, 55, 71, and 67, respectively. In the POS test results, these numbers were 27, 160, 72, 100, and 103. The number of differential abundance metabolites between groups and common metabolites varied, indicating distinct metabolic changes. Figures 5C, D compared treatment groups to group C.g. In the NEG test results, the differential abundance metabolites for B.v. vs. CK, C.g. vs. CK, B.v.−C.g. vs. C.g., B.v.+C.g. vs. C.g., and C.g.−B.v. vs. C.g. were 32, 84, 112, 86, and 39, respectively. In the POS test results, these numbers were 27, 160, 244, 132, and 83. These results showed that B. velezensis significantly impacted plant metabolic profiles, whether applied alone, before, simultaneously, or after C. gloeosporioides inoculation. The highest number of differential abundance metabolites was observed in the C. gloeosporioides-treated group C.g. compared to the control group CK and other treatment combinations, especially in the POS test results, indicating a substantial metabolic response to C. gloeosporioides infection. Simultaneous or subsequent application of B. velezensis and C. gloeosporioides resulted in significant metabolic changes, suggesting interactions or metabolic adjustments due to combined stress or biocontrol effects.

Figure 5. The difference between different treatment groups and control group CK, different treatment groups and treatment group C.g. Venn diagram. (A,B) is the difference Venn diagram between different treatment groups and blank control group CK. (C,D) is the difference Venn diagram between different treatment groups and treatment group C.g.
3.2.4 Analysis of KEGG enrichment resultsThe metabolite enrichment results reveal distinct differences among comparison groups in both negative (Figure 6) and positive (Figure 7) modes. In the B.v. vs. CK group, enriched differential abundance metabolites in negative mode primarily concentrate on metabolic pathways and biosynthesis of secondary metabolites, while in positive mode, the focus remains on the biosynthesis of secondary metabolites. This indicates that biosynthesis of secondary metabolites shows significant variation in both modes within the B.v. vs. CK group, highlighting its crucial regulatory role. In the C.g. vs. CK group, enriched differential abundance metabolites in negative mode span multiple metabolic pathways, including biosynthesis of secondary metabolites, metabolic pathways, the pentose phosphate pathway, photosynthetic carbon fixation, carbon metabolism, and biosynthesis of amino acids. In positive mode, the emphasis is again on metabolic pathways and biosynthesis of secondary metabolites, suggesting that metabolite changes in the C.g. vs. CK group involve various metabolic and biosynthetic pathways. This may imply that walnut plants adjust these pathways in response to stress and environmental changes caused by C. gloeosporioides infection. For the B.v.−C.g. vs. C.g. group, differential abundance metabolites enriched in negative mode mainly involve metabolic pathways and biosynthesis of amino acids, while in positive mode, they include arachidonic acid metabolism, vitamin B6 metabolism, steroid biosynthesis, and metabolism of alanine, aspartate, and glutamate among others. This shows that the application of B. velezensis induces walnut plants to adjust various metabolic and biosynthetic pathways in response to C. gloeosporioides infection. In the B.v.+C.g. vs. C.g. group, glutathione metabolism is predominantly enriched in negative mode, while in positive mode, differential abundance metabolites include metabolism of alanine, aspartate, glutamate, arginine biosynthesis, and purine metabolism. This suggests that glutathione metabolism undergoes significant changes in negative mode, and various metabolic and biosynthetic pathways are affected in positive mode due to B. velezensis application, helping to reduce the severity of C. gloeosporioides infection. The C.g.−B.v. vs. C.g. group shows fewer enriched differential abundance metabolites in negative mode, but in positive mode, enrichment mainly involves purine metabolism, phenylalanine metabolism, and biosynthesis of phenylpropanoid substances. This indicates a relatively minor difference in this comparison group, yet B. velezensis treatment still modulates walnut plant metabolic pathways. In the B.v.−C.g. vs. CK group, differential metabolite enrichment in the negative mode primarily involved the biosynthesis of secondary metabolites and carbon fixation during photosynthesis. This indicated that simultaneous application of B. velezensis and C. gloeosporioides induced adjustments in walnut leaf secondary metabolism and optimized carbon fixation during photosynthesis, crucial for enhancing plant adaptation to environmental stress and growth efficiency. In the positive mode, enriched metabolites included pathways such as alanine, aspartate, and glutamate metabolism, which likely played a role in regulating processes such as amino acid biosynthesis, pyrimidine metabolism, and aminoacyl-tRNA biosynthesis in walnut leaf tissues. Additionally, pathways like ABC transporters showed enrichment, potentially contributing to enhancing walnut plant resistance against the pathogen C. gloeosporioides. Overall, the enrichment results of metabolites in negative and positive modes across different comparison groups demonstrate that walnut plants undergo significant regulatory changes in their metabolic and biosynthetic pathways when infected by C. gloeosporioides or treated with B. velezensis, enhancing resistance against the pathogen.
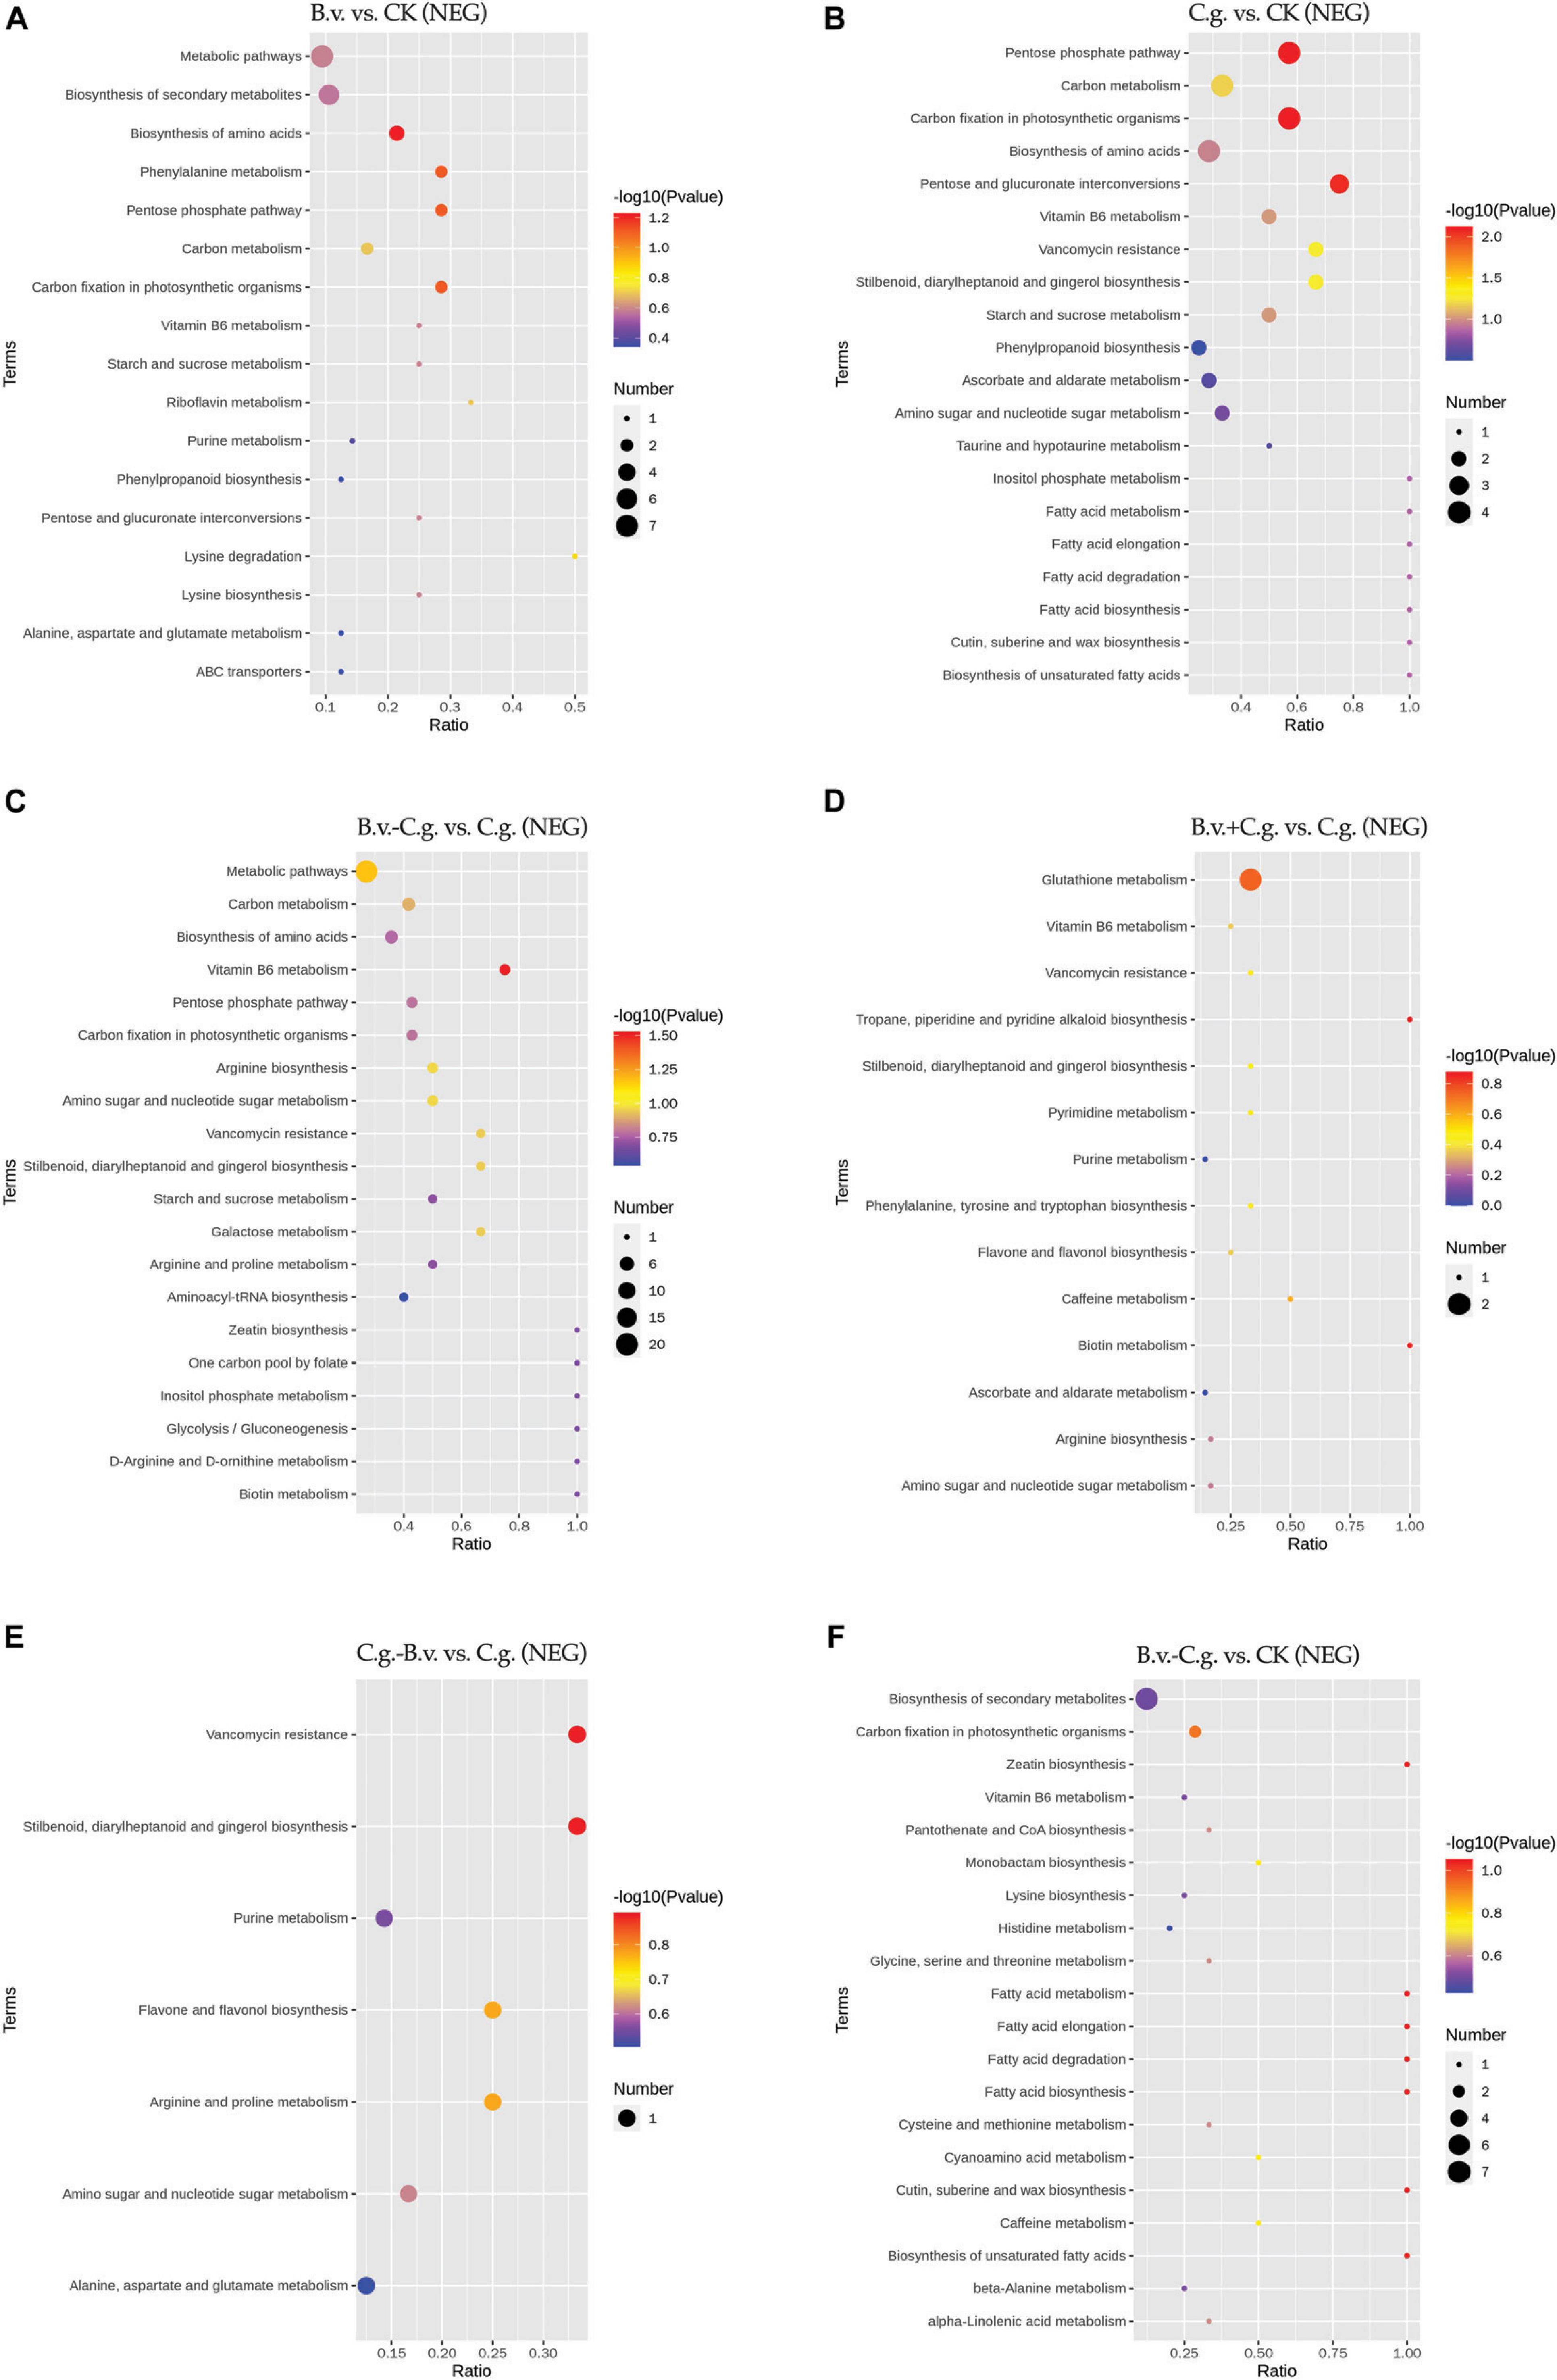
Figure 6. KEGG pathway bubble chart (NEG mode). Group B.v.: solely inoculated with B. velezensis; Group CK: blank control; Group C.g.: solely inoculated with C. gloeosporioides; Group B.v.–C.g.: B. velezensis first, then C. gloeosporioides; Group B.v.+C.g.: simultaneous inoculation; Group C.g.–B.v.: C. gloeosporioides first, then B. velezensis. (A): B.v. vs. CK ; (B): C.g. vs. CK; (C): B.v.-C.g. vs. C.g.; (D): B.v.+C.g. vs. C.g.; (E): C.g.-B.v. vs. C.g.; (F): B.v.-C.g. vs. CK. Each figure presented the top 20 significantly enriched metabolic pathways in the KEGG enrichment analysis. The x/y axis in the figure represented the number of differential abundance metabolites/total identified metabolites in each pathway, indicating higher enrichment levels with larger values. The color of the points indicated the P-value of the hypergeometric test, with smaller values signifying greater reliability and statistical significance. Point size denoted the number of differential abundance metabolites in each pathway, with larger sizes indicating greater differential expression.
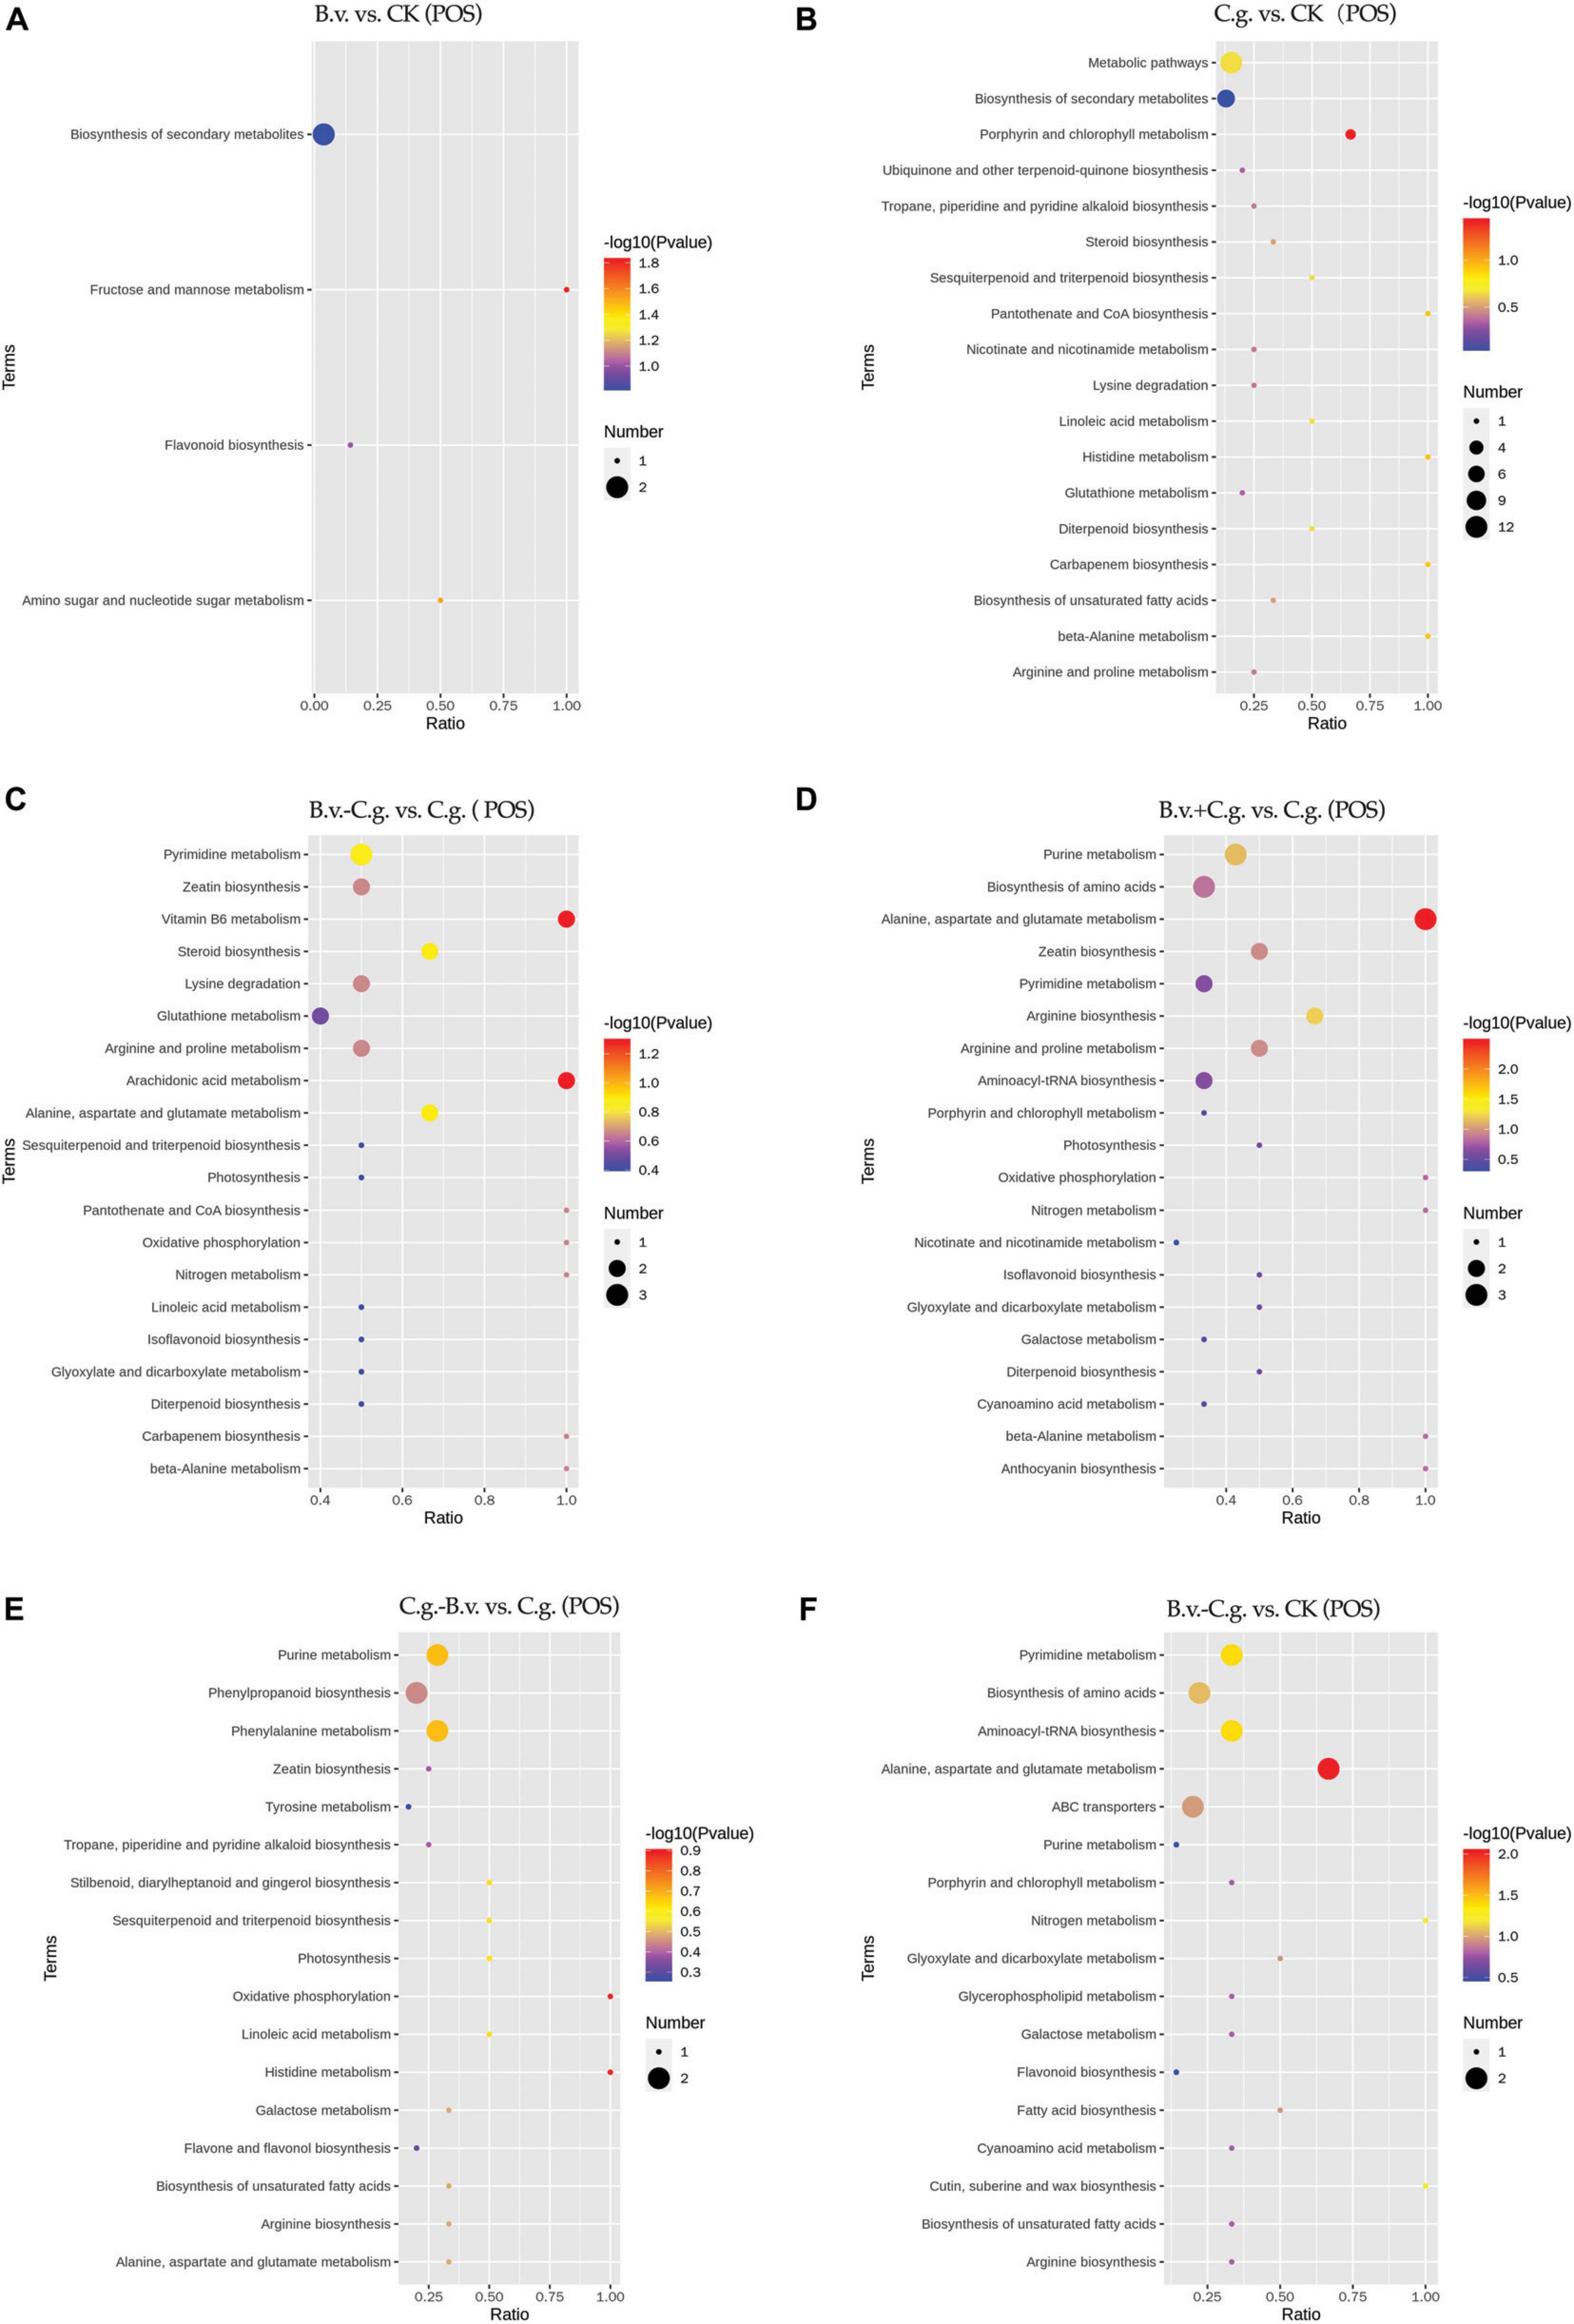
Figure 7. KEGG pathway bubble chart (POS mode). Group B.v.: solely inoculated with B. velezensis; Group CK: blank control; Group C.g.: solely inoculated with C. gloeosporioides; Group B.v.–C.g.: B. velezensis first, then C. gloeosporioides; Group B.v.+C.g.: simultaneous inoculation; Group C.g.–B.v.: C. gloeosporioides first, then B. velezensis. (A): B.v. vs. CK; (B): C.g. vs. CK; (C): B.v.-C.g. vs. C.g.; (D): B.v.+C. g. vs. C.g.; (E): C.g.-B.v. vs. C.g.; (F): B.v.-C.g. vs. CK. Each figure presented the top 20 significantly enriched metabolic pathways in the KEGG enrichment analysis. The x/y axis in the figure represented the number of differential abundance metabolites/total identified metabolites in each pathway, indicating higher enrichment levels with larger values. The color of the points indicated the P-value of the hypergeometric test, with smaller values signifying greater reliability and statistical significance. Point size denoted the number of differential abundance metabolites in each pathway, with larger sizes indicating greater differential expression.
3.3 Integrative transcriptomic and metabolomic analysisIn the four comparison pairs analyzed (Figure 8), the C.g. vs. CK pair showed the highest enrichment of differentially expressed genes and differential abundance metabolites, indicating significant differences between healthy and diseased walnut plants. This suggests that C. gloeosporioides infection significantly impacts gene regulation and metabolic pathways in walnut plants, leading to considerable biological differences. Meanwhile, the C.g.−B.v. vs. CK comparison exhibited fewer differentially expressed genes and differential abundance metabolites than the C.g. vs. CK pair, indicating that B. velezensis-treated diseased plants have fewer differences compared to healthy plants. This suggests that B. velezensis treatment may significantly alter walnut plants, reducing differences between diseased and healthy plants. The B.v. vs. CK pair had the fewest enriched genes and metabolites, suggesting minimal biological differences between B. velezensis-treated healthy walnut plants and untreated controls, indicating B. velezensis treatment introduces minimal additional variation. In contrast, C.g.−B.v. vs. CK showed more differences in genes and metabolites compared to C.g.−B.v. vs. C.g., reflecting the significant impact of C. gloeosporioides infection and B. velezensis treatment on walnut plants. The B.v. vs. CK comparison in negative mode showed significant enrichment in amino acid synthesis, carbon fixation in photosynthesis, carbon metabolism, starch and sucrose metabolism, alanine, aspartate, and glutamate metabolism, and phenylpropanoid biosynthesis. In positive mode, significant enrichment was observed in amino sugar and nucleotide sugar metabolism, and flavonoid biosynthesis, indicating changes in key metabolic pathways in B. velezensis-treated healthy walnut plants compared to untreated ones. These changes reflect the significant impact of B. velezensis treatment on the physiological state and metabolism of walnut plants, affecting growth, photosynthesis, carbon metabolism, amino acid metabolism, and secondary metabolism. In the C.g. vs. CK comparison in negative mode, diseased plants showed significant differences from healthy ones in energy metabolism, photosynthesis, carbon metabolism, starch and sucrose metabolism, and amino acid biosynthesis. In positive mode, differences in beta-alanine metabolism, steroid biosynthesis, alkaloid metabolism, and glutathione metabolism were observed, highlighting the metabolic differences between diseased and healthy walnut plants. After B. velezensis treatment in the C.g.−B.v. vs. CK pair, significant enrichment was seen in photosynthesis, carbon metabolism, wax synthesis, inositol phosphate metabolism, amino acid metabolism, purine metabolism, and alpha-linolenic acid metabolism in negative mode. In positive mode, differences in cysteine and methionine metabolism, phospholipid metabolism, zeatin biosynthesis, glutathione metabolism, purine metabolism, and flavonoid biosynthesis were noted, indicating B. velezensis treatment’s impact on these pathways. Notably, the C.g. vs. CK and C.g.−B.v. vs. CK pairs shared common enriched pathways in negative mode, such as amino acid biosynthesis, starch and sucrose metabolism, carbon fixation in photosynthesis, and carbon metabolism, and in positive mode, glutathione metabolism was commonly enriched. This suggests common differences in these pathways between diseased and healthy plants and those treated with B. velezensis, indicating their importance in disease resistance and post-treatment adjustments. In the C.g.−B.v. vs. C.g. comparison in negative mode, significant enrichment in purine metabolism was observed, highlighting differences in this pathway between B. velezensis-treated diseased plants and their diseased counterparts. In positive mode, oxidative phosphorylation, purine metabolism, photosynthesis, unsaturated fatty acid biosynthesis, phenylpropanoid biosynthesis, zeatin biosynthesis, and tyrosine metabolism showed significant differences, indicating potential metabolic adjustments in B. velezensis-treated diseased plants compared to diseased ones in these aspects.
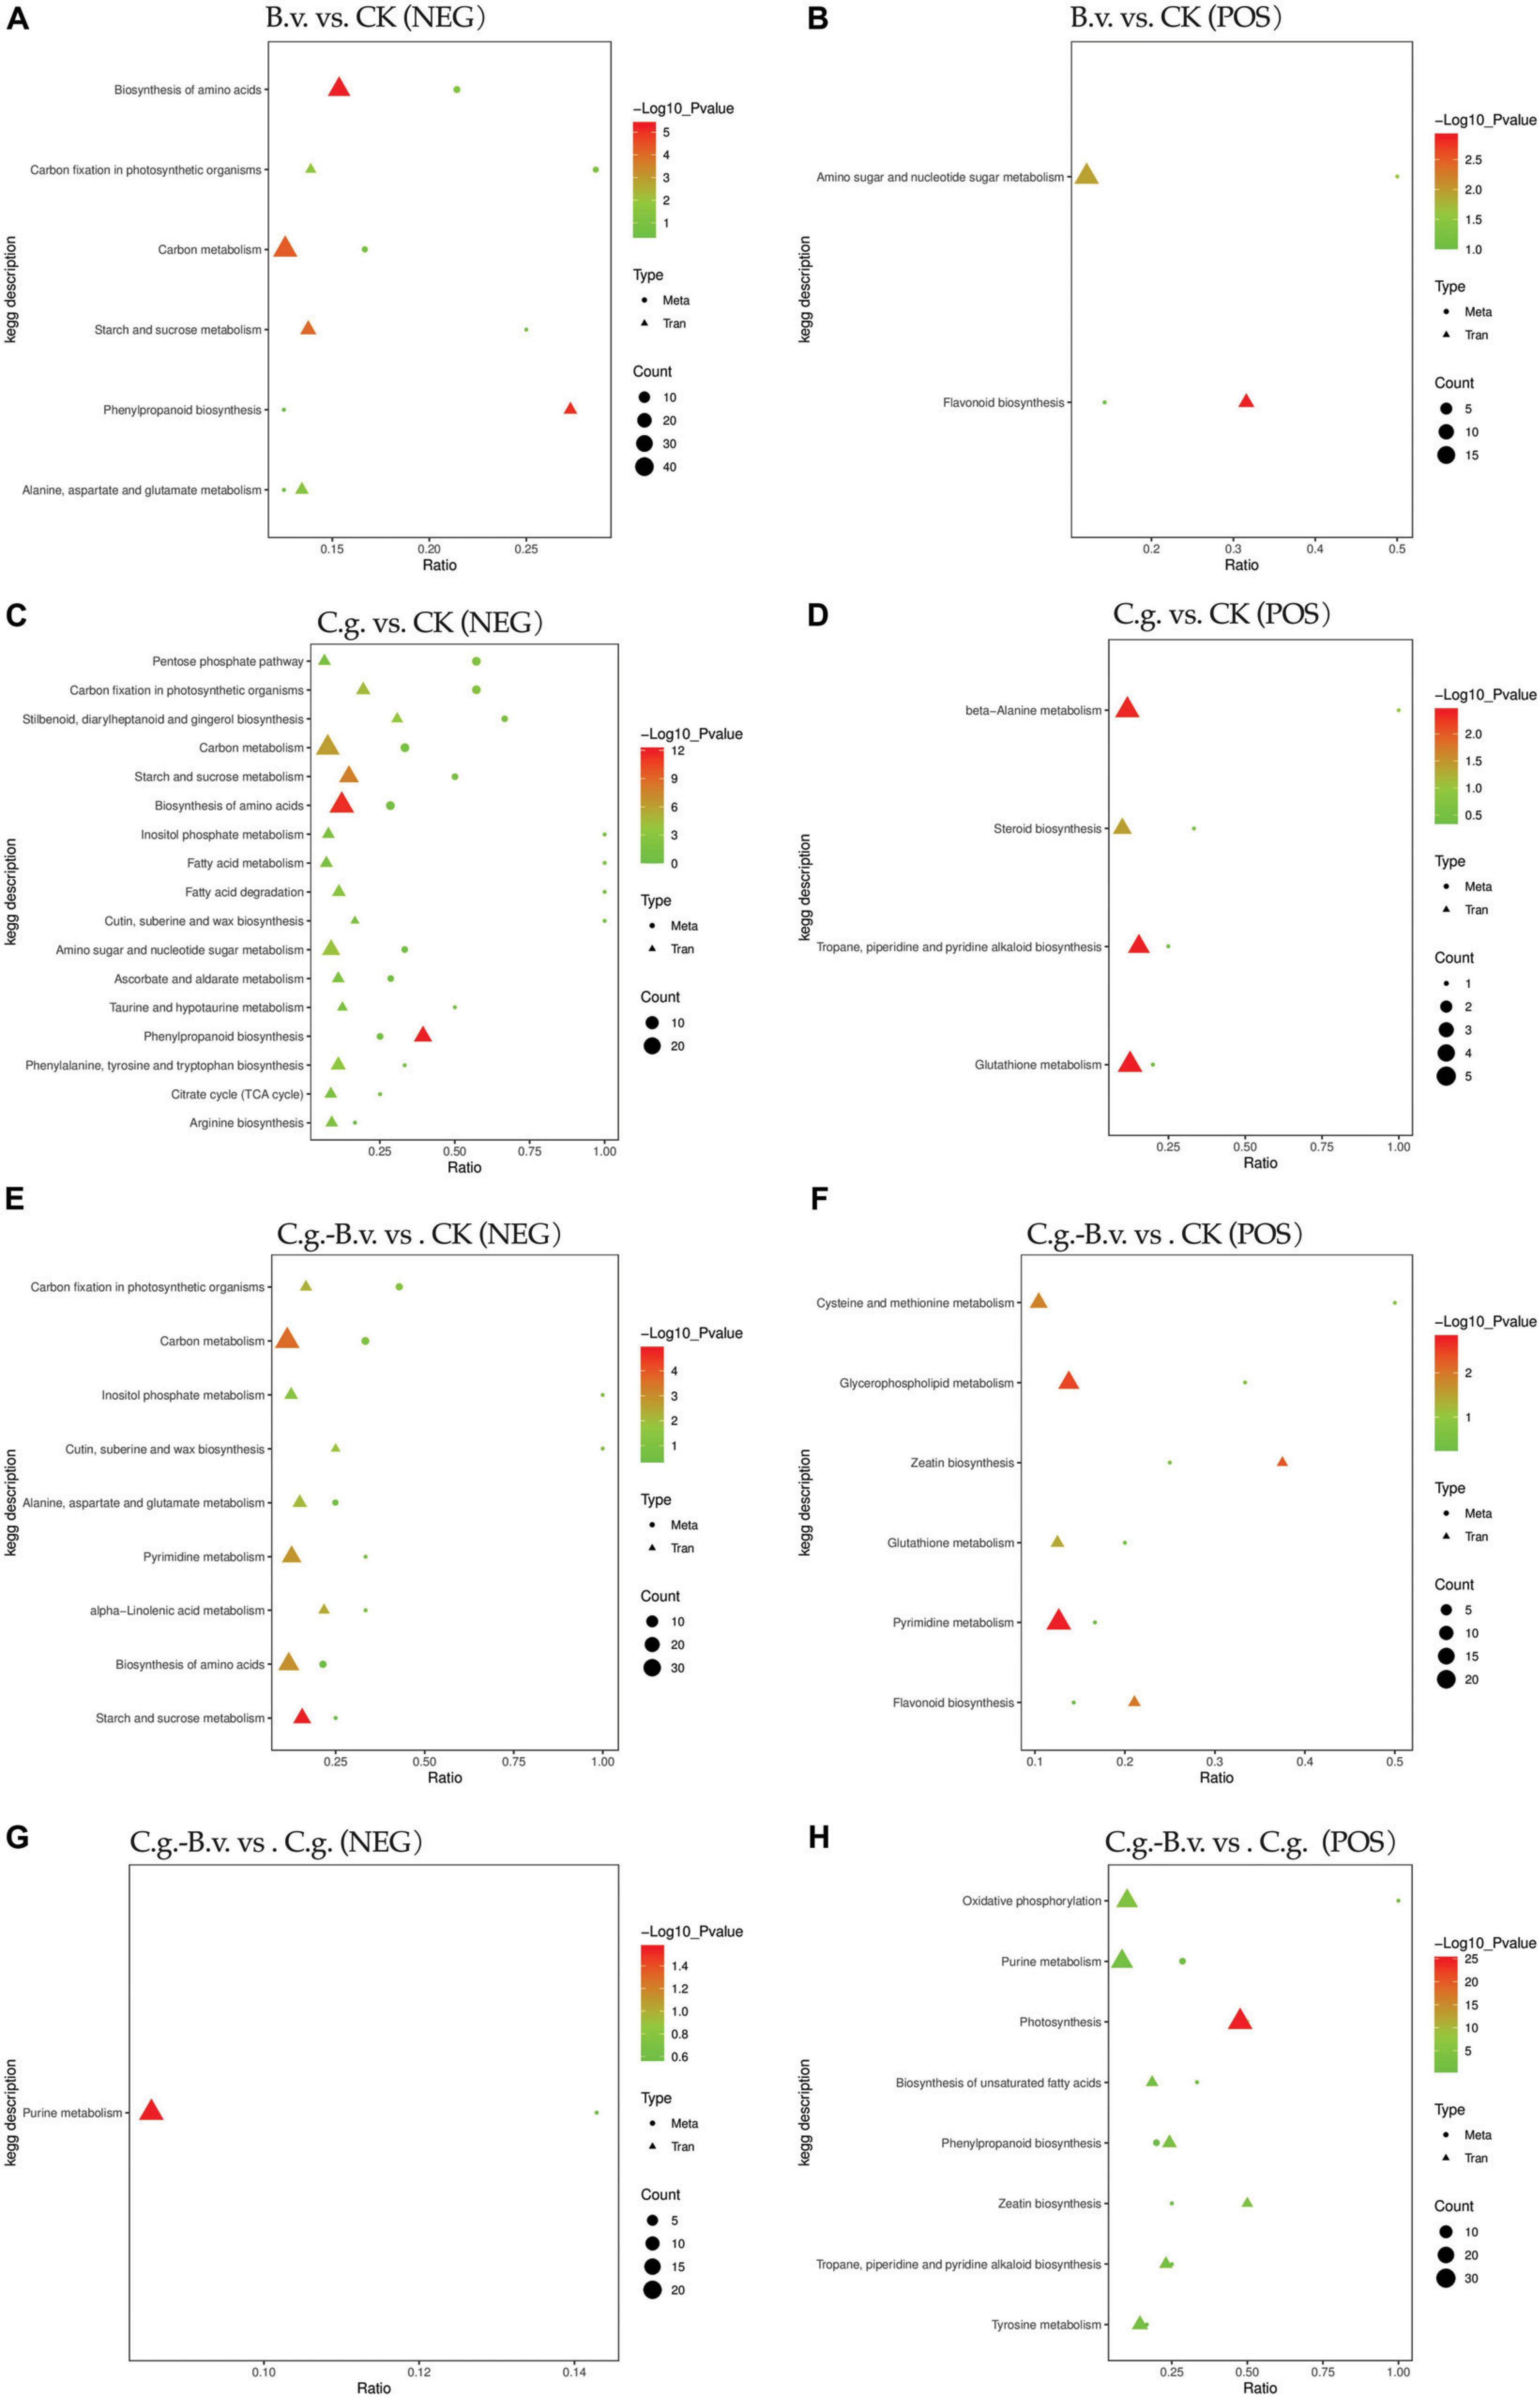
Figure 8. KEGG enrichment bubble plots of differentially expressed genes and differential abundance metabolites. Group B.v.: solely inoculated with B. velezensis; Group CK: blank control; Group C.g.: solely inoculated with C. gloeosporioides; Group B.v.–C.g.: B. velezensis first, then C. gloeosporioides; Group B.v.+C.g.: simultaneous inoculation; Group C.g.–B.v.: C. gloeosporioides first, then B. velezensis. (A,C,E,G) represented the neg mode; (B,D,F,H) represented the pos mode. The x-axis showed the ratio of enriched differential abundance metabolites or differentially expressed genes to annotated metabolites or genes in each pathway (Ratio). The y-axis displayed KEGG pathways enriched in both the metabolome and transcriptome. Count indicated the number of enriched metabolites or genes in each pathway. Colors represented P-values, with lighter colors indicating smaller, more significant pathway enrichments.
Based on the combined analysis results from KEGG, a collection and organization of involved differential abundance metabolites and genes were conducted. Given the extensive number of differential genes involved, only those genes that appeared repeatedly across multiple pathways were selected and displayed, as detailed in Table 1. Among the three comparison pairs analyzed, the C.g. vs. CK pair had the highest number of differential abundance metabolites, indicating the most pronounced differences between the two groups. In the B.v. vs. CK comparison, 8 metabolites were identified with differential abundance alongside 34 key differential genes such as LOC108985009, which are implicated in the regulation of these metabolites. The application of B. velezensis significantly altered several metabolic pathways, including carbon metabolism, carbon fixation in photosynthesis, and amino acid biosynthesis. Specifically, within the amino sugar and nucleotide sugar metabolism pathway, 18 genes showed differential expression leading to the upregulation of d-mannose 6-phosphate, suggesting an enhancement in cell wall strength and integrity which could improve the plant’s resistance to the anthracnose pathogen, C. gloeosporioides. Furthermore, the C.g. vs. CK comparison revealed downregulation of metabolites such as α,α-trehalose, affecting pathways like the pentose phosphate pathway, carbon fixation in photosynthesis, carbon metabolism, and amino acid biosynthesis. This downregulation likely reflects metabolic adjustments wherein walnut plants economize energy and resources to combat pathogenic attacks. Conversely, metabolites such as pipecolic acid were upregulated, signaling an activation of defense mechanisms post-pathogen inoculation that enhance cell wall fortification, synthesize defensive secondary metabolites, and adjust energy metabolism and stress responses. Notably, the increase in levels of palmitic acid and ferulic acid underscores the strengthening of cell wall integrity through improved membrane stability and lignin synthesis, respectively, enhancing resistance to biological invasion. In the C.g.−B.v. vs. C.g. comparison, six differential abundance metabolites showed downregulation while two were upregulated in the C.g.−B.v. group. Downregulated metabolites such as lupinine, linoleic acid, salidroside, isoeugenol, and cyclic AMP, are involved in pathways including tropane, piperidine, and pyridine alkaloid biosynthesis, oxidative phosphorylation, and purine metabolism. This pattern suggests that B. velezensis may facilitate physiological optimizations that reduce the consumption of energy and resources, thereby enabling more effective pathogen defense. On the other hand, the upregulation of coumarin and adenosine 5′-diphosphate (ADP) in pathways such as phenylpropanoid biosynthesis and oxidative phosphorylation likely promotes the synthesis of metabolites that enhance disease resistance and photosynthetic efficiency. In particular, coumarin’s involvement in antioxidative processes and ADP’s role in energy transformation and signaling underscore their importance in the plant’s adaptive responses to environmental stress.
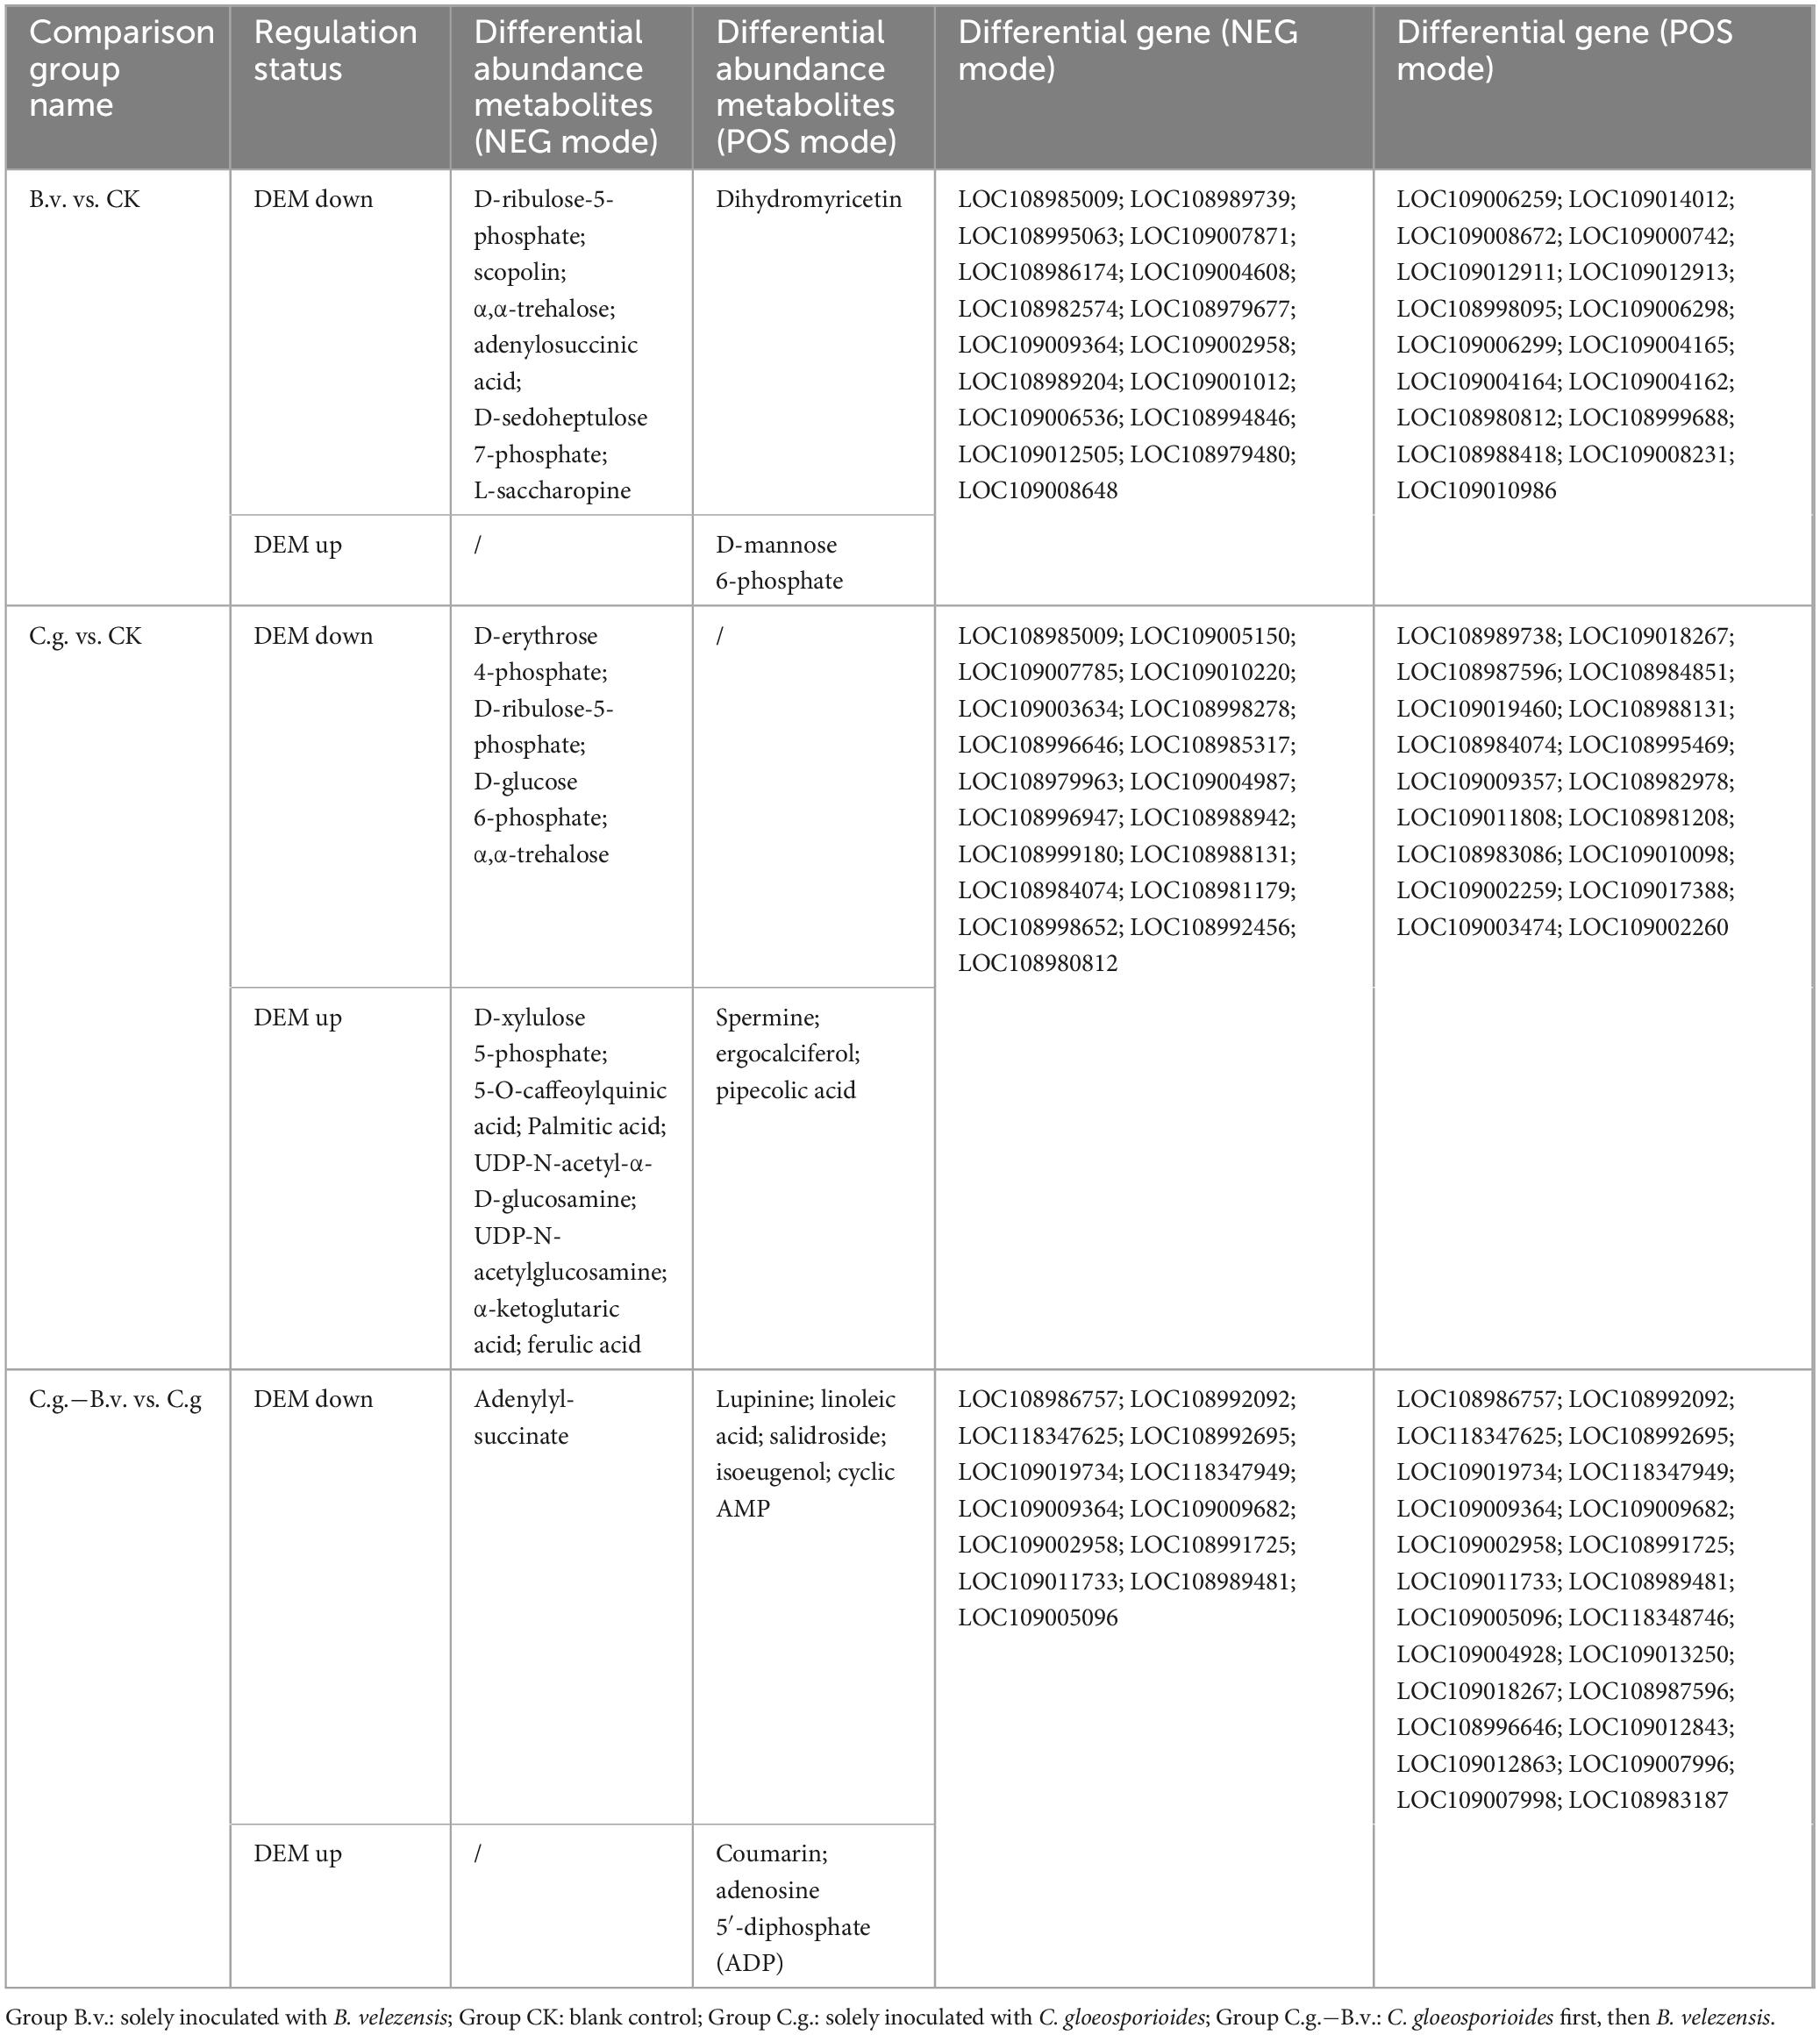
Table 1. Differential metabolite statistics from transcriptomic and metabolomic association analysis.
留言 (0)